

Vertigo3d/E+ via Getty Images
Thesis and Background
Like many of you, I started my investment journey with a belief in the “common sense” that leveraged ETFs are bad, which really is only a myth after careful thinking and examination. Others (Tony Cooper for example) have done an excellent job examining and busting this myth.
The upshot is that there is nothing wrong or mystical about leverage ETFs (SPY itself can be viewed as a leveraged ETF with a leverage ratio of 1). Although you need to be careful with the following caveats:
- You need to be aware of the increased volatility.
- You need to manage the positions so that the boost in return can compensate for the fees charged by leveraged ETFs (the fee drag).
- You need to manage the positions so that the boost in return can compensate for the loss of dividend due to holding leveraged ETFs (the dividend drag).
- Lastly, you also need to be aware of the so-call volatility drag as explained in detail in the last section.
In this article, we use our aggressive growth portfolio (“AGP”) to illustrate the method we use to seek aggressive growth using leverage funds in a disciplined way and overcome the above caveats. And we will use the ProShares UltraPro S&P500 (NYSEARCA:UPRO) and ProShares Ultra S&P500 (NYSEARCA:SSO) as examples to illustrate the inner workings of this method. The method is based on the following simple yet timeless concepts:
- Opportunistic equity-bond rebalance. We use an equity-bond index to A) monitor the adjusted yield spread between equity and bonds, and B) opportunistically allocate equity funds.
- Dynamic leverage. Then once the equity allocation is determined, we use an algorithm to systematically adjust leverage based on volatility and market valuation to generate reliable long-term aggressive growth.
As you can see from our holdings below, we are currently maintaining a target allocation of about an 8.3% leverage fund in our AGP. What we actually hold is TQQQ, which you can exchange with UPRO and SSO with no impact on performance. And we will detail the reasons why we hold TQQQ toward the end.
Author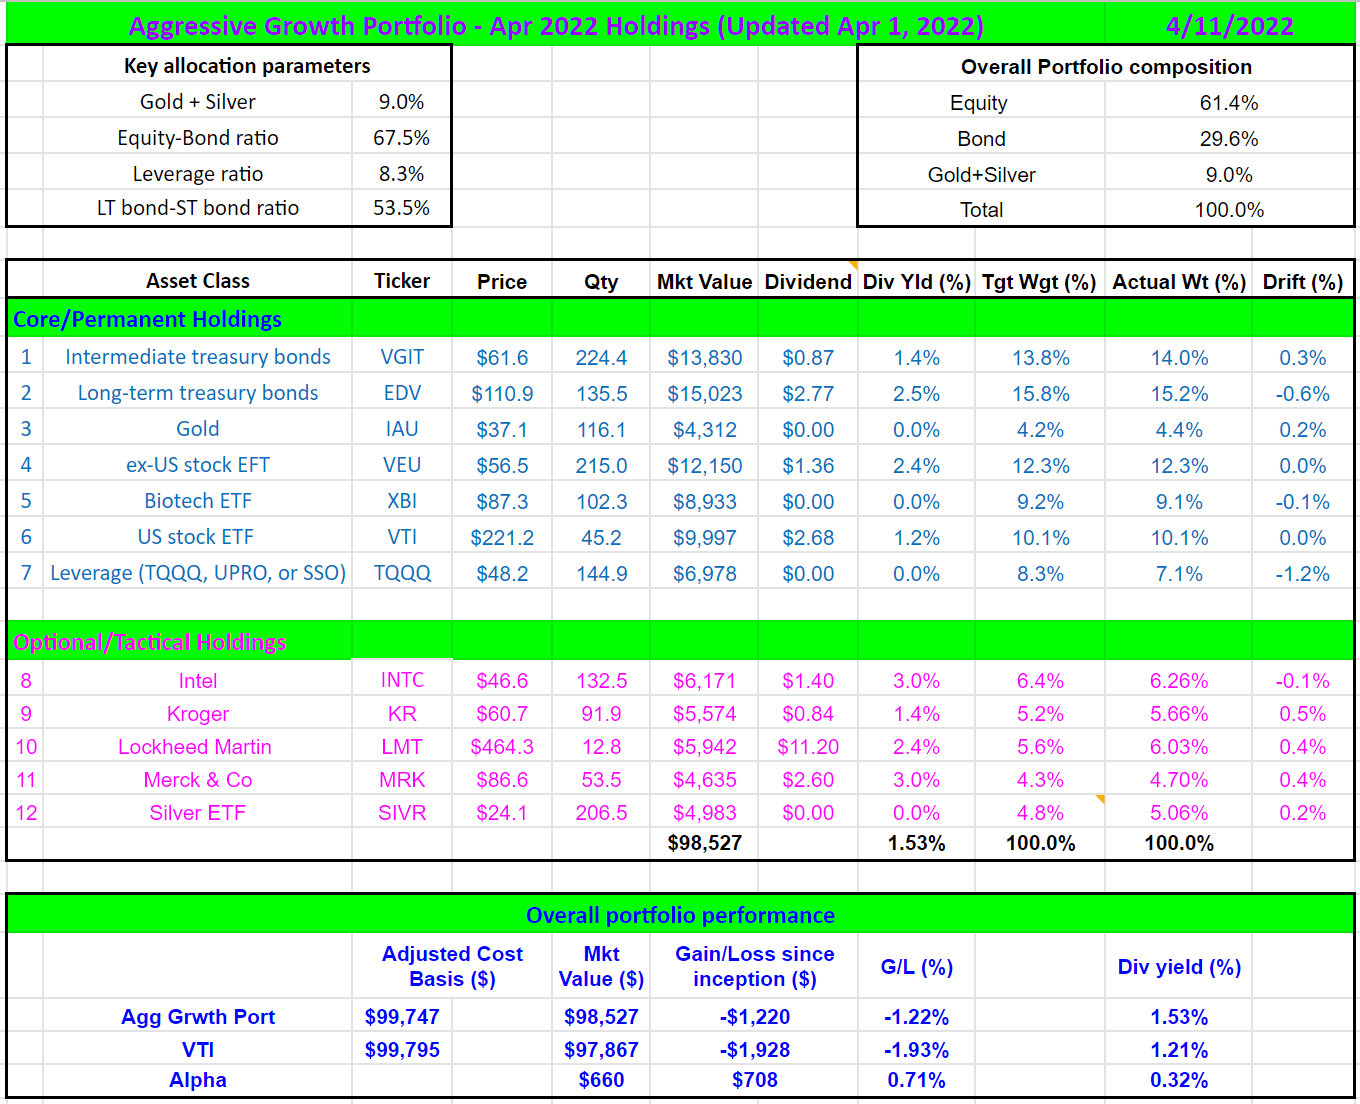
The next chart shows the performance of our AGP relative to the overall market since Feb 1, 2022, the date we officially published our AGP with our marketplace service members. The long-term performance is reported later in this article. As you can see, as of April 1 (the day we performed our April maintenance), our AGP portfolio gained 2.06% since Feb 1, 2022. The overall market gained about 1.24%, lagging our portfolio in relative terms by about 0.83%.
Furthermore, you can see that our AGP not only outperformed the overall market, but it also has not lost money since Feb 1 on a monthly basis – despite all the turmoil that has transpired since Feb 1 (even a war)! The overall market, in contrast, suffered a loss of almost 4% in March. This serves as a small anecdote against the myth about leveraged ETFs being “bad”.
Author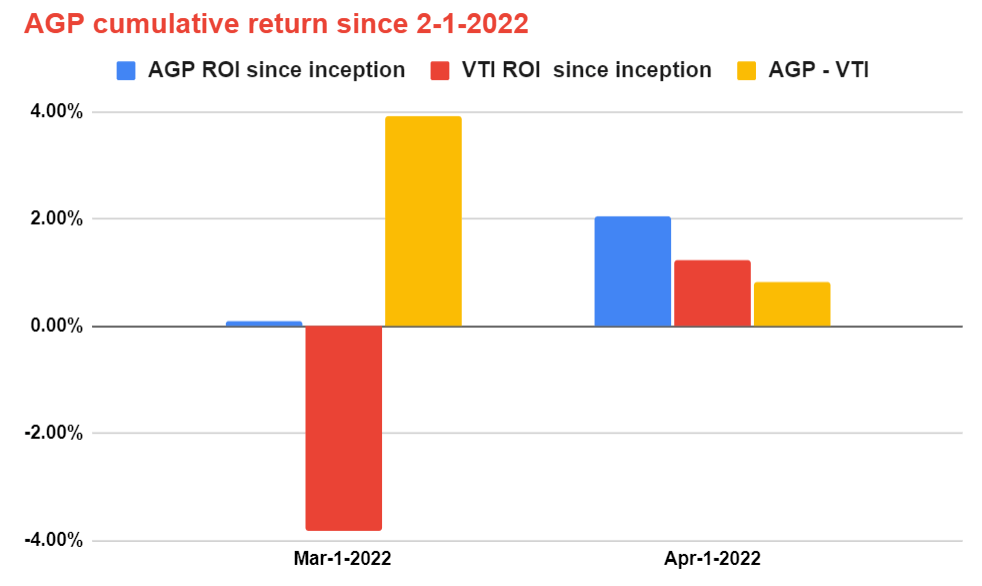
UPRO and SSO: basic information
Here we first briefly recap the basic information of both funds before we move on to further details. Both funds provide a vehicle for investors seeking magnified gains (which will also magnify losses) of the S&P 500 index. The difference is that UPRO provides 3x leveraged exposure on a daily basis, and SSO provides 2x leverage exposure on a daily basis.
A few highlights about these funds:
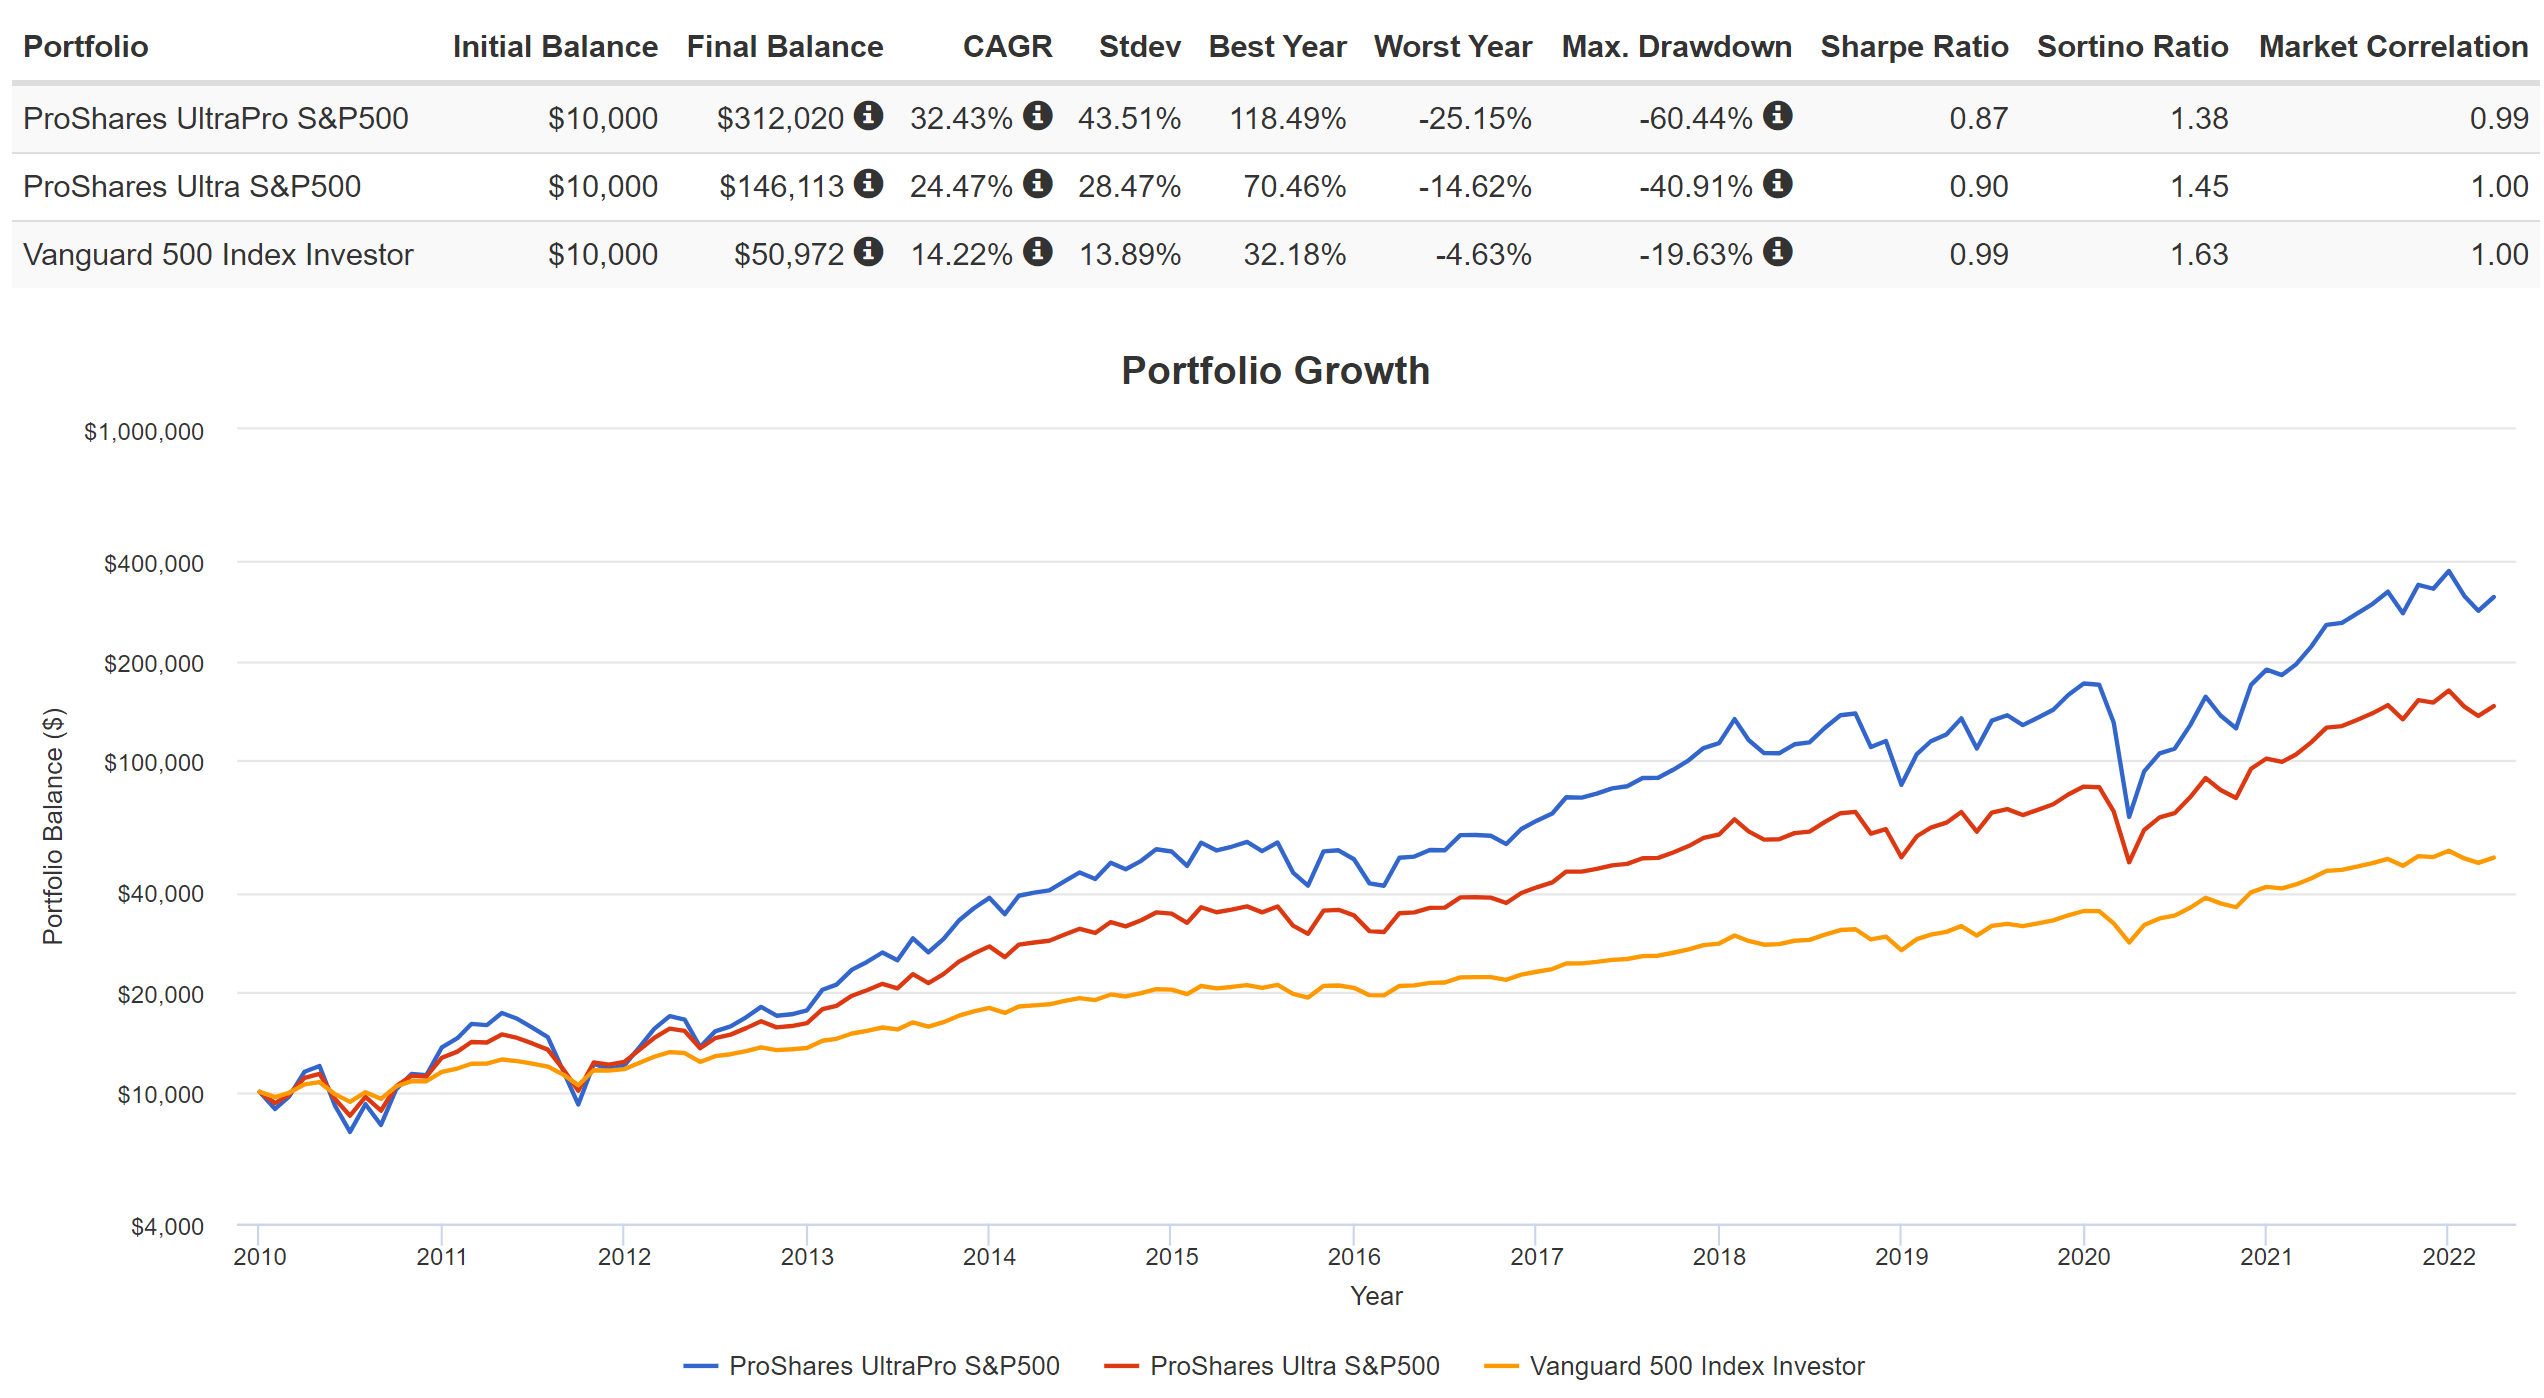
- Expense ratio. As you can see, UPRO charges a 0.91% expense ratio and SSO 0.89%, both significantly higher than most of the popular unleveraged funds (as an example, SPY charges a 0.09% of expense ratio). As aforementioned, you need to manage the positions so that the boost in return can at least compensate for the extra fees.
- Correlation with the S&P 500 index. You can also see that both funds are closely correlated with the underlying S&P 500 index. The correlation coefficients are almost perfectly 1.0 for both funds.
- Volatility. As you can see, the price volatility of UPRO and SSO, in terms of standard deviation and maximum drawdowns, has been close to 3x and 2x of the underlying S&P 500 index. There is expected because of their leveraged nature. However, investors do have to be aware of the large volatility and stay disciplined with their use as to be detailed later.
Source: Seeking Alpha www.portfoliovisualizer.com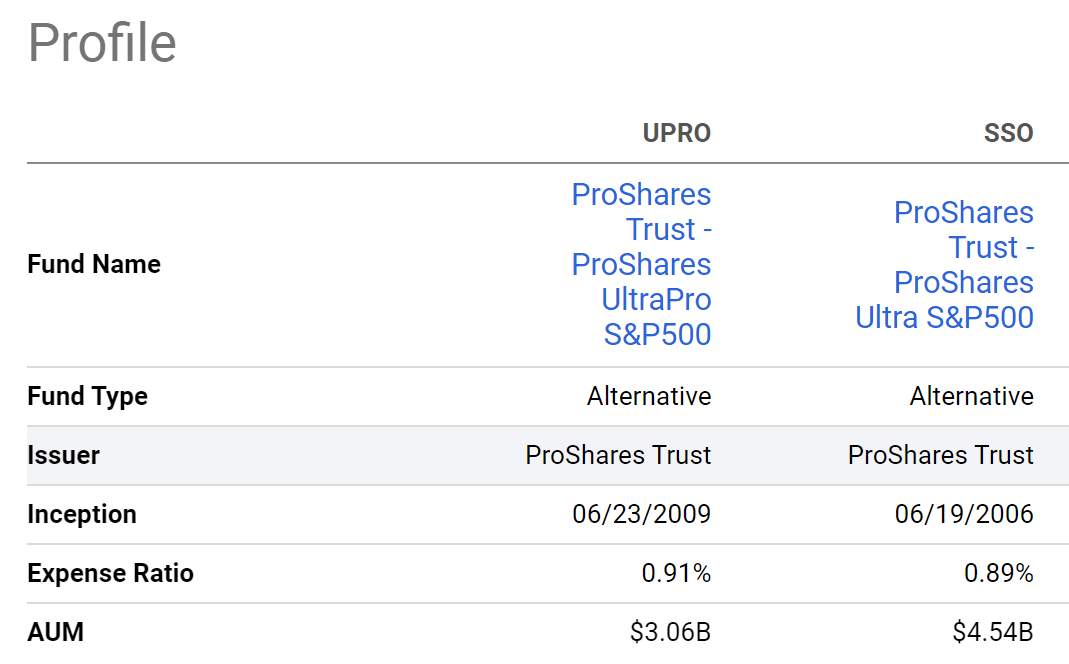
How UPRO and SSO can help with aggressive growth?
Many of you reading this probably know about Ray Dalio’s All-Weather Portfolio (“AWP”). It is an approach to provide portfolio-level diversification using four different asset classes (stocks, bonds, commodities, and gold) in the following ratios.
- 30% US stocks
- 40% long-term treasuries
- 15% intermediate-term treasuries
- 7.5% commodities, diversified
- 7.5% gold
You can see details of our thoughts and reservations on the AWP in our earlier article. As a summary:
- First, it might be too conservative for many investors (with only 30% stocks).
- The fixed allocation does not make intuitive sense. As a recent example, during the 2020 March COVID-19 crash, treasury yields dropped to a level (0.6% for 10-year maturity) that Dalio himself considered silly to own government bonds. Yet if you stick to the original AWP, you would still be holding 55% of government bonds in your portfolio.
Recognizing the above issues, we have been researching ways to revise it to a version that is more applicable to us. And the methods we described here are the culmination of our own research, proven and vetted by our own experiences since about 2012. The key strategies are:
-
We do not hold commodities.
-
We use 30% as the floor for stock allocation and add to it based on the yield spread between the overall stock market and 10-year treasury yield.
-
We use leverage dynamically to achieve aggressive growth. Details of this concept are explained in the paper by Tony Cooper (linked above). The key concept is shown in the chart below. The horizontal axis shows the leverage used and the vertical axis shows the compound annual percentage return (using more than 100 years of stock market data). The orange circles show the popular leverage rates of 1x (e.g., SPY), 2x (i.e., SSO), and 3x (and UPRO). And as you can see, without any leveraged, the average annual return is about 4%. Note the return we quote here is only the capital appreciation and the dividends are excluded. As you increase the leverage from 1x, it increases the annualized return. For example, increasing the leverage to 2x would generate an average annualized return of about 5%. Do not overlook the extra alpha of 1%. One more percent of the compounding rate over the long run can create financial miracles. But then, you cannot overdo it. Further increasing the leverage will begin to hurt performance.
To summarize, the takeaway is that a proper level of leverage helps to create additional alpha in the long run. And we will see next how to systematically adjust the leverage.
Source: Alpha Generation and Risk Smoothing using Managed Volatility by Tony Cooper.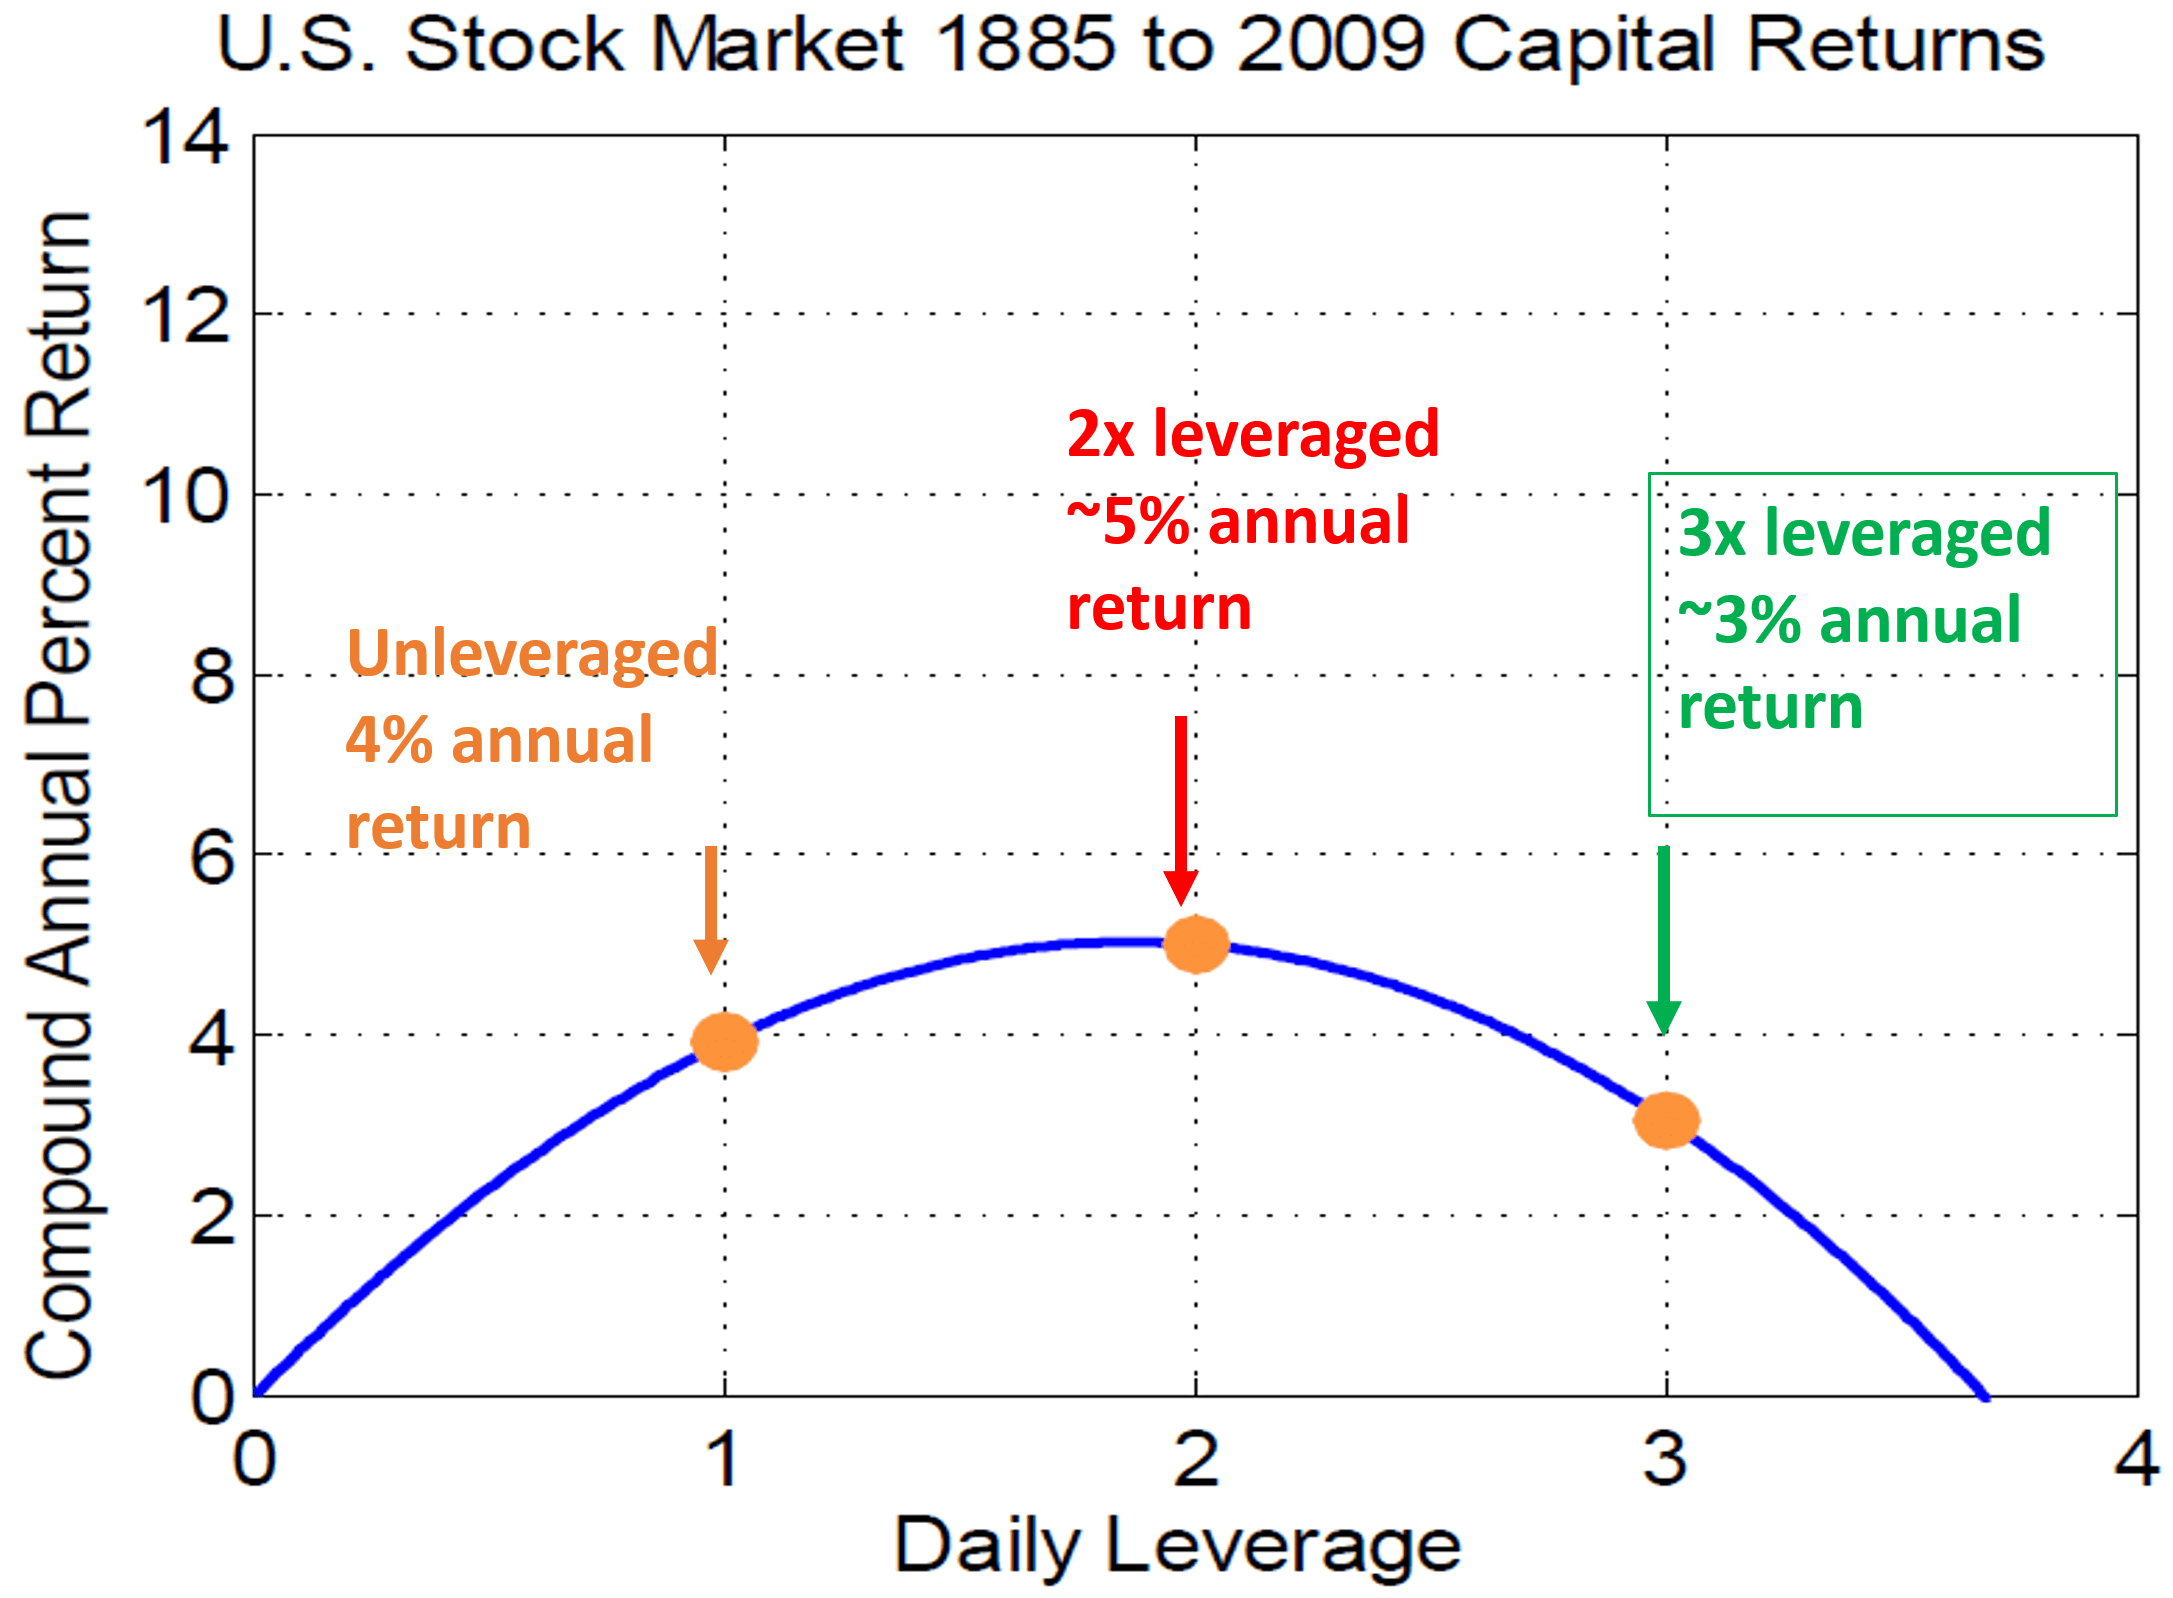
We use the VIX index to measure the volatility of the market and adjust our leverage. We leverage less when VIX increases and more when the VIX decreases according to the blue curve. For the use of a 3x leverage fund such as UPRO (or TQQQ), we also cap my maximum leverage at 25% as shown by the green line. More specifically, the blueline follows a 1.5th power-law relationship in the form of Leverage ~ 16/VIX^1.5. So that when VIX = 16, the leverage is 25%, i.e., the maximum is reached and 25% of our equity exposure will be leveraged. In case you are wondering where we got these magical numbers, the rationale is twofold:
- VIX=16 is about the historical average of the market volatility index and we are comfortable cranking up to our maximum leverage level in the AGP when VIX is near or below the historical average.
- The 1.5th power law gives us the level of sensitivity that we are comfortable with.
The central idea is to adjust leverage by A/VIX^B. We tailor (and you should too) A and B considering the different leverages provided by each fund (e.g., SSO is 2x and UPRO is 3x) and also the sensitivity you desire.
Source: author.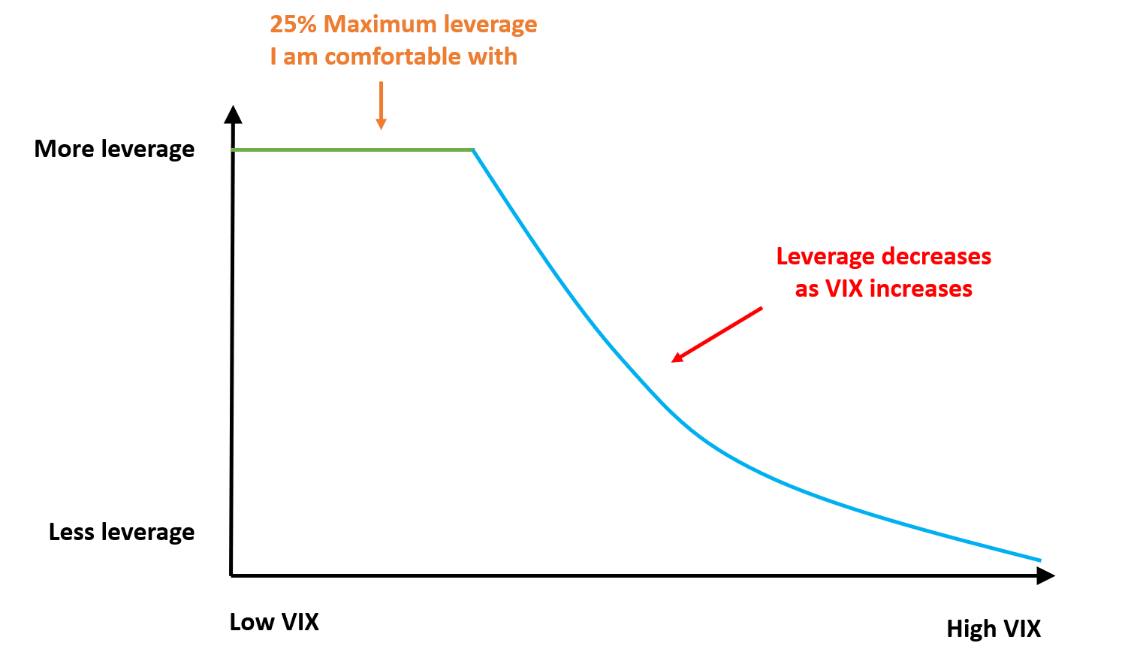
How did our leverage portfolio perform in the long term?
Before publishing it in our marketplace services, we have been holding these funds and applying the above approach to our own and others’ accounts (family members and close friends). The following chart shows the backtest result of our aggressive growth portfolio from 2006 to 2020. We have been actually implementing the strategy ourselves since ~2012 and our actual return is even better because of the success we’ve had with our tactical holdings.
The above idea has been systematically backtested over different periods of times (bull market, range-bound market, bear market), with different levels of adjustment to the stock allocation, and different levels of leverage. All results show that it can outperform the overall market AND also outperform the unleveraged AWP systematically when implement over a minimum of a few years. The backtest used SPY and SSO to represent the unleveraged and leveraged stock fund. The reason for using them is that they have the longest history so I could perform backtesting over a longer period of time, and under more different scenarios. Again, in practice, you can hold other leveraged funds such as UPRO or TQQQ using the same idea to achieve similar performance.
A few comments about the performance in the longer term:
- From the first chart, you can see that the leveraged funds (SSO in this case), when used in a disciplined and systematic way, have boosted growth consistently in the long term.
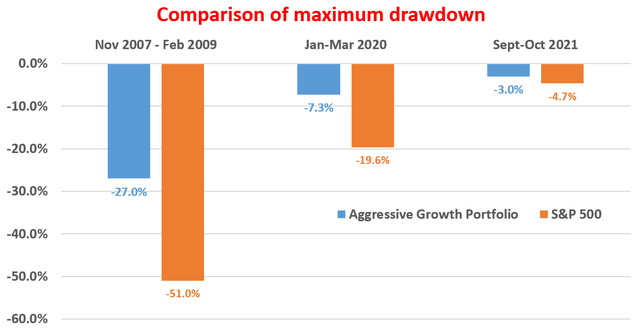
- And they’ve also actually reduced the risks as shown in the second chart. The second chart compares the risks in terms of maximum drawdowns in three market events – the 2008 financial crisis, the 2020 COVID crash, and the more recent market jitter during September 2021. As seen, the leveraged AGP actually provided significantly lower risks, not only measured by drawdowns, but also by other metrics such as standard deviation, worst year loss, Sharpe Ratio, Sortino Ratio, et al. During the 2020 COVID crash, it “only” suffered a maximum drawdown of -7.3% (thanks to the hard landing of treasury bond yields and above all the disciplined approach), compared to about -20% form the S&P 500.
- To examine the above results more closely, chart 3 below shows the comparison as a stress test of the method during the 2007-2009 years (just in case we experience something like that again in the future). As seen, the leveraged portfolio (labeled as Leverage AWP) outperformed both the unleveraged AWP and also S&P 500 most of the time during this extremely turbulent time in terms of return. Again, upon a closer look, the leveraged AWP also provided lower risks, as measured by most of the risk metrics such as standard deviation and worst year loss. The only exception during this period was the maximum drawdown, which was slightly worse than the AWP but still BETTER than S&P 500.
Source: Author, with simulator from Portfolio Visualizer, Silicon Cloud Technologies LLC Source: Author, with simulator from Portfolio Visualizer, Silicon Cloud Technologies LLC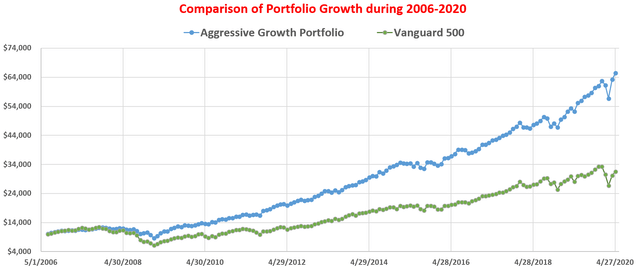
Final thoughts and risks
Both UPRO and SSO offer convenient vehicles for investors to seek aggressive growth. In particular,
- They both leveraged exposure for investors with convenience and relatively low cost (compared to other means of obtaining leverage in brokerage accounts). They are also “safer” in the sense that you cannot lose more than what you put in.
- Although investors do have to be aware that their fee is significantly higher than popular unleveraged funds (by more than 10x than SPY for example), their substantially lower dividends, and their price volatilities.
- The essence of our disciplined idea is to adjust leverage by A/VIX^B. You can tailor A and B considering the different leverages provided by each fund (e.g., SSO is 2x and UPRO is 3x) and also the exposure and sensitivity you desire.
- Why do we favor TQQQ ourselves? A few reasons. First, we favor 3x leveraged funds than 2x in general. We can hold a lower percentage of 3x leverage fund to gain the same amount of leverage, which helps to reduce the fee drag, and dividend drag, and also reduce our absolute dollar amount exposed to leveraging. Second, for growth, we are more optimistic about the tech-centric NASDAQ than the overall economy. And third, TQQQ is the largest leverage fund that I can find. It features a very tight spread for regular trading and rebalancing.
Finally, we’d like to point out the risks before closing this article:
- As a leveraged fund, both UPRO and SSO have potential risks of a total loss (e.g., a 33.3% daily crash would lead to a total loss of UPRO since it is 3x leveraged).
- Besides the fee drag and dividend drag as aforementioned, leveraged ETFs also suffer a larger volatility drag as mentioned in our earlier article. When the overall market is range-bound or suffers a one-way decline, the leveraged asset would not only underperform the unleveraged asset but underperform it more than the nominal leverage implies.
- Although, if the opposite happens, i.e., when the overall market enjoys a one-way rally, leveraged ETFs would return more – not only more than the unleveraged underlying but also more than their nominal leverage implies (i.e., a volatility boost). After all, math is fair.
- Lastly and most importantly, you should NOT pursue growth at all unless/until you have put aside enough funds to ensure your survival in the near term (that is why we maintain two separate portfolios ALL THE TIME ourselves).
Be the first to comment