

Natural Gas – Talking Points
- Natural gas prices extending higher as central US braces for cold snap
- Prices are at the highest level since early March as weekly gain nears 2.5%
- Technical outlook for natural gas improved but bullish narrative uncertain
Discover what kind of forex trader you are
An unusual late-season cold snap expected to move through the central United States is driving natural gas prices higher. The heating gas is on track to make a second consecutive weekly gain, with prices nearly 2.5% higher on the increased demand expectations from the incoming cold weather. The National Weather Service (NWS) is predicting a winter storm that will see heavy snow accumulations from Colorado to Ohio.
National Weather Service Forecasted Snowfall and Temperatures
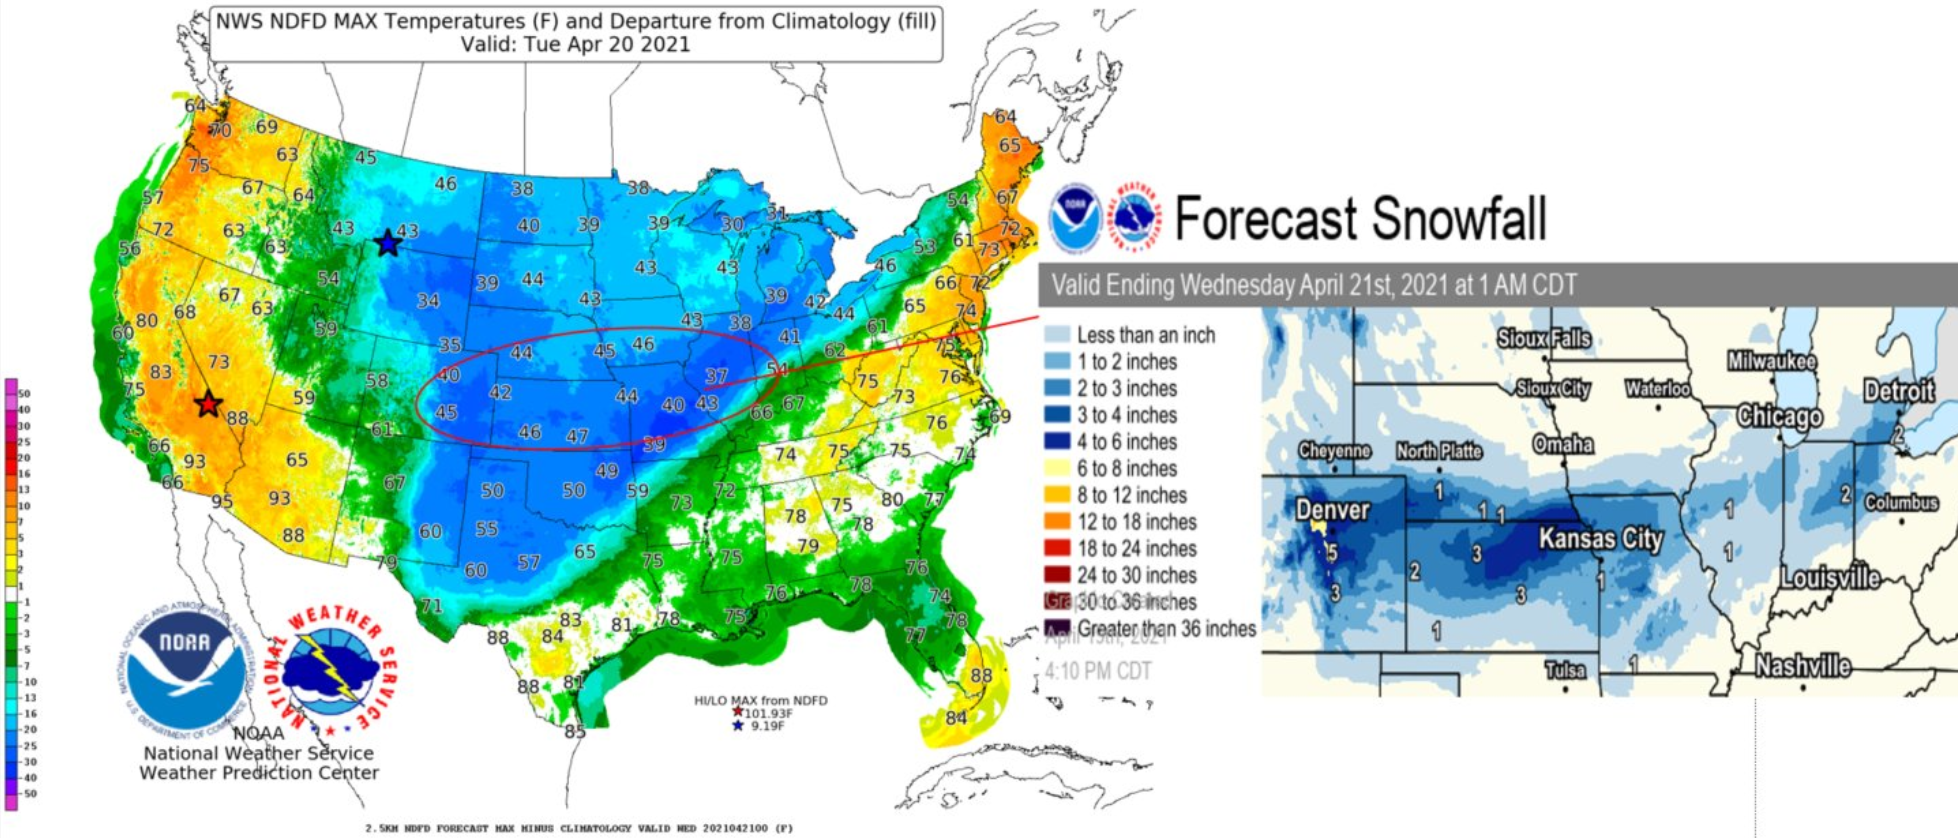
Source: National Weather Service (NWS)
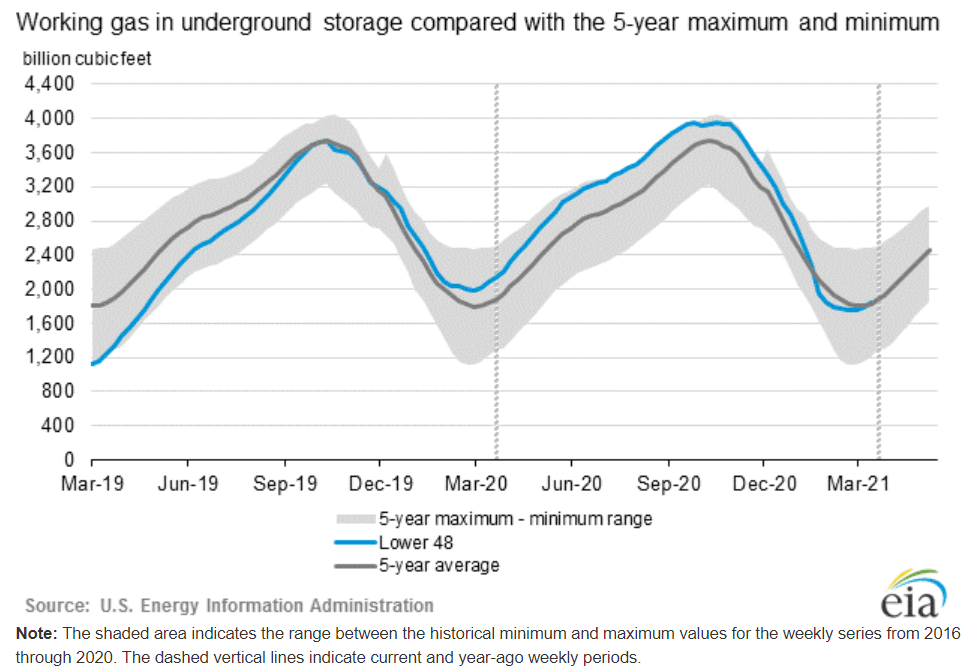
Natural gas demand typically decreases in Spring due to warming temperatures in April and May. This weather system disrupts that seasonal pattern which will likely be reflected in the Energy Information Administration’s (EIA) Weekly Natural Gas Storage Report next week. This week’s EIA release will show data for the week ending April 16.
Inventory levels, according to the EIA, dropped below the 5-year average earlier this year but have begun to track higher again, which is a typical seasonal factor. With storage levels trending at the historical average, price is more dependent on demand-side variables. Given the run higher in prices thus far, a continued move higher may not develop as the price likely reflects the event-driven demand driver in price.
Natural Gas Technical Forecast
Natural gas’s technical posture has improved dramatically following the last two weeks of price gains, rising above the 50- and 100-day Simple Moving Averages (SMA). The MACD oscillator is on the up and recently crossed above its signal line, a bullish sign. Breaking above the September trendline would reestablish a broader bull narrative. The 78.6% Fibonacci level may offer resistance to the upside. Alternatively, trendline support (green line on chart) may underpin prices on a downswing.
Natural Gas Daily Chart
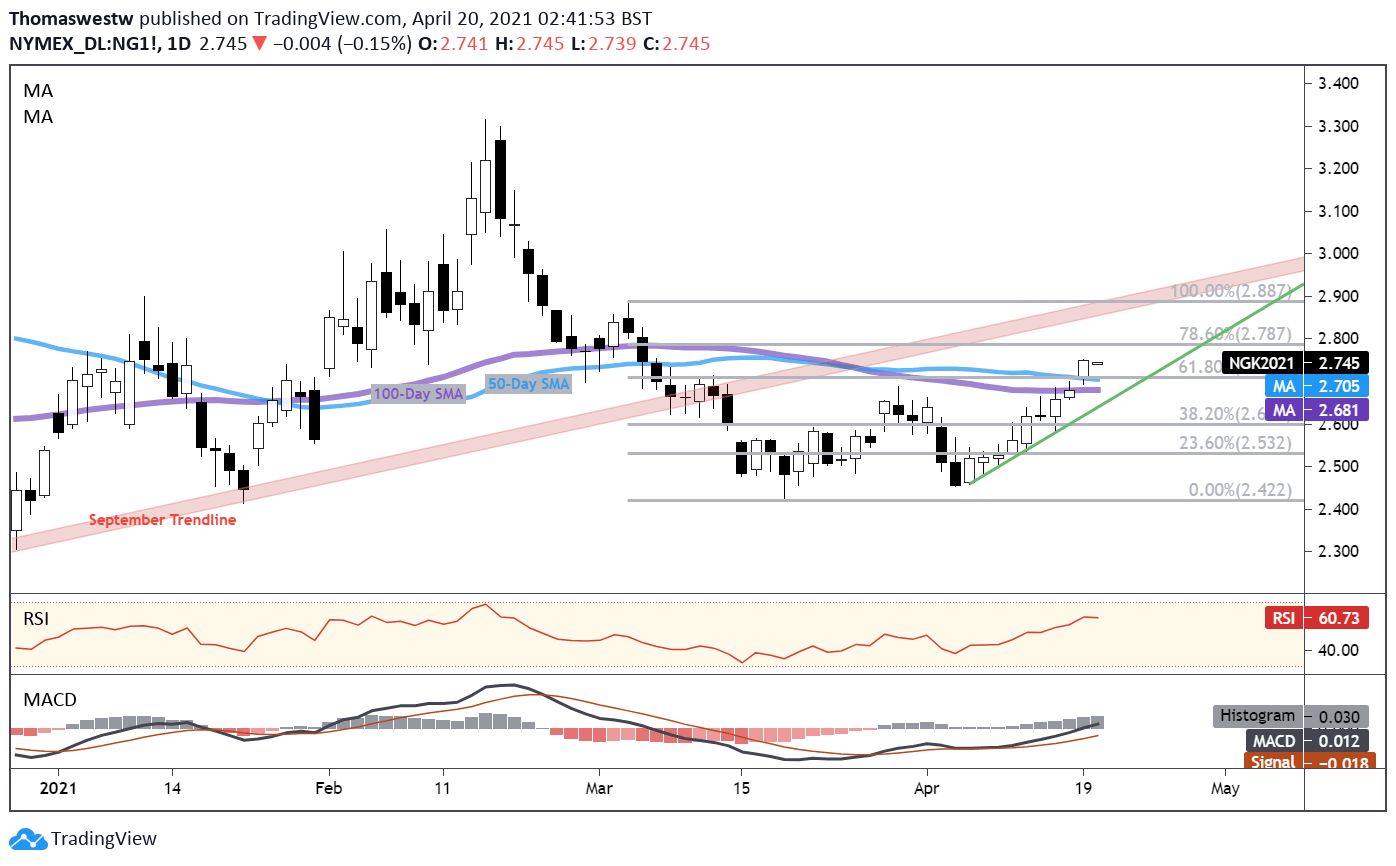
Chart created with TradingView
Natural Gas TRADING RESOURCES
— Written by Thomas Westwater, Analyst for DailyFX.com
To contact Thomas, use the comments section below or @FxWestwateron Twitter
Be the first to comment