
franckreporter
2022 has been a wild year, but it’s still not over yet. The FOMC meeting is coming in one week, and we will probably see a slowdown in the Fed’s rate hike trajectory. There is about a 77% probability that the Fed will raise the benchmark rate by 50 Bps, vs. the previous five 75 Bps moves. This dynamic is the positive near-term catalyst the market needs for a Santa Claus rally to materialize into year-end.
However, while the Fed may appear more dovish, higher rates should continue impacting Main St. and Wall St. The consumer will be affected by higher borrowing costs and higher prices. Moreover, corporate revenues, margins, and profits could worsen in the coming months. Also, the technical image is still negative, implying that there is more downside to come.
No matter how badly we want to see a bottom, another move lower may be ahead. The S&P 500/SPX (SP500) dropped by 27% from peak to trough, but this bear market may ultimately bottom around 3,000 in Q1 2023, representing approximately a 38% peak-to-trough decline.
S&P 500 Futures 1-Year Chart
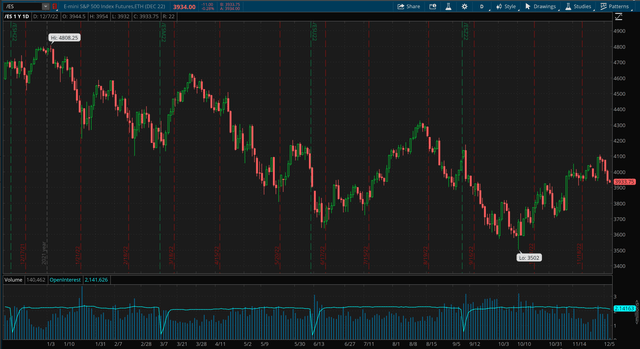
SPX futures (thinkorswim.com)
Prepare For More Volatility
While there’s the possibility for more near-term upside into year-end, there are no guarantees. Moreover, the market’s near-term top will likely materialize in the 4,000-4,300 range, and we’ve seen 4,100 already. The near and intermediate-term risk remains lower for now. Therefore, this is an excellent spot to pause, reassess the investment landscape, take some short-term profits, and hedge positions likely to decrease in value in the months ahead.
The VIX 1-Year Chart
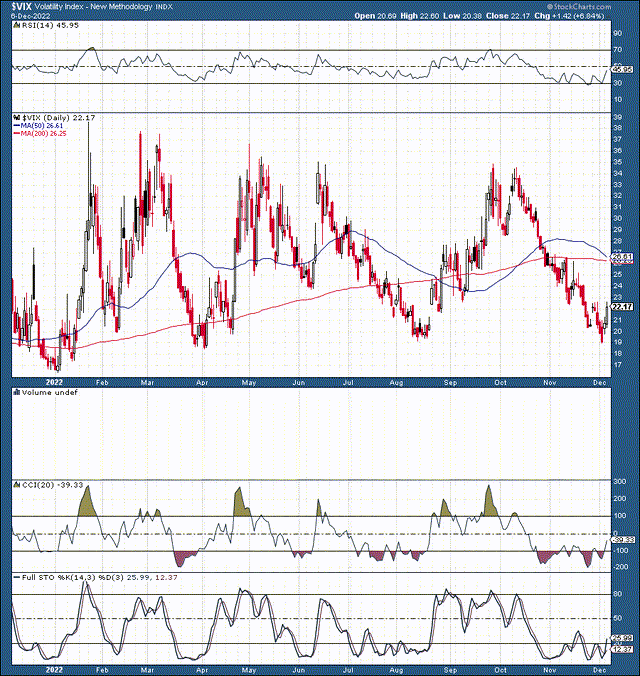
VIX (StockCharts.com )
The VIX is very telling and has been range bound from about 18-40 in this bear market. Every time the VIX hit a low of 18-20, the bear market rallies fizzled out this year. As the SPX recently hit a high of 4,100, the VIX hit a low of around 19, possibly marking another low point in the VIX and a high point in the market. As the Fed meeting and critical economic data approach, we should see more movement in the VIX and a near-term spike to about the 25-30 level. Moreover, we haven’t seen that fear-filled, panic-selling blowoff top in the VIX. Instead, most selloffs have mainly been orderly, with the VIX peaking around 35-40. Therefore, we likely have not seen the ultimate bottom in this bear market. The base should be accompanied by fear, panic selling, capitulation, and a higher VIX, possibly in the 50-75 range.
The FOMC Decision is Imminent
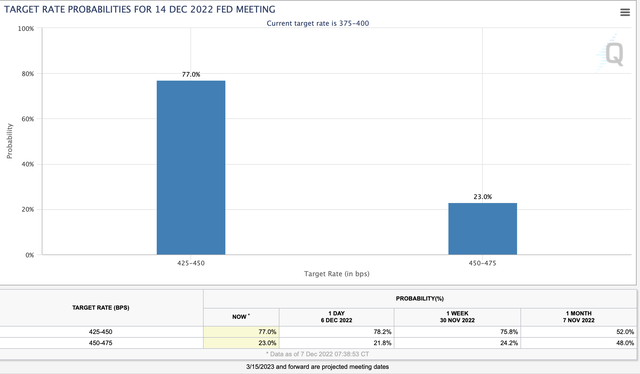
FOMC probabilities (CMEGroup.com )
There’s about a 77% probability that we will see a 50 Bps increase in the benchmark rate in about a week. However, at approximately 4.5%, the funds rate is relatively high, especially by current standards. Higher interest rates should continue permitting the economy, leading to lower consumer spending due to higher borrowing costs and high inflation. Additionally, corporate America is not immune. Major corporations may continue struggling with revenue growth, margins, and overall profitability due to a struggling consumer, higher borrowing costs, and higher costs. Moreover, a plethora of critical economic data may influence markets into and around the FOMC event.
Economic Data – More Inflation Numbers Ahead
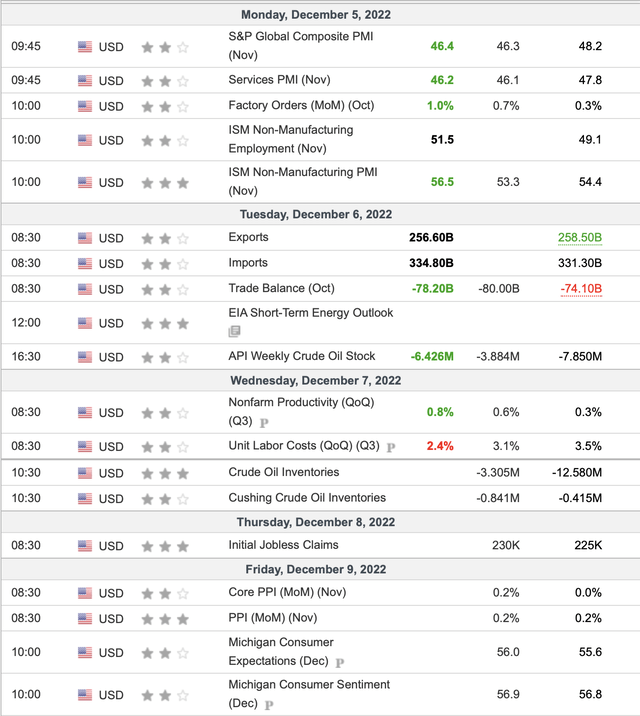
Economic Data (Investing.com )
This week is relatively busy data-wise, and we will see critical PPI inflation and Michigan consumer readings on Friday. Indeed, we want to avoid higher-than-anticipated producer inflation, and we want the consumer to remain confident enough. While these readings should be all right, I’m worried about the later months’ especially early 2023 readings. As higher rates persist, the phenomenon will weigh heavily on consumer confidence, sentiment, and retail sales data in future quarters.
Next Week’s Data
Economic data (Investing.com )
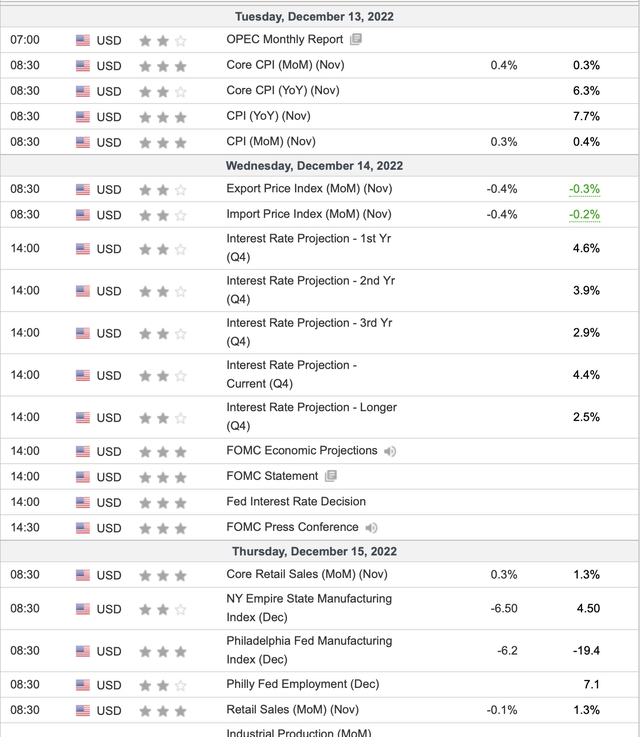
Next week is the crucial week concerning data. On Tuesday, we will get the all-important CPI inflation report. Exceptions are for another 7.7% YoY increase in the CPI. A goldilocks number is around 7.5%, which should spark a fire beneath the market if it materializes. However, a reading of 7.8-8% or higher could be very detrimental to this rally and result in a 75 Bps benchmark rate increase on Wednesday. Now markets are expecting a 50 Bps move. Can you imagine how big the selloff could be if the moves by 75 Bps again? It’s difficult to imagine, but the selloff could be massive and messy. Therefore, we want a CPI reading of about 7.5% next Tuesday and nothing above 7.8%.
In The End, It’s All About Valuation – The Shiller P/E
Shiller P/E ratio (multpl.com)
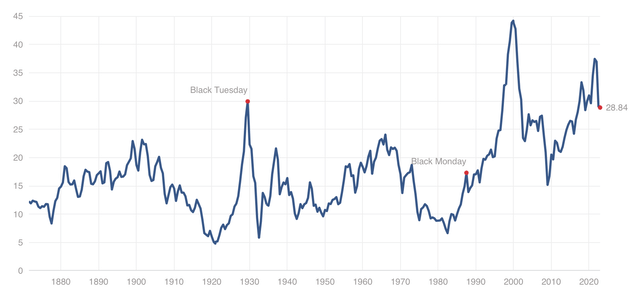
The Shiller P/E ratio, also known as the CAPE, reached a high of around 38 in the recent bull market. We’ve seen a decline to about 29, but more than this may be needed to shake out the weak hands and get valuations back in order. Historically, the Shiller P/E ratio’s mean has trended around 17. Now, 17 is far from 29, roughly 40% lower. However, it may not be necessary for the Shiller P/E ratio to return to the mean. The Shiller P/E ratio may trend slightly and bottom around 22. However, the 22 level is still about 25% below current levels. If we applied a similar percentage to the S&P 500, we would reach a level on par with our 3,000 bottom target range, likely around early to mid Q1 2023.


Be the first to comment