

da-kuk/E+ via Getty Images
This article was first released to Systematic Income subscribers and free trials on Feb. 27
Welcome to another installment of our Preferreds Market Weekly Review where we discuss preferreds and baby bond market activity from both the bottom-up, highlighting individual news and events, as well as top-down, providing an overview of the broader market. We also try to add some historical context as well as relevant themes that look to be driving markets or that investors ought to be mindful of. This update covers the period through the fourth week of February.
Be sure to check out our other weekly updates covering the BDC as well as the CEF markets for perspectives across the broader income space.
Market Action
Preferreds sectors were marginally down this week – holding in relatively well in a period of high volatility. Year-to-date, all sectors are down with the Energy sector outperforming.
Systematic Income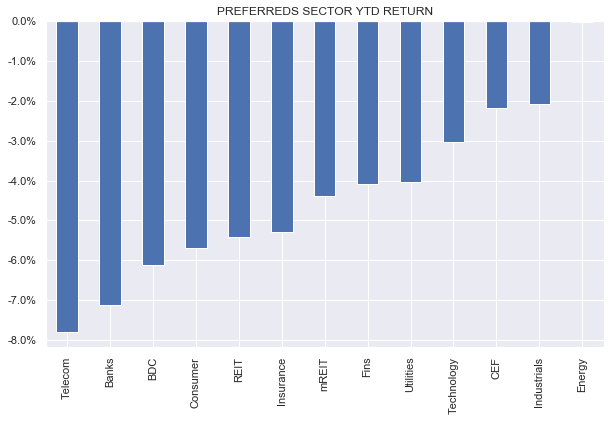
Since July of last year, 6 of 8 months have delivered negative returns, with February shaping up to be the worst month for the sector since March of 2020.
Systematic Income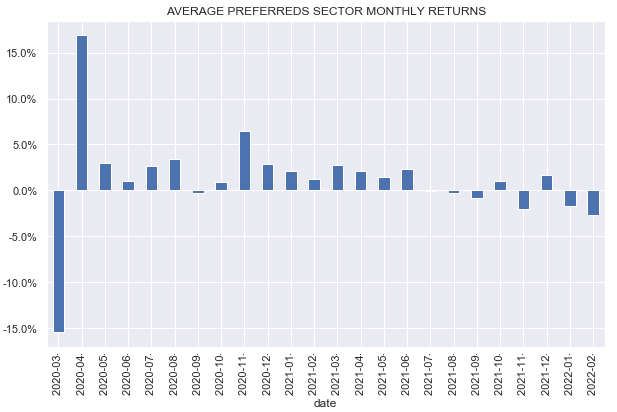
Market Themes
As many income investors know, the preferreds market is split into the retail and institutional parts with institutional preferreds making up the bulk of the market.
Institutional preferreds tend to hold in better than their retail counterparts during drawdowns. The following chart compares recent performance of three popular preferreds ETFs with predominantly retail holdings to an ETF with institutional preferreds holdings.
Systematic Income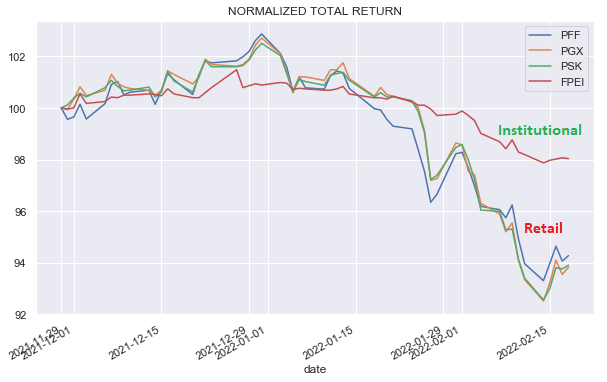
This chart, which covers the entire market, shows much the same thing.
UBS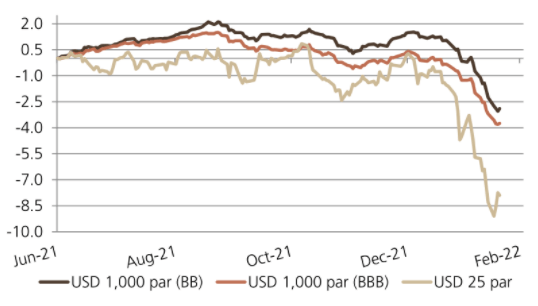
It’s also interesting to compare the performance of both sub-sectors to longer-term Treasuries. Here, the retail market has underperformed Treasuries while the institutional market has outperformed.
We can get a sense of this by looking at a recently-launched Public Storage 4% Series R (PSA.PR). The spread-to-worst is shown below – this is the measure of the stock’s yield versus maturity-matched Treasuries. The stock has been trading below “par” since issuance, i.e., as a perpetual stock, so we use 30Y Treasuries (sadly, US perpetual government bonds, i.e., consols were redeemed a long time ago) as the base yield. What the chart shows is that PSA.PR has underperformed 30Y Treasuries by around 0.35% in yield terms since issuance and more year-to-date.
Systematic Income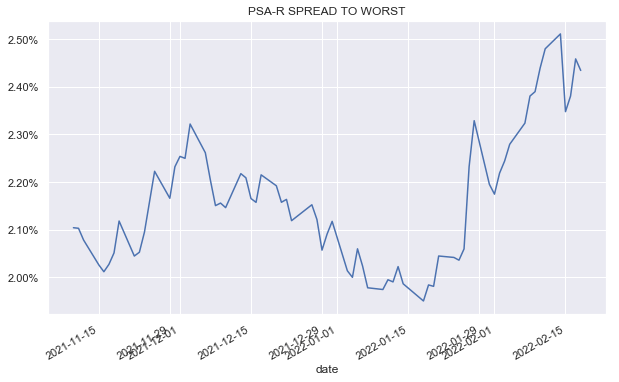
What is causing this divergent performance between retail and institutional preferreds?
In our view, the performance differential is due to a number of factors. Retail investors are more likely to be momentum-driven/low-conviction investors, i.e., they are more likely to sell low/buy high, whereas institutional investors will tend to be more-or-less fully invested through the cycle with trading driven more by rotations within the sector. This means that the institutional market would see fewer outflows in aggregate during periods of weakness.
Secondly, the institutional sub-sector is mostly fix/float while the retail market is mostly fixed rate. For example, FPEI is composed of 86% fix/float stocks while, by our count, the retail market is 80% fixed rate. As we discussed the other week, fix/float stocks have outperformed during the recent drawdown as one would expect given the rise in short-term rates.
Thirdly, the institutional market is mostly held by actively-managed funds while the retail market is mostly held by passive funds or individual investors. Passive funds, given their mandate, do not actively manage their duration exposure while actively-managed funds can do so, particularly, if they hold longer-duration securities. For instance, most preferred CEFs use interest rate swaps to partially hedge their duration profile. This allows them to outperform funds without hedges, all else equal.
What can investors do to potentially mitigate further weakness in their holdings due to rising longer-end interest rates?
One is to actively tilt to higher-coupon or fix-float series in the individual preferreds market. We continue to like hybrid-focused mREIT preferreds which tend to feature high coupons above 7% which mitigates their duration profile as well as series with high spreads over LIBOR. The overall mREIT preferreds sector has fallen about 4.4% year-to-date and our High Income Portfolio holdings in the sector has fallen about half that.
Secondly, investors can tilt to funds with institutional holdings such as the First Trust Institutional Preferred Securities and Income ETF (FPEI).
Thirdly, investor can tilt to actively-managed funds which, as discussed above, can actively manage their duration exposure. As the following table shows, passive open-end funds in the sector have underperformed actively-managed funds year-to-date.
Systematic Income Funds Tool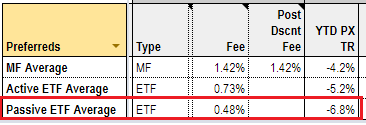
Market Commentary
mREIT Franklin BSP Realty Trust (FBRT) reported Q4 results. Recall FBRT, which holds CRE loans, merged with CMO which held agency ARMs. Since the merger, FBRT has been selling the agency ARM portfolio (with $2.4bn remaining). What’s interesting is the preferred angle. FBRT has only one public preferred – the 7.5% Series E (FBRT.PE) (ex CMO.PE). Its other preferreds will be converted into equity in 2022 (perhaps as soon as April). This will leave $259m of preferreds vs. $1.8bn of equity or coverage of around 7x with an agency allocation of 50% (this is likely move lower over time if they continue to sell ARMs however if that happens leverage will move lower as well). The company expects its recourse leverage to move to 2.5x (from 2.9x as of Q4) as the agency portfolio unwinds. The combination of coverage, leverage and 2020 book value resilience makes the stock worth a look. It is trading at a yield of 7.91% at a price of $24 and is currently callable which, if it happens, would provide a 5% tailwind (taking accrued into account) in case of redemption.
South Jersey Industries (SJI) is being acquired by the Infrastructure Investment Fund – a firm that owns $20bn of transport and utility businesses. This suggests that the company’s 5.625% 2079 Notes (SJIJ) will be delisted and possibly deregistered. Many investors in preferreds and baby bonds are familiar with a number of senior securities involved in recent private transactions such as (WTREP) relating to the Arch Capital Group acquisition or (OTCPK:GMLPF) related to the New Fortress acquisition. GMLPF are delisted but can trade OTC (in practice most retail investors can only sell the stock), while WTREP was deregistered as well making it impossible to trade, in effect, making it a private placement. Both can still be held by retail investors and the company is still obligated to honor all the contractual details of the security. SJI unsecured bonds have an investment-grade rating from S&P though SJIV are a bit below investment-grade due to their subordinated nature. SJI will also retain its management when taken private, so there are no obvious changes to its profile, so its 6.27% yield is attractive even if its 2079 maturity is very long. That said, securities going into a delisting can sell off hard as investors get out to avoid being locked into a position they may want to sell down the line, so investors should take this into account.
Stance & Takeaways
Recent volatility has allowed us to make a few rotations in our Income Portfolios. Specifically, we moved back into the CLO Equity CEF OXLC 6.75% 2031 bonds (OXLCL) from their 5% 2027 bonds (OXLCZ). OXLCL trades at a 5.51% yield-to-call (March-2024 first call date) and a 6.4% yield-to-maturity (March-2031). OXLCL has a -0.9% total return year-to-date (vs. negative double-digit returns for many perpetual preferreds and CEFs), which highlights the recent resilience of term senior securities, i.e., securities with a maturity, which allows them to hold up better during periods of rising interest rates.
We also find value in the credit CEF Aberdeen Income Strategies Fund 5.25% Series A (ACP.PA), trading at a 5% yield. The stock was rated A2 by Moody’s at inception – one of the highest ratings in the entire retail preferreds market. The fund (ACP) itself is not amazing and there is a credit facility in front of the preferred, but the impairment of the preferred is hard to imagine – even if all of the fund’s assets default with a 40% recovery, there will still be enough cash to pay off the facility and the preferreds. The stock has tended to trade well above “par” and has recently come down to a more attractive valuation. It remains one of the higher-quality options with a 5% yield in the space.
Be the first to comment