

gorodenkoff
Factors
Year-to-date, there has been a consistently positive spread between low volatility and value stock on the long side, and momentum and growth stocks on the short side.
Chart of Relative Factor Performance Year-to-Date (Price Action Lab Blog – Norgate Data)
So far, Value (VLUE) has even stayed in the black in the first two weeks of January of this year and, along with low volatility (USMV), has consistently outperformed momentum (MTUM) and growth (IWF).
In theory, long value and low volatility (short momentum and growth) are up about 19% year to date. In practice, investing in factors long or short is more complicated, but this is a general idea.
The direction of profits of the above trade could reverse in the short to medium term (one to a few months) with growth and momentum rebounding and value and low volatility not gaining much in relative terms.
Factor performance table (Price Action Lab Blog – Norgate Data)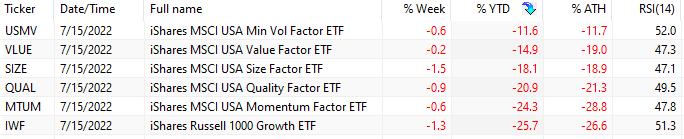
Growth and momentum are 26.6% and 28.8% below all-time highs, respectively, while value is already down 19% from the all-time highs of January of the year. There is plenty of room for the normalization of these performance spreads.
Sectors
Year-to-date, energy has outperformed all sectors by a wide margin.
Chart of Relative Factor Performance Year-to-Date (Price Action Lab Blog – Norgate Data)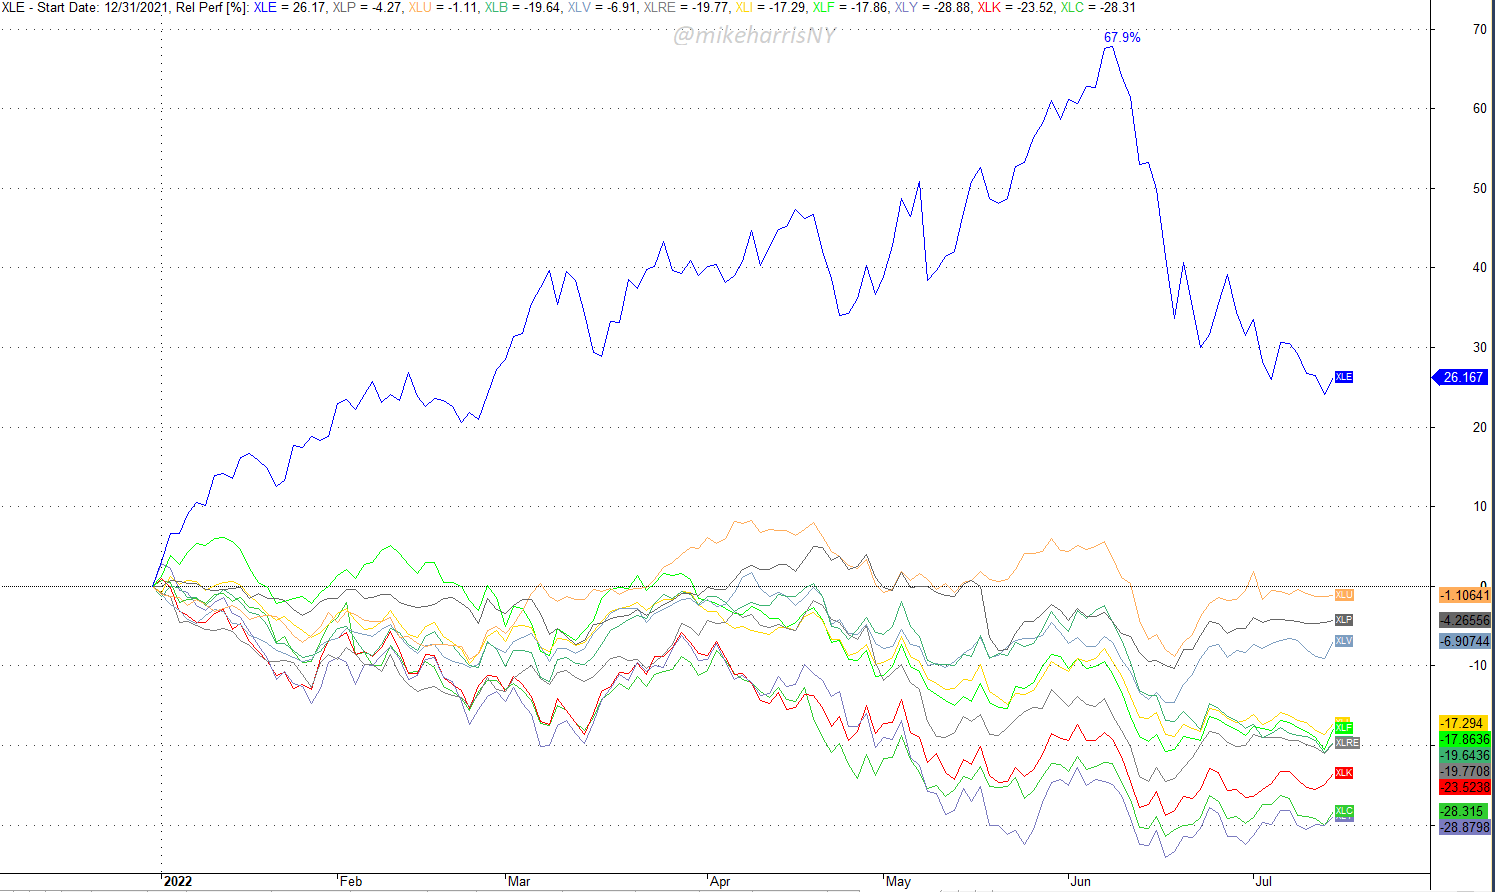
The wide sector performance divergence this year is clear from the above chart. Energy (XLE) was up nearly 68% early last month but has since dropped about 25%. All other sectors are in the red, with consumer discretionaries (XLY) and communication services (XLC) down more than 28% for the year. Utilities (XLU) are down the least by 1.1%.
Long energy, short growth, communications services, or tech (XLK) has been the profitable trade this year that shows signs of reversing.
Sector Performance table (Price Action Lab Blog – Norgate Data)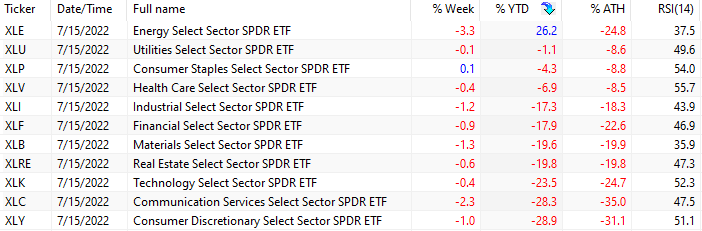
In early June, the trade in long energy-short consumer discretionaries was up more than 90% for the year! The current spread is at around 55%, with the process of normalization starting in the second week of last month. This process may continue forward and there is the possibility of a full reversal with the trade turning negative. No one knows the outcome in advance, but if the summer rally in stocks continues, we may see a new dynamic developing.
Conclusion
Going long low volatility and value while shorting growth and momentum has been a profitable trade in the factors space so far.
Long energy, short consumer discretionaries, communication services, or technology has delivered significant profits in the sector space.
In any case, a process of normalization may have started and the direction of the profits from the above trades may be reversed in the next few weeks, or in the best case, the profits may be reduced significantly.
Be the first to comment