

Melpomenem/iStock via Getty Images
Investment Thesis
I began covering the Invesco BuyBack Achievers ETF (NASDAQ:PKW) last November and wasn’t impressed with what I saw. First, its 0.64% is a non-starter and will significantly impact returns for investors using it as a core holding. Second, by only owning Nasdaq companies that repurchase a large percentage of shares, the ETF likely only works best in bull markets when most stocks are undervalued. This strategy is contrary to most dividend investors’ objectives and is reflected in PKW’s poor YTD performance.
Still, PKW’s Index reconstituted earlier this year, so I think it’s worth a second look. This article seeks to evaluate the changes in the context of today’s market environment and assess PKW’s fundamentals against a lesser-known but better-performing ETF, the iShares U.S. Dividend and Buyback ETF (DIVB). I still have many of the same concerns as in November, but I hope current shareholders will still benefit from this detailed analysis.
ETF Overview
Strategy and Fund Basics
PKW tracks the Nasdaq Buyback Achievers Index, currently holding approximately 150 U.S. securities that have reduced shares outstanding by at least 5% in the last twelve months. The Index is evaluated annually at the end of January and weights constituents based on market capitalization. As a result, it has the concentration and diversification of broad-based indices like the S&P 500, just with markedly different exposures.
Index eligibility criteria are listed below, and worth noting is that constituents are evaluated based on only one year’s worth of buybacks. On the other hand, DIVB selects based on the last eight quarters’ worth of buybacks, and its stock universe is larger beyond just those trading on the Nasdaq. I prefer the latter as buybacks don’t always occur routinely (that’s the best part). However, the shorter lookback makes it more responsive, which could benefit shareholders when assets are generally underpriced in bull markets.
Nasdaq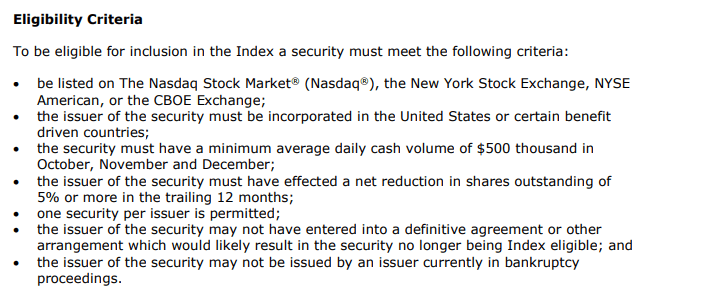
I’ve listed some additional descriptive statistics below. Note how PKW’s dividend yield is low, and its expense ratio is high, meaning capital appreciation is likely the ETF’s primary objective.
- Current Price: $81.59
- Market Value: $1.52 billion
- Shares Outstanding: 15.43 million
- Expense Ratio: 0.64%
- Launch Date: December 20, 2006
- Trailing Dividend Yield: 0.88%
- Five-Year Dividend CAGR: 1.09%
- Five-Year Beta: 1.07
- Number of Securities: 153
- Portfolio Turnover: 93% (70% Five-Year Average)
- 30-Day Median Bid-Ask Spread: 0.07%
- Tracked Index: NASDAQ Buyback Achievers Index
- Reconstitution Frequency: Annually In January
PKW’s 93% annual turnover rate also makes it an exciting one to review because there’s a good chance constituents today are nothing like they were in prior years. That means technical analysis and assessment of PKW’s past performance will be of limited use beyond evaluating how well the strategy worked in a primarily bullish market.
Sector Exposures and Top Ten Holdings
In addition to DIVB and the SPDR S&P 500 ETF (SPY), I wanted to include the Vanguard U.S. Value Factor ETF (VFVA) as a potential alternative given its low 0.13% expense ratio and that Morningstar also lists its equity style as mid-value. PKW’s weighted-average market capitalization is around $655billion, so while that’s still firmly in the large-cap category, it’s much lower than what SPY and DIVB offer.
Morningstar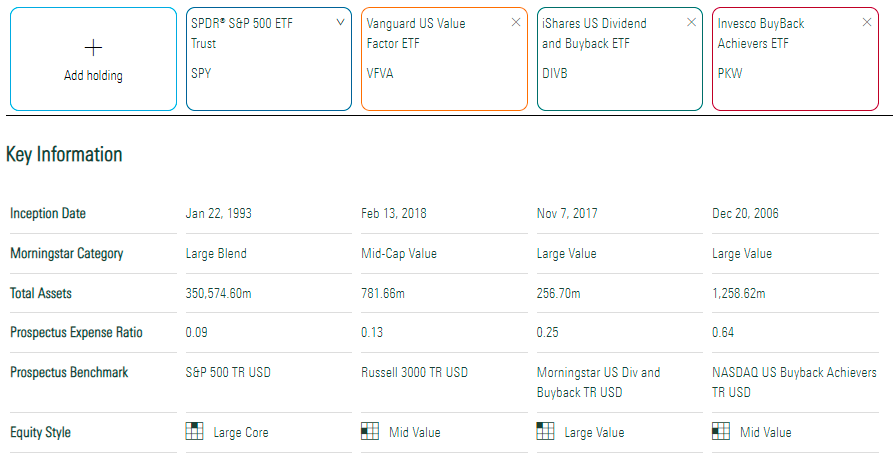
Of these three comparators, PKW has the most exposure to Financials (28.47%) and Consumer Discretionary (22.23%), with minimal exposure to Energy, Real Estate, and Utilities. It’s unsurprising how little exposure to oil stocks PKW has, given how politically unpopular that would be in the face of rising oil prices. However, considering how well the sector insulates portfolios from high inflation, it’s disappointing. I see this as a weakness for at least the next few quarters as the Fed’s policies work their way through the economy.
Morningstar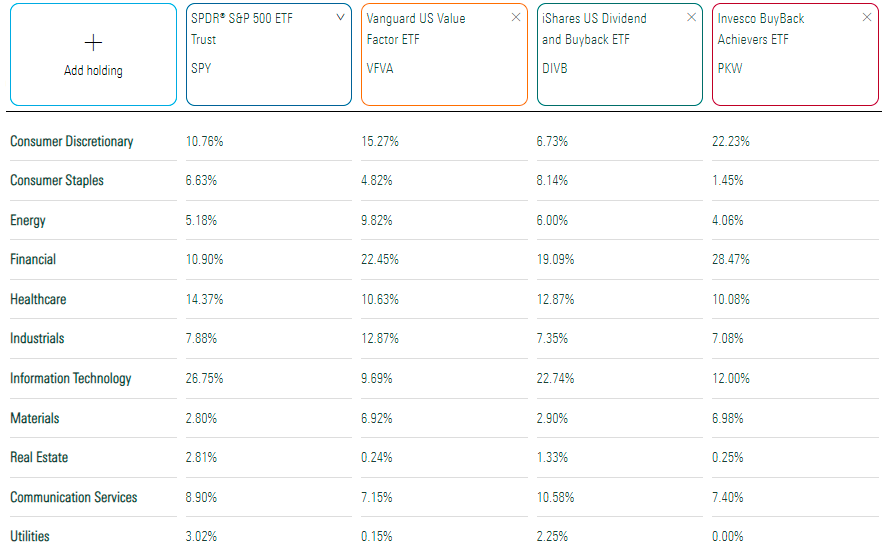
PKW’s top ten holdings are shown below, which total 39.19%. They include Lowe’s (LOW), Charter Communications (CHTR), and Cigna (CI). Lowe’s added about $13 billion in additional share repurchase authorizations in December and has repurchased over $4 billion in each of the last two quarters.
Invesco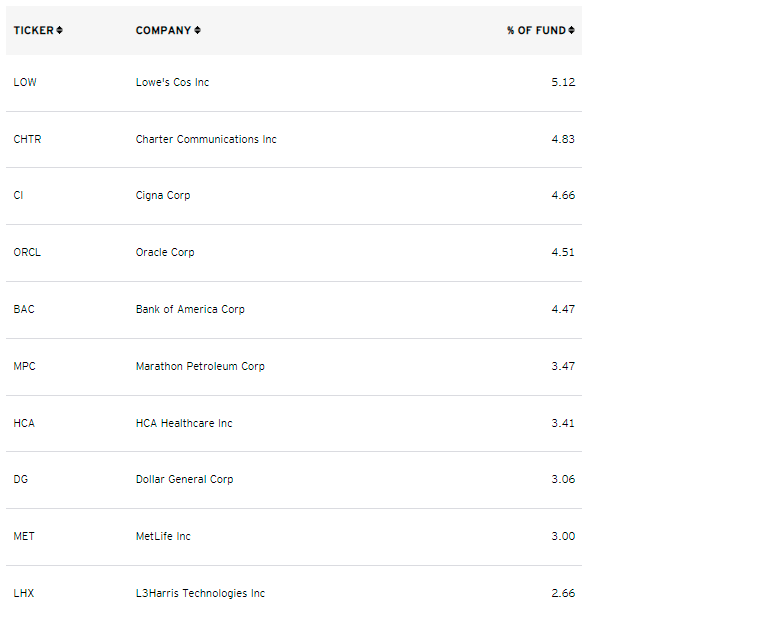
Performance History
PKW has slightly outperformed SPY since its launch in December 2006, gaining an annualized 9.09% despite having a substantially higher expense ratio. Standard deviation was somewhat higher (17.01% vs. 15.46%), and risk-adjusted returns (Sharpe and Sortino Ratio) appear worse, but not by much. I don’t consider these results negative by any stretch.
Portfolio Visualizer
However, on a rolling three-year basis, PKW hadn’t outperformed since December 2015, meaning only buyers before 2013 came out ahead. Unlike other value ETFs, PKW looks like it performs better after corrections and recessions. For example, since April 2020, PKW has outperformed SPY by an annualized 5.61%.
Portfolio Visualizer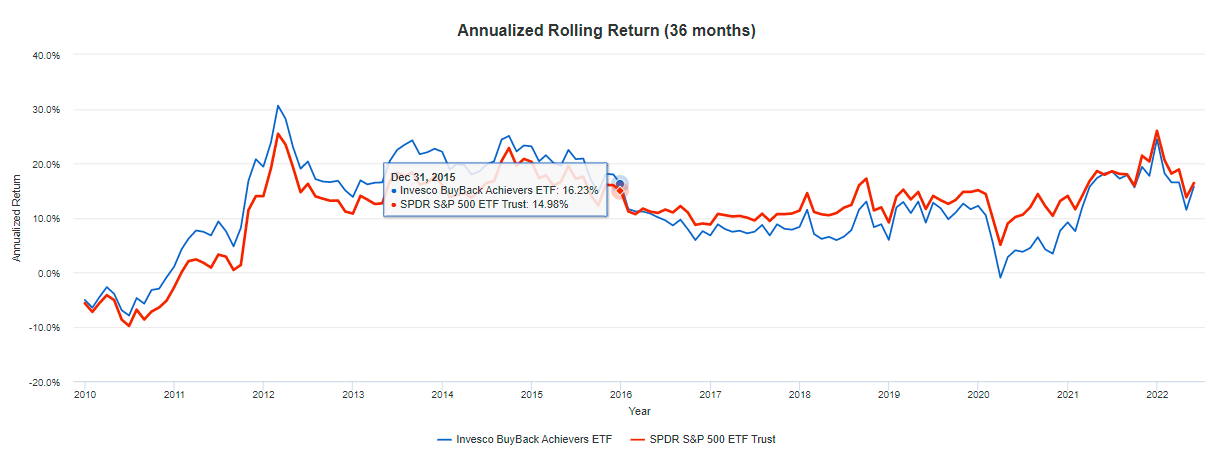
DIVB doesn’t have a long history, but it’s worth noting how it’s outperformed PKW by an annualized 1.64% since its November 2017 launch and experienced less volatility.
Portfolio Visualizer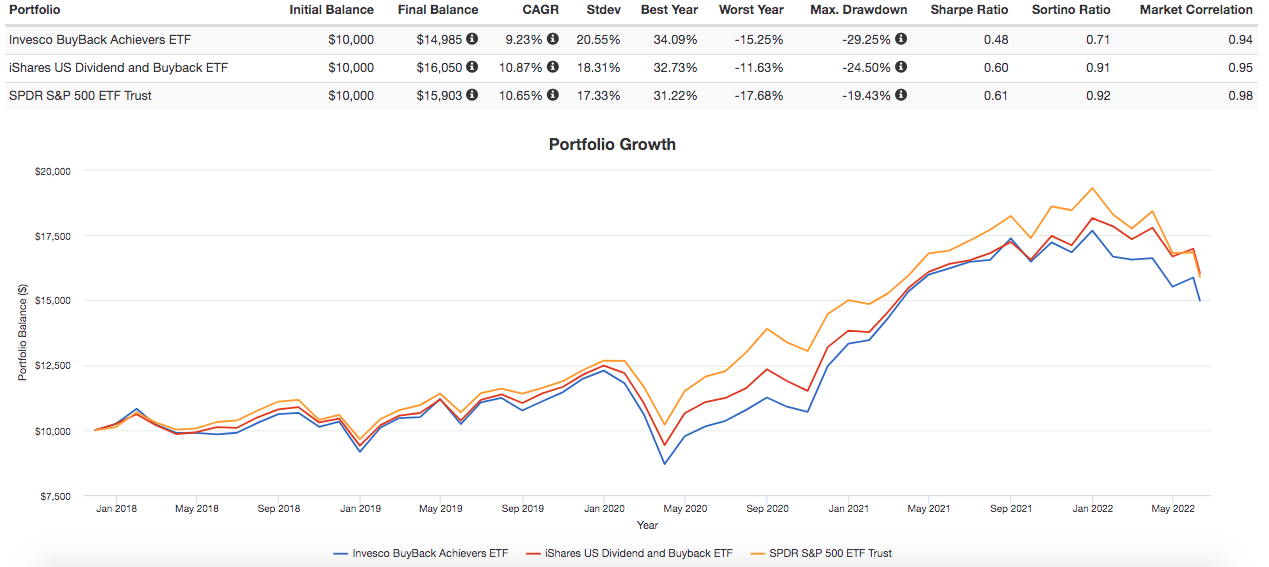
Fundamental Analysis
Reconstitution Results
The 93% turnover rate referenced earlier was for the year ending April 30, 2021, and while we don’t have official numbers yet, the latest reconstitution results suggest similar figures are likely. Over 100 holdings are new compared to when I reviewed PKW in November, with the ten largest essentially being the current top ten list as follows:
- Lowe’s (LOW): Home Improvement Retail
- Cigna (CI): Health Care Services
- Bank of America (BAC): Diversified Banks
- Marathon Petroleum (MPC): Oil & Gas Refining & Marketing
- HCA Healthcare (HCA): Health Care Facilities
- Dollar General (DG): General Merchandise Stores
- MetLife (MET): Life & Health Insurance
- L3Harris Technologies (LHX): Aerospace & Defense
- Capital One Financial (COF): Consumer Finance
- AutoZone (AZO): Automotive Retail
On the deletions side, exposure to Technology stocks was halved from 24% to 12%, with Fortinet and Intel making up about 10% of the difference. However, Consumer Discretionary exposure increased from 11% to 22%, and Materials increased from 2% to 7%. The result is that PKW remains an above-average-volatility ETF, with its five-year beta rising from 1.10 to 1.15. The top ten removals are below.
- Fortinet (FTNT): Systems Software
- Biogen (BIIB): Biotechnology
- Intel (INTC): Semiconductors
- McKesson (MCK): Health Care Distributors
- Molina Healthcare (MOH): Managed Health Care
- Carlisle (CSL): Building Products
- Service Corp. International (SCI): Specialized Consumer Services
- Citrix Systems (CTXS): Application Software
- Jefferies Financial Group (JEF): Investment Banking & Brokerage
- Toll Brothers (TOL): Homebuilding
Company and Industry Fundamentals
The table below looks at the fundamentals of PKW’s top 20 holdings, representing about 60% of the portfolio. In the bottom two rows, I’ve compared PKW with DIVB, which helps highlight the pros and cons of investing in either ETF.
The Sunday Investor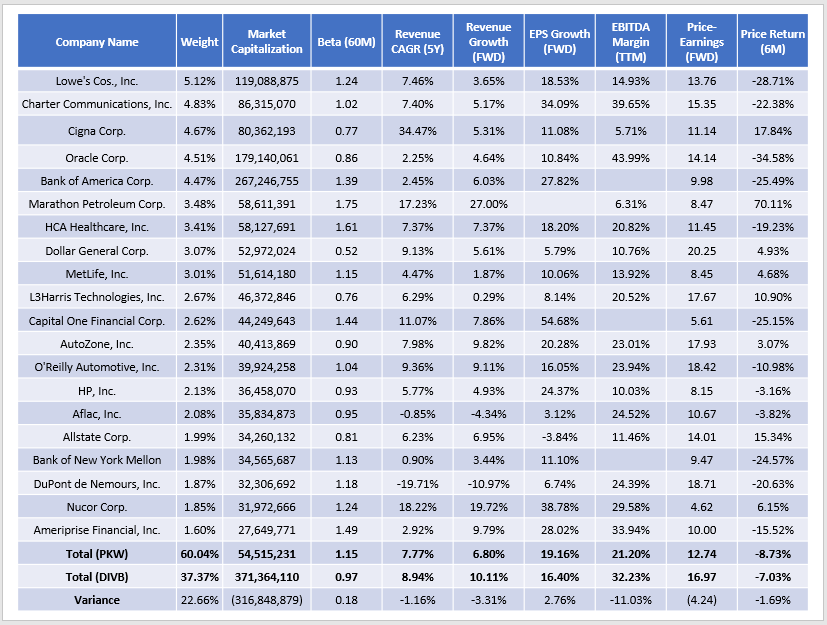
I want to highlight PKW’s 6.80% forward revenue growth rate, which is extremely low and concerning. To put this in perspective, I track 270 ETFs in the mid-, large-, and total-market cap blend and value categories, and this revenue growth is the second-lowest. This low growth is reflected in the 12.74 forward price-earnings ratio, which is the 26th lowest, but that’s the key takeaway here. PKW increases EPS not because its sales and EBITDA margins are superior but primarily because of buybacks. In my view, that’s not sustainable.
Furthermore, buying back shares in a down market destroys shareholder value. Even if these companies are well-run, very few will escape the macroeconomic reality that the economy is in jeopardy. We have a yield curve just inverted for the second time in three months and a Federal Reserve intent on controlling record-high inflation even at the expense of the stock market. I don’t think this is the right time to invest in a high-beta, low-growth fund.
Finally, I want to use Seeking Alpha’s Quant Grades and last quarter’s revenue surprises to provide some additional perspective. The table below highlights the weighted-average results for PKW’s top 20 industries, which total 78.13% of the ETF. The results suggest that while PKW has a slight edge on Value and Growth, DIVB’s constituents are more profitable (A vs. B+) and, therefore, of higher quality.
The Sunday Investor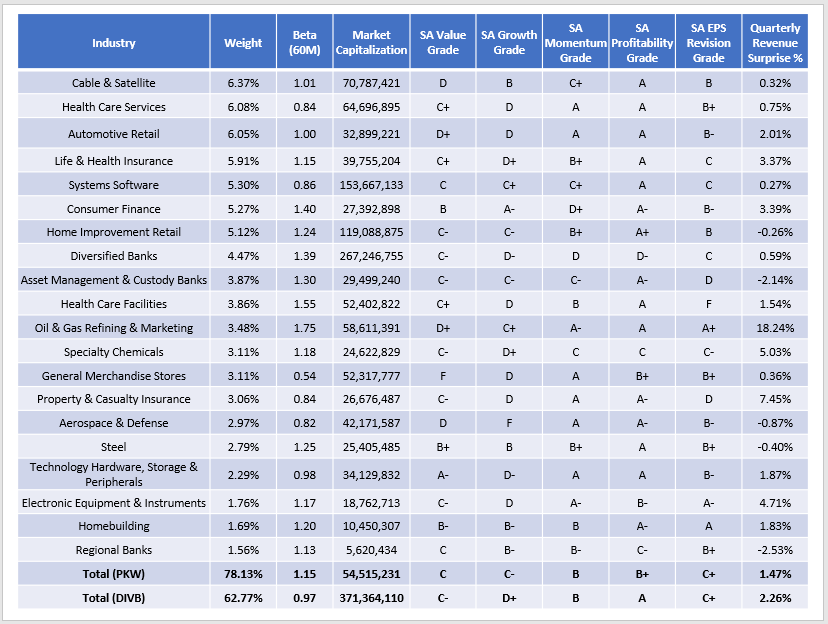
In addition to the increased diversification DIVB provides, its constituents also had a better last quarter, as measured by the quarterly revenue surprise figures (2.26% vs. 1.47%). Cable & Satellite stocks like Charter Communications beat on earnings but fell short on revenue for the second straight quarter. Since it’s still PKW’s second-largest holding, its 28.41% YTD decline had a substantial impact.
Seeking Alpha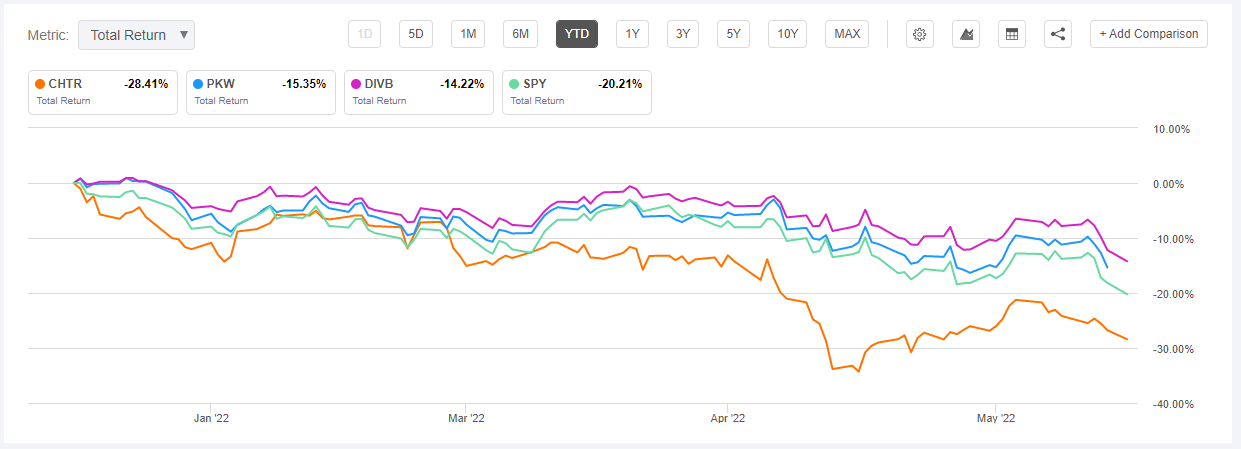
Investment Recommendation and Conclusion
PKW had an eventful reconstitution but still suffers from many of the same problems I identified in November. It has above-average volatility and minimal earnings growth potential beyond what its buybacks accomplish. PKW also charges a 0.64% annual fee, which is a non-starter as far as I’m concerned. According to this calculator, 9.22% of an investor’s total gains will be lost to fees in ten years, assuming a 10% annual return.
I don’t think the strategy has demonstrated it works well enough to justify these fees, and investors probably are better off with the more-diversified and cheaper DIVB. Therefore, I’m maintaining my neutral rating on PKW and recommend shareholders look for ways to sell it in a tax-efficient manner.
Be the first to comment