

imaginima
Introduction
Pioneer Natural Resources Company (NYSE:PXD) is one of the largest independent E&P companies in the United States. The company produces exclusively in the Permian Basin, and it has the most extensive acreage of any company in this basin.
It is a new oil company that I have added to my domestic E&P, which includes EOG Resources (EOG), Occidental Petroleum (OXY), Devon Energy (DVN), and two US supermajors Chevron Corp (CVX) and Exxon Mobil (XOM).
1 – Investment Thesis
Pioneer Natural Resources came out with adjusted quarterly earnings of $9.36 per share, beating analysts’ expectations, compared to earnings of $2.55 per share a year ago.
However, oil prices have been highly volatile recently and retraced significantly due to rampant inflation forcing the FED to hike interest rates. The risks of a painful recession are elevated, and many analysts believe we will fall into a recession by 2023. The World Bank echoed this concern on September 16, 2022.
It said a study found that “the world’s three largest economies – the US, China and the euro area – have been slowing sharply”.
“Under the circumstances, even a moderate hit to the global economy over the next year could tip it into recession,” it said.
This situation has affected oil prices and, to some degree, natural gas prices, even if the war in Ukraine has helped so far.
However, OPEC+ recently decided to cut production by 2 million barrels, which temporarily boosted oil prices that jumped over 10% last week. But, this politically motivated move will also increase the risk of recession and demand destruction.
The near future outlook for oil producers is turning bearish, and the coming third quarter will show a noticeable pullback sequentially, albeit limited. Still, it could accelerate in Q4 and later.
Thus, it is crucial to use any upticks to take short-term profit LIFO as I have advocated for many years in my marketplace, “the Gold and oil corner.”
2 – Stock Performance And Commentary
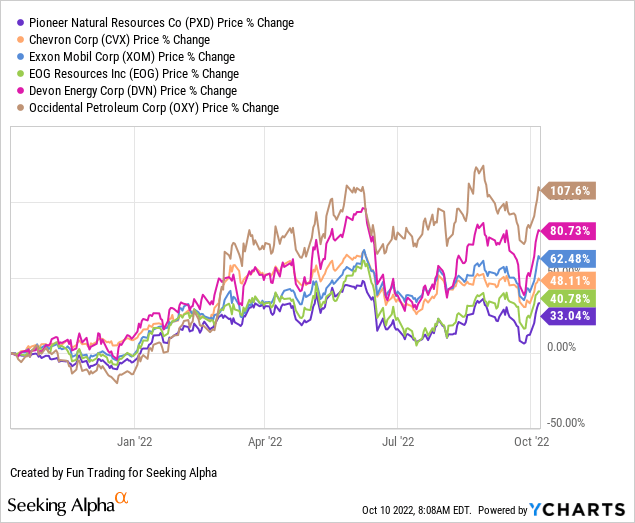
PXD is underperforming its peers quite significantly, especially Occidental Petroleum, up 108% on a one-year basis. However, PXD compensates for this lower performance with a very high dividend policy. PXD is now up 33% on a one-year basis.
Pioneer Resources – Financial Table 2Q22 – The Raw Numbers
| Pioneer Natural Resources | 2Q21 | 3Q21 | 4Q21 | 1Q22 | 2Q22 | 3Q22 |
| Revenues in $ Million | 4269 | 4961 | 5576 | 6147 | 7005 | – |
| Total Revenues + other in $ Million | 3419 | 4463 | 4317 | 6172 | 6920 | – |
| Net Income in $ Million | 380 | 1045 | 763 | 2009 | 2371 | – |
| EBITDA $ Million | 1188 | 2081 | 1693 | 3212 | 3681 | – |
| EPS diluted in $/share | 1.54 | 4.07 | 2.97 | 7.85 | 9.30 | – |
| Operating cash flow in $ Million | 1466 | 1992 | 2225 | 2584 | 3221 | – |
| CapEx in $ Million | 729 | 998 | 978 | 917 | 917 | – |
| Free Cash Flow in $ Million | 737 | 994 | 1246 | 1667 | 2304 | – |
| Cash and cash equivalent $ Million | 245 | 725 | 4040 | 3256 | 3252 | – |
| Total Debt in $ Million | 6926 | 6929 | 6932 | 5690 | 5693 | – |
| Dividend per share in $ | 0.56 | 2.07 | 3.64 | 3.78 | 7.38 | 8.57 |
| Shares outstanding (diluted) in Millions | 247 | 257 | 258 | 256 | 254 | |
| Oil Production | 2Q21 | 3Q21 | 4Q21 | 1Q22 | 2Q22 | 3Q22 |
| Oil Equivalent Production in K Boep/d continuing operations) | 629.468 | 675.793 | 687.143 | 637.756 | 642.844 | 635-660 |
| Global Natural gas price ($/MMBtu) | 2.69 | 4.05 | 5.20 | 4.81 | 6.72 | – |
| Price per $/Boe | 46.82 | 52.79 | 58.78 | 68.48 | 79.31 | – |
Source: Oil 10-Q filing
Analysis: Revenues, Earnings Details, Free Cash Flow, Debt, An Oil & Gas Production
1 – Total Revenue and Others was $7,005 million in 2Q22
PXD Quarterly Production History (Fun Trading)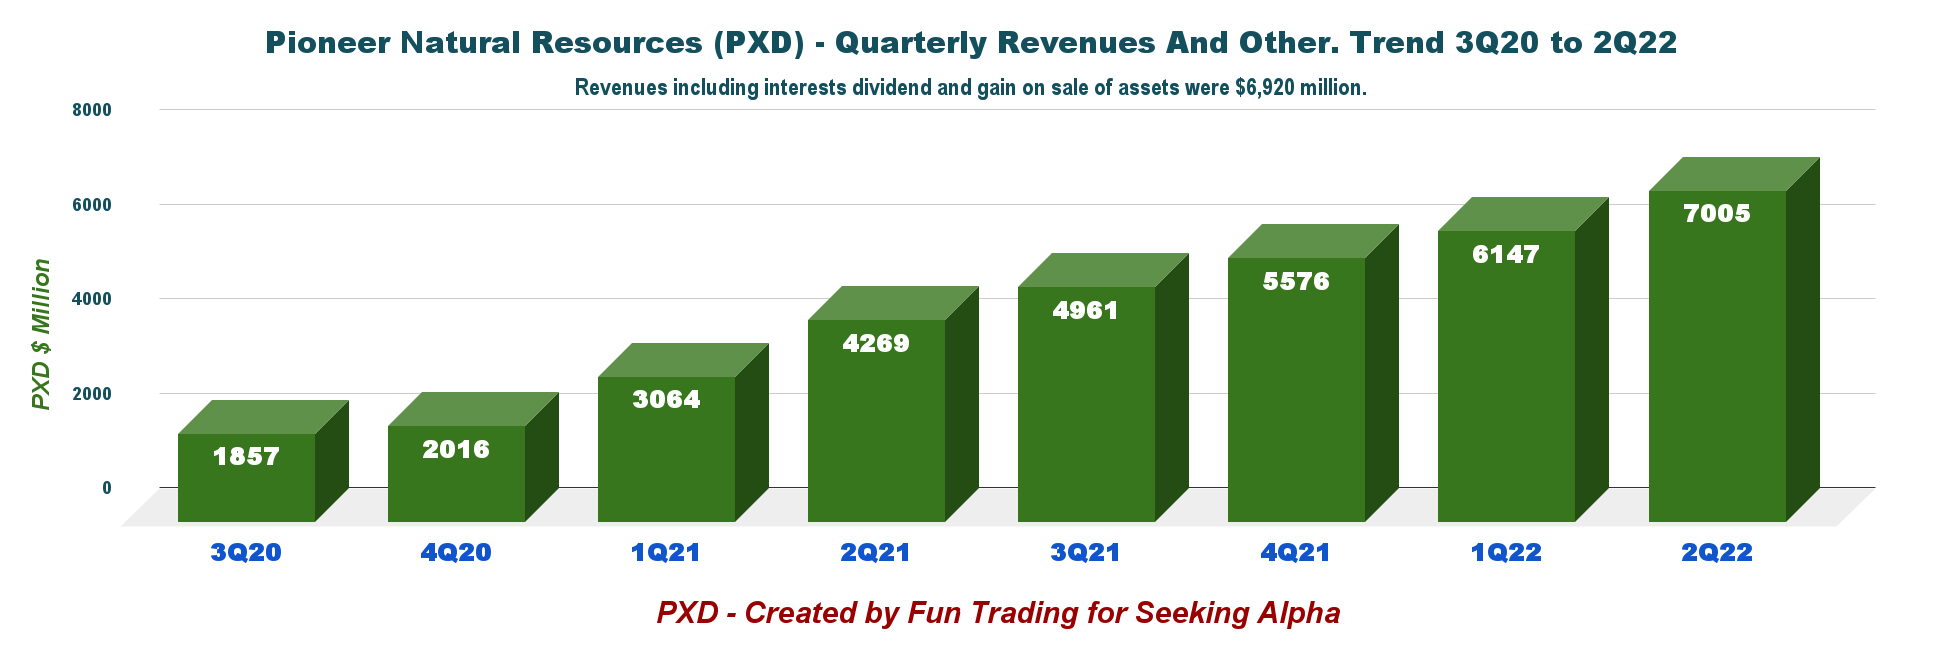
Note: Revenues from oil and gas and others were $6,920 million.
Pioneer Natural Resources reported a net income of $2,371 million, or $9.30 per diluted share, for the second quarter of 2022 compared to $380 million or $1.54 in 2Q21.
The net cash provided by continuing operations activities in 2Q22 was $3,221 million, compared with $1,466 million in 2Q21.
I estimate the revenues for the third quarter to be around 8% to 10% lower due mainly to the commodity prices retracement. Furthermore, PXD may experience inflationary pressures that will affect free cash flow, which I estimate at approximately $1.6 billion in 3Q22.
2 – Free Cash Flow was $2,304 million in 2Q22
PXD Quarterly Free cash flow history (Fun Trading) Note: The generic free cash flow is cash from operating activities minus CapEx. The company used another way to calculate the Free cash flow, which came to $2.7 billion. The generic free cash flow was $2,304 million in 2Q22. The trailing 12-month free cash flow is $6,211 million.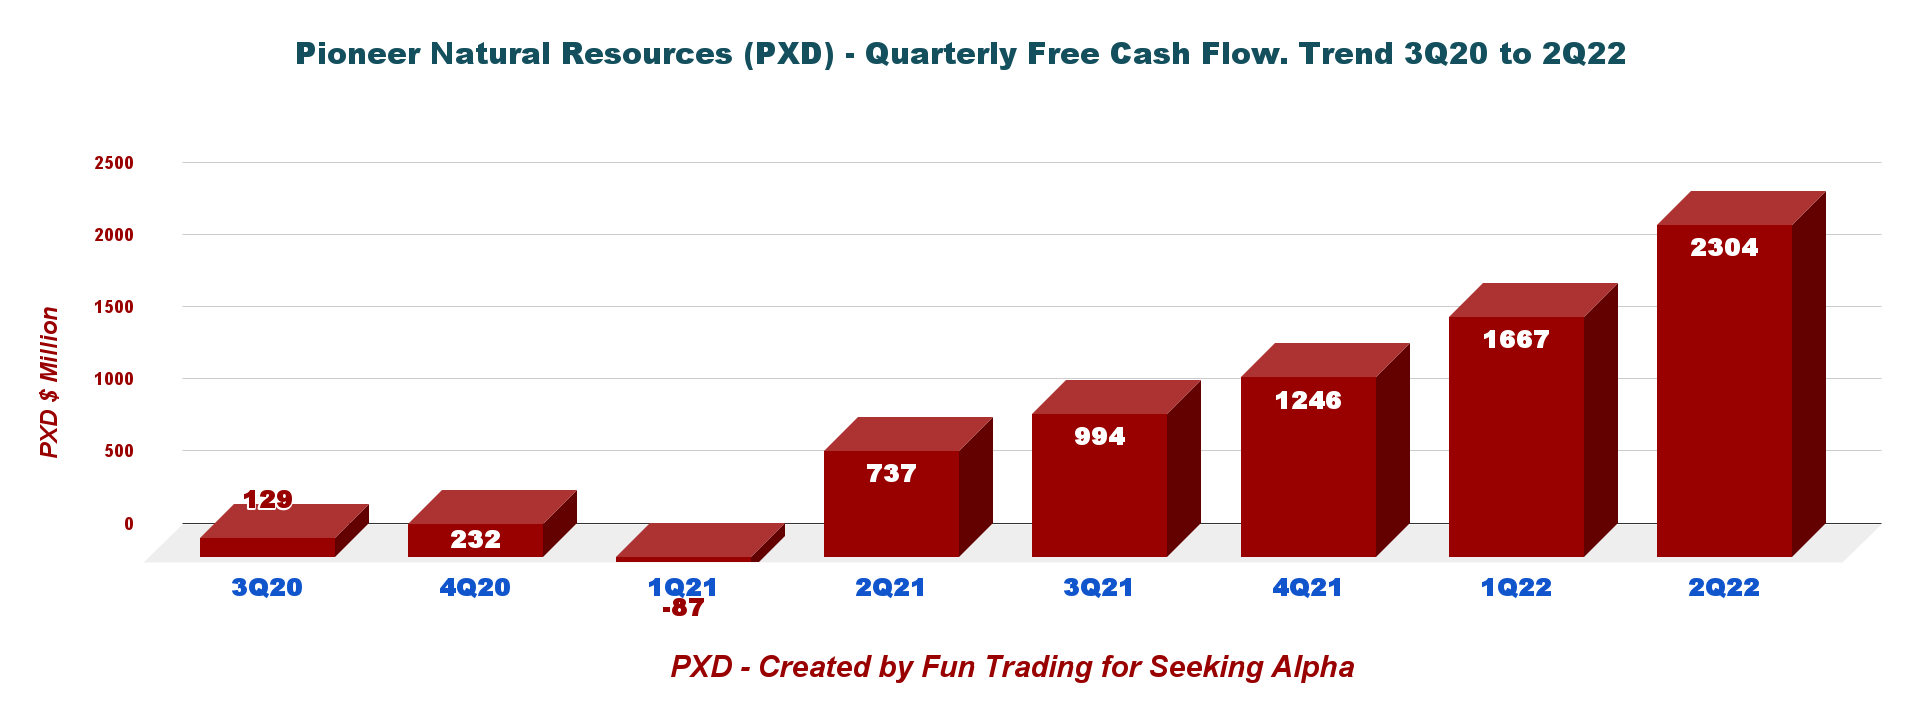
The company now pays a quarterly dividend of $0.78 per share plus $6.60 extra, or $7.38 per share. Furthermore, the dividend for 3Q22 is fixed at $1.10 per share plus $7.47 extra, which represents $8.57 per share or a whopping yield of 13.3%.
Also, Pioneer Resources has an ongoing $4 billion share buyback program, of which $1 billion has already been executed as of 2Q22.
PXD Buyback program (PXD Presentation)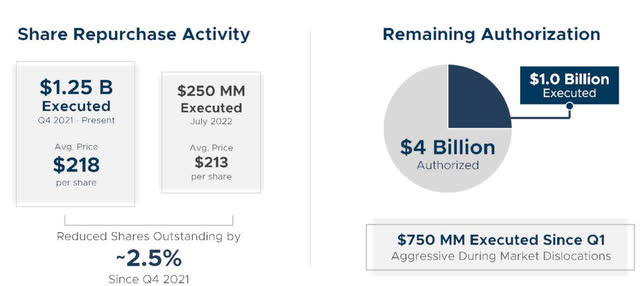
3 – Production was a Total of 642.844k Boep/d in 2Q22
Note: Production in the Permian Basin was 642.987K Boep/d
- 3.1 – Quarterly Oil Equivalent Production
PXD Quarterly Oil equivalent production history (Fun Trading)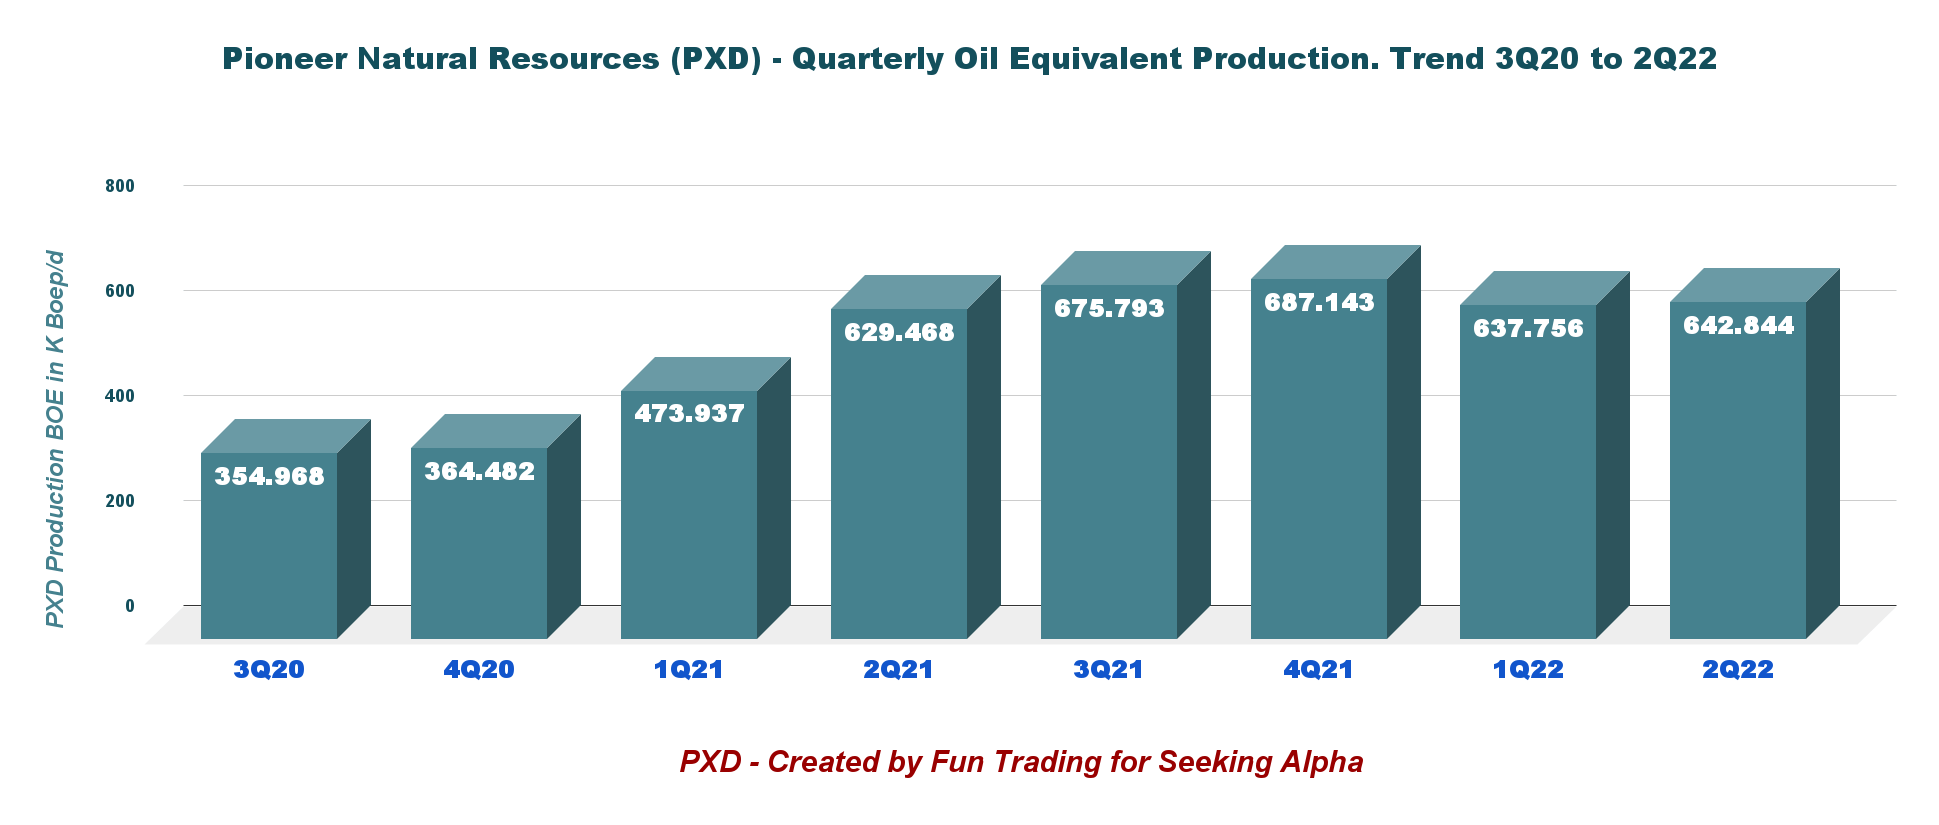
The company produced 642.844K Boep/d in the Second Quarter, comprising 79% of liquids (Oil+NGL). Production comes from the Permian Basin, with others representing minus 0.143K Boep/d in 2Q22. The company expects about 648K Boep/d for 3Q22.
- 3.2 – Equivalent production is spread between oil, NGL, and natural gas.
PXD Quarterly production in Oil, NGL and NG in 2Q22 (Fun Trading)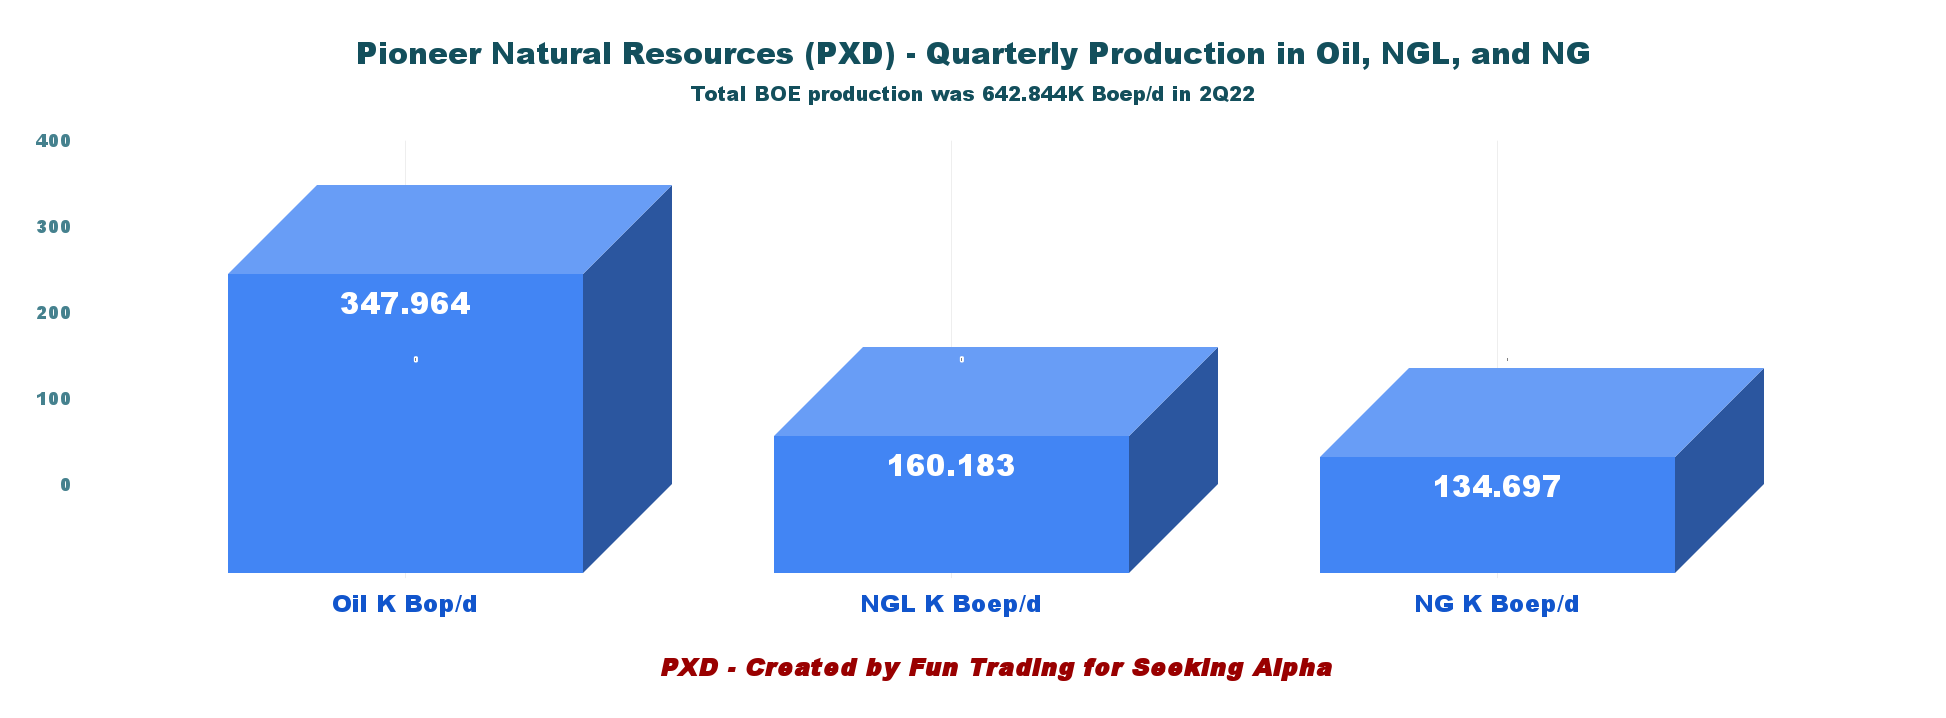
- 3.3 – Realized prices per Boe
PXD Oil and NG price per BOE (Fun Trading)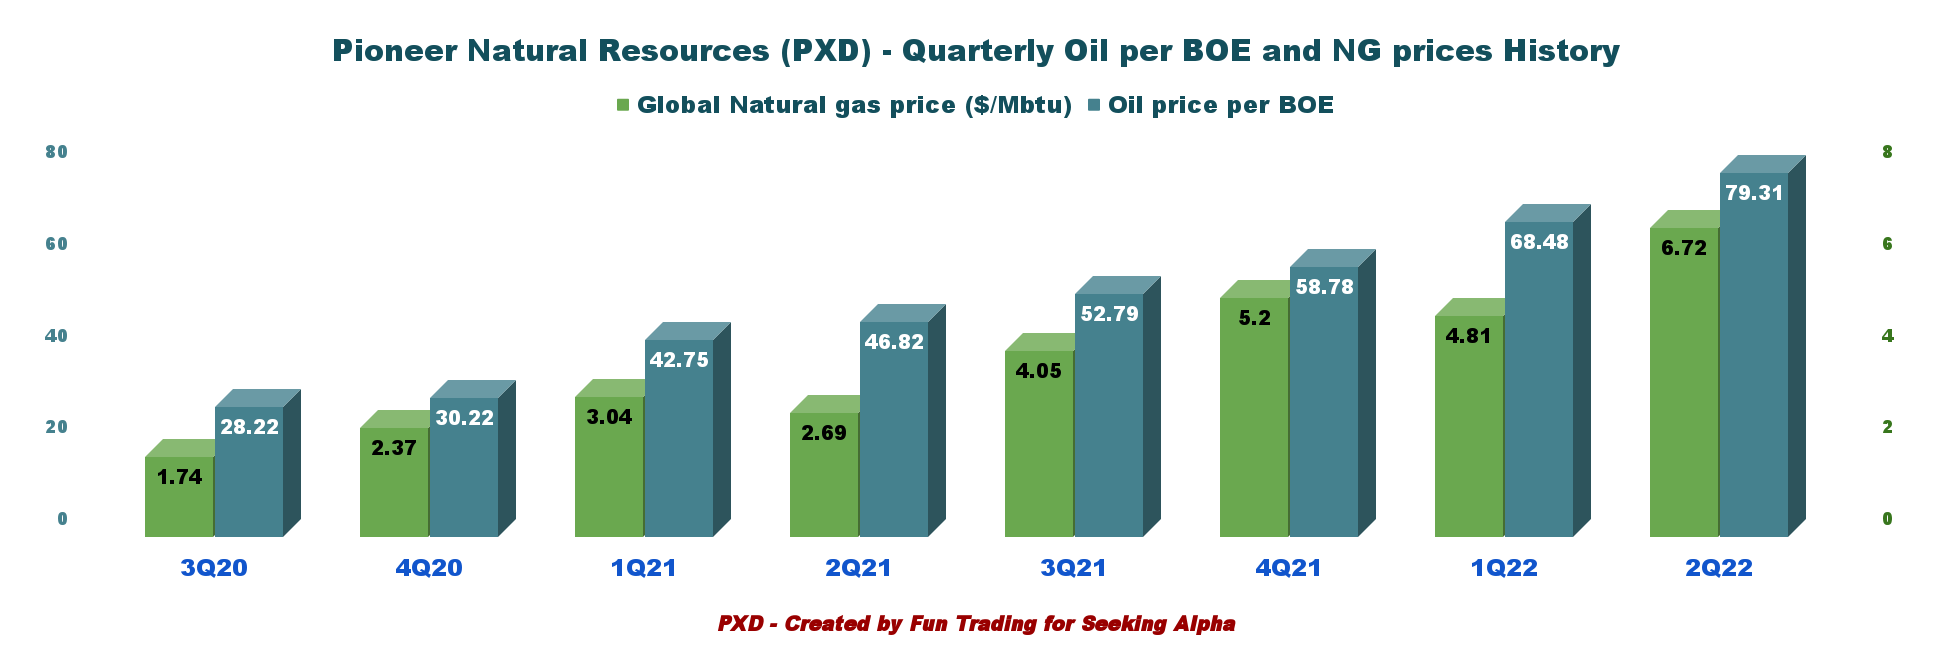
Prices of oil and NG have increased continuously over the past eight quarters and have nearly doubled on a year-over-year basis. I expect this trend to reverse starting in 3Q22.
- 3.4 – Production Costs per Boe
PXD Quarterly Production Costs History (PXD Presentation)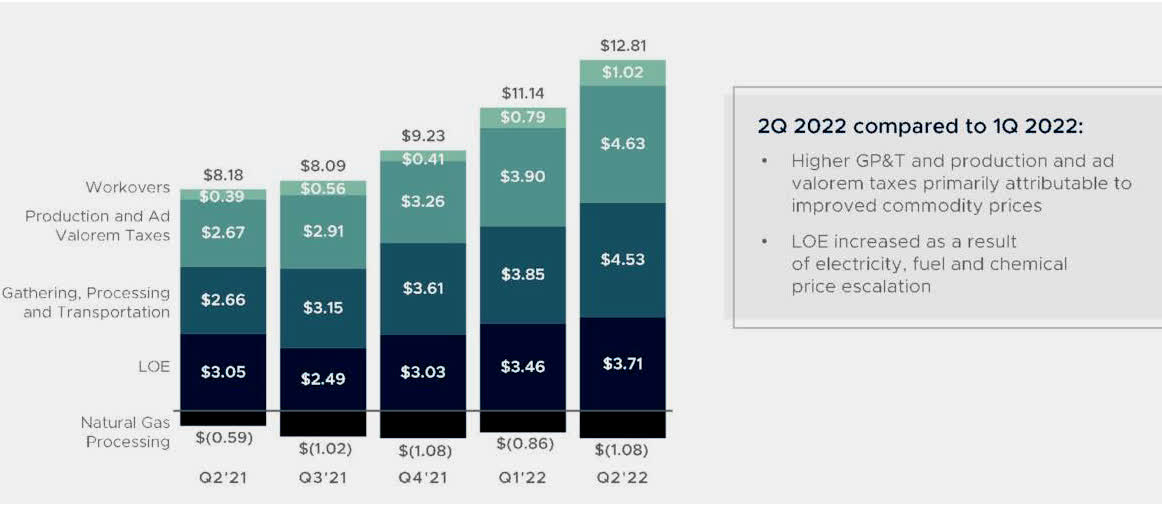
4 – Net Debt was $2.44 billion in 2Q22
Pioneer Natural Resources had cash and cash equivalents of $3,252 million as of June 30, 2022, compared with $245 million as of June 30, 2021. A considerable increase year over year.
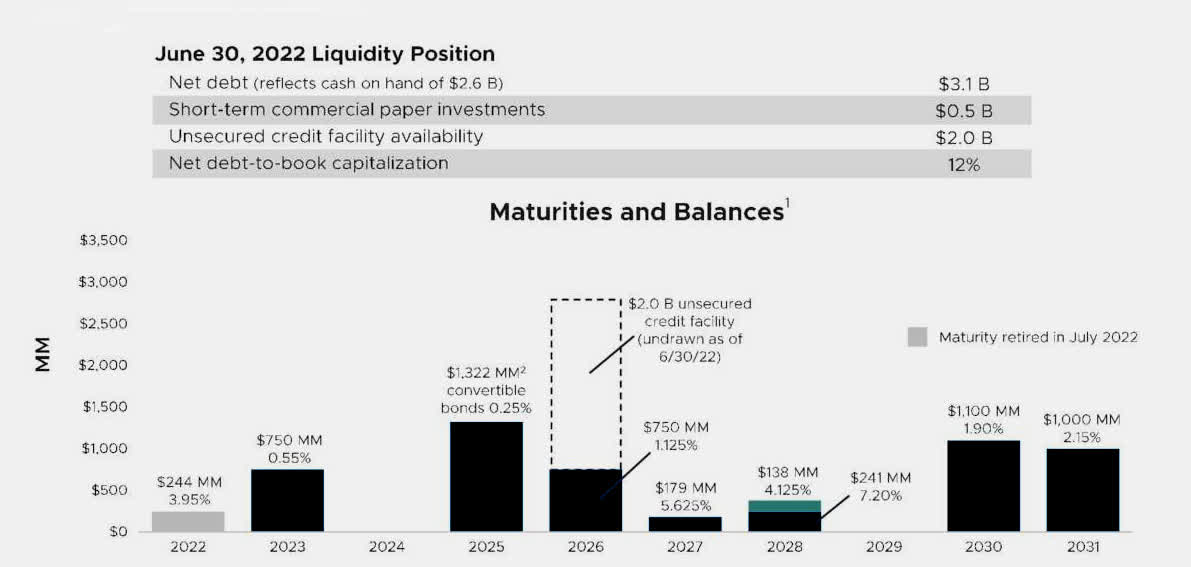
PXD Cash versus Debt history (Fun Trading) The total Debt was $5,693 million at the end of June 2022, including current. Net Debt to book capitalization was 12% in 2Q22, which is excellent. Total liquidity is $5.3 billion. Below are shown debt maturities and balances. The difference in Net Debt comes from the cash on hand used by the company, which is only a part of the total cash I use. PXD Liquidity position (PXD Presentation)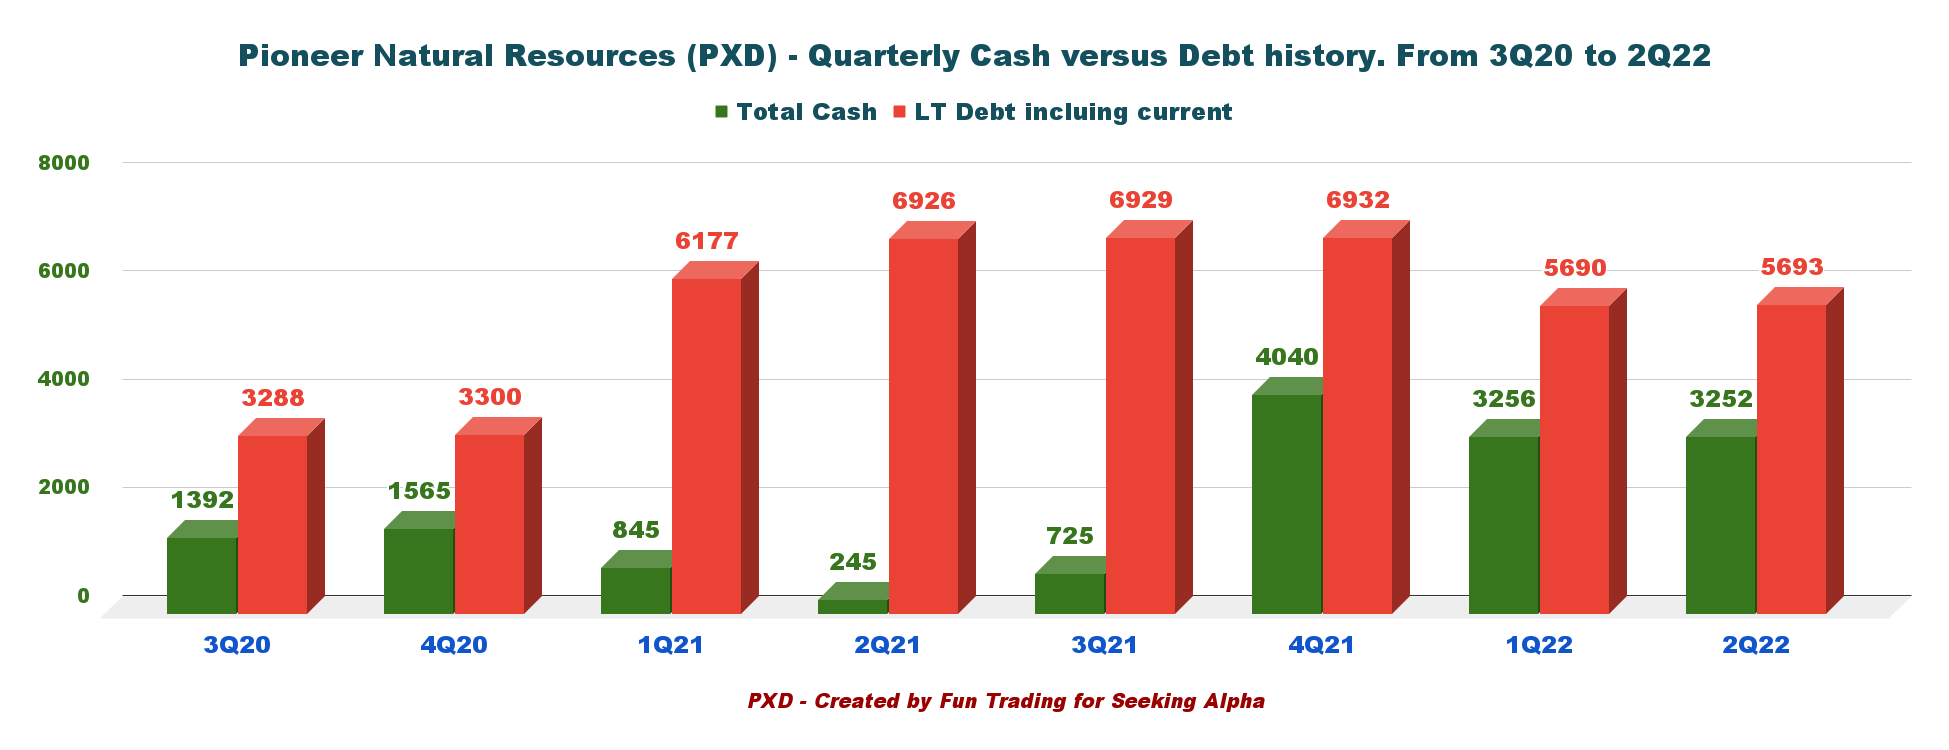
5 – 3Q22 Guidance is expected at 647.5K Boep/d (mid-point)
PXD 3Q22 guidance (PXD Presentation)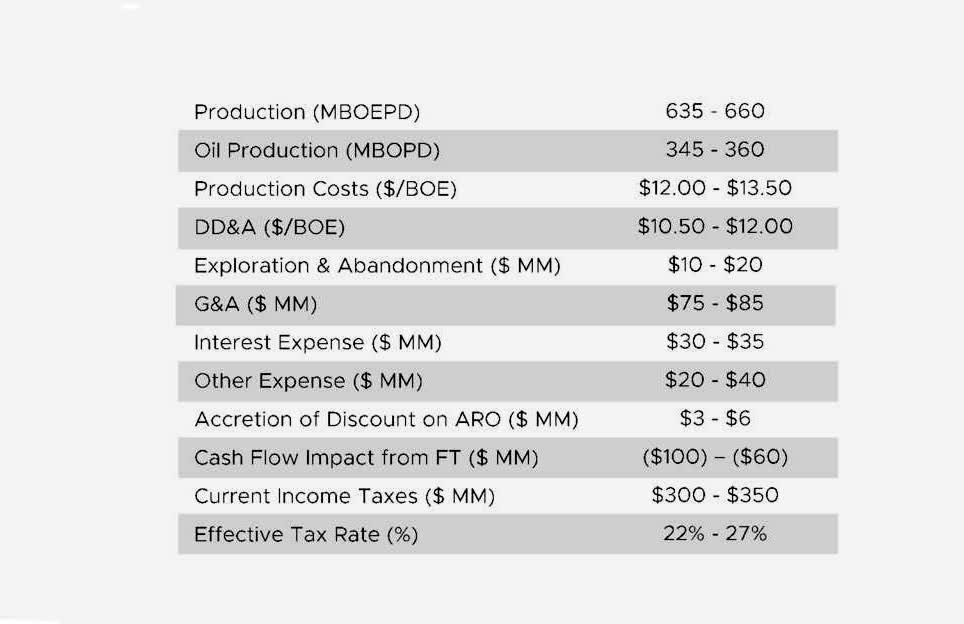
Revenues for the third quarter of 2022 will probably go down between 7% to 9% sequentially due to oil prices that have retreated from their record high.
Technical Analysis (Short Term) And Commentary
PXD TA Chart short-term (Fun Trading StockCharts)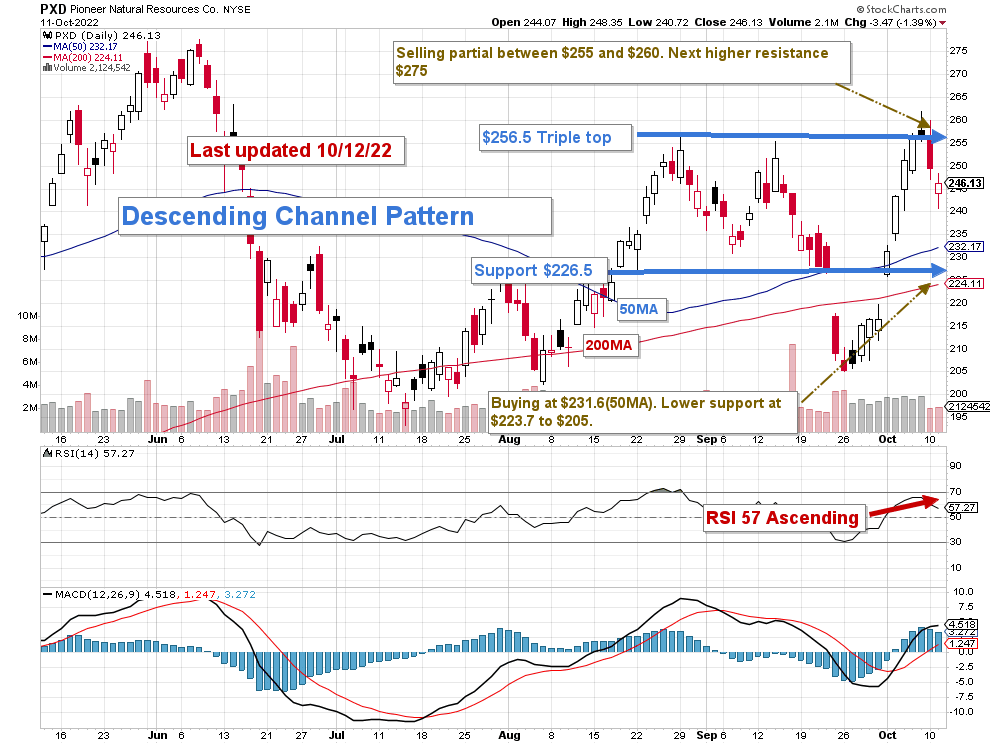
Note: The chart is adjusted for the dividend.
PXD forms an ascending channel pattern with resistance at $256.5 and support at $226.5
It is not easy to predict the future, but we can see that the global economy is weakening at a faster rate now. The FED’s action against rampant inflation increases the risk of a recession in 2023 or even sooner, and I expect another 75-point hike in November.
We cannot ignore those early signs and must protect our investment by adopting a strategy that takes the “best of both worlds.” It is what I promote in my marketplace, “The Gold and Oil corner.”
Thus, trading LIFO is the most suitable solution, in my opinion. It lets you keep a long-term position providing a sizeable dividend and allowing you to trade short-term fluctuations and increase your profit.
The trading strategy is to sell LIFO about 50% of your position between $255 and $260. I suggest accumulating PXD between $231.6 (50MA) and $223.71 (200MA) with possible lower support at below $210 if oil prices fall below $85 a barrel.
Note: The LIFO method is prohibited under International Financial Reporting Standards (IFRS), though it is permitted in the United States by Generally Accepted Accounting Principles (GAAP). Therefore, only US traders can apply this method. Those who cannot trade LIFO can use an alternative by setting two different accounts for the same stock, one for the long term and one for short-term trading.
Warning: The TA chart must be updated frequently to be relevant. It is what I am doing in my stock tracker. The chart above has a possible validity of about a week. Remember, the TA chart is a tool only to help you adopt the right strategy. It is not a way to foresee the future. No one and nothing can.
Author’s note: If you find value in this article and would like to encourage such continued efforts, please click the “Like” button below to vote of support. Thanks.
Be the first to comment