

juliyabrux/iStock via Getty Images
The Office REIT sector has been an upside surprise thus far in 2022. In fact, according to a recent sector report by Hoya Capital, Office REITs are the best-performing major property sector thus far this year.
I certainly didn’t see that coming. In a recent article, I named Office REITs as a borderline sector I suspected would underperform the REIT average in 2022. The year is still young, but this sector is off to a good start.
The Office REIT sector was hit hard by the pandemic, and the huge work-from-home trend, set in motion by the lockdown, has proven quite durable. Skilled workers now expect to work from home, at least 2 or 3 days per week, and will even sacrifice some pay in exchange, which makes sense, considering their savings in fuel and other commuting costs.
Hoya Capital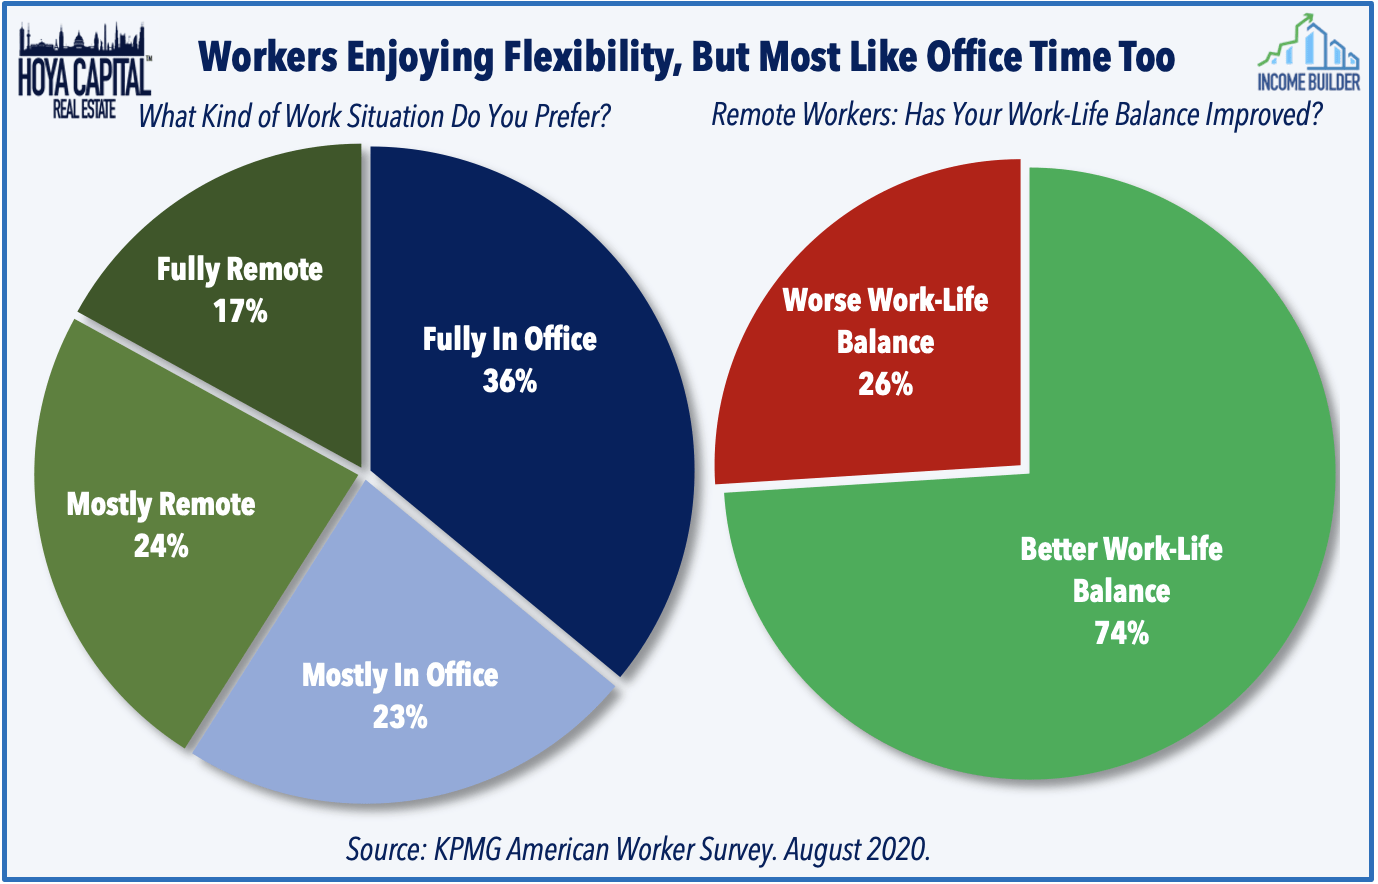
Fewer man-hours spent in the office means less need for office space. Occupancy in all markets nationwide is at best only about half what it was in early 2020, just before the pandemic arrived in the U.S.
However, there are signs that the worst is over, and office REITs are ready to stabilize in a new kind of normal. The supply-demand dynamic has turned slightly in the companies’ favor. According to Hoya,
Jones Lang LaSalle (JLL) noted in their recent Office Outlook that the U.S. office market registered positive net absorption for the first time since the onset of COVID-19 during the fourth quarter.
Location matters, as always. Some regions of the U.S. are faring better than others. Again according to Hoya,
Lower-cost secondary markets in the Sunbelt and the West continued to lead the way in Q4, with many of these markets approaching pre-pandemic levels of leasing volume, while larger coastal “gateway” cities continued to lag.
This may be a good time to reinvest in the Office REIT sector, particularly in companies with a substantial portion of their assets in the Sunbelt. Let’s look at the current state of play, and see which company is the best bet, going forward.
Balance sheet metrics
I always begin my hunt for a winner with the balance sheet, because a strong balance sheet is essential for weathering unexpected downturns, and during upturns, provides the leverage to fuel external growth.
There are 24 Office REITs in my coverage universe. Here are the key balance sheet metrics for each, in order by market cap.
| Company | Liq. Ratio | Debt Ratio |
Debt / EBITDA |
Bond Rating |
| Boston Properties (BXP) | 1.35 | 40% | 7.6 | BBB+ |
| Kilroy Realty (KRC) | 2.06 | 36% | 6.4 | BBB |
| Vornado Realty (VNO) | 1.57 | 52% | 11.2 | BBB- |
| Cousins Properties (CUZ) | 2.66 | 27% | 4.7 | — |
| Douglas Emmett (DEI) | 1.35 | 41% | 8.2 | — |
| SL Green Realty (SLG) | 1.81 | 51% | 11.6 | BBB- |
| Highwoods Properties (HIW) | 1.77 | 37% | 5.6 | BBB |
| Hudson Pacific Properties (HPP) | 1.71 | 46% | 7.5 | BBB- |
| JBG SMITH Properties (JBGS) | 0.94 | 39% | — | — |
| Equity Commonwealth (EQC) | 93.36 | 0% | — | — |
| Corporate Office Properties (OFC) | 1.61 | 42% | 7.0 | BBB- |
| Paramount Group (PGRE) | 1.73 | 64% | 8.2 | — |
| Brandywine Realty (BDN) | 1.78 | 45% | 6.9 | BBB- |
| American Assets (AAT) | 1.70 | 44% | 7.1 | BBB- |
| Piedmont Office Realty (PDM) | 1.83 | 45% | 7.8 | BBB |
| Easterly Government Properties (DEA) | 1.83 | 35% | 7.6 | — |
| Empire State Realty (ESRT) | 1.32 | 56% | 6.8 | — |
| Armada Hoffler Properties (AHH) | 1.40 | 43% | 10.2 | — |
| Alexander’s (ALX) | 1.22 | 56% | 5.7 | BB |
| Office Properties Income (OPI) | 1.55 | 70% | 8.6 | BBB- |
| Orion Office (ONL) | 2.61 | 44% | 6.5 | — |
| City Office (CIO) | 2.19 | 41% | 7.0 | — |
| Franklin Street Properties (FSP) | 2.35 | 45% | 2.1 | — |
| Creative Media & Community (CMCT) | 2.64 | 29% | 5.6 | — |
Source: Hoya Capital Income Builder, TD Ameritrade, and author’s calculations
In the table above, a value in bold type means the company excels on this metric. Normal type means the company falls between the Office average and the overall REIT average, so it doesn’t excel on this metric, but it does pass. Italic type means the company is worse than both the Office average and the overall REIT average on this metric.
With 24 companies to choose from, we can afford to be very strict on the balance sheet. Since we are winnowing down to just one company, let’s start by eliminating any firm that falls below both the Office REIT sector average and the overall REIT average on any of these metrics.
As you can see, there are a lot of companies in this sector whose balance sheets are battered. Looking at only those rows that have no italic cells, we have narrowed our search down to just six firms.
Growth metrics
I am a FROG hunter (seeking REITs with a Fast Rate of Growth), so the next thing I look for is companies with robust growth in FFO (funds from operations) and TCFO (total cash from operations). Growing companies are healthy companies, and the faster the rate of growth, the faster dividends tend to increase also. Let’s see how our 6 surviving candidates stack up, on 3-year CAGR (compound annual growth rate) in FFO and TCFO.
| Company | FFO | TCFO |
| Kilroy (KRC) | 8.67 | 5.70 |
| Cousins (CUZ) | 15.13 | 19.32 |
| Highwoods (HIW) | 4.11 | 4.95 |
| Equity Commonwealth (EQC) | 0.11 | (-43.77) |
| City Office (CIO) | NR | 20.23 |
| Creative Media & Community (CMCT) | (-84.94) | (-8.98) |
Source: TD Ameritrade and author’s calculations
EQC and CMCT are eliminated because their revenues and/or cash flow are shrinking rather than growing. Tiny CMCT may not be with us much longer.
The FROG criteria call for double-digit growth rates in TCFO and FFO. Only Cousins satisfies both criteria. City Office shows double-digit growth in cash flow, but the company does not report FFO. This is a caution flag for me because this makes it difficult to compare CIO to other REITs. However, since its 5-year revenue growth rate is 17.75%, I will give them the benefit of the doubt and say their FFO is growing at double digits.
So now we have two clear top-tier candidates (CUZ and CIO) and two clear second-tier candidates. Since KRC and HIW are growing in mid-single-digits or better, I choose to keep them in the running.
Dividend metrics
Next let’s see how each of our Final Four companies performs when it comes to paying dividends. Office REITs pay significantly better dividends than other REITs on average but tend to grow their dividends more slowly. The Dividend Growth rate in the table below is 3-year CAGR. Dividend Score projects the Yield three years from now on shares bought today, assuming the Dividend Growth rate remains the same.
| Company | Div. Yield | Div. Growth | Div. Score | Payout (FWD) | Div. Safety |
| CUZ | 3.32% | 7.17% | 4.07 | 46.8% | A- |
| CIO | 4.75% | (-13.9)% | 3.01 | 50.6% | B+ |
| KRC | 2.81% | 5.13% | 3.26 | 48.0% | A- |
| HIW | 4.50% | 2.63% | 4.84 | 52.5% | B+ |
Source: TD Ameritrade, Seeking Alpha Premium, and author’s calculations
The highest current dividend payer is CIO, but during the pandemic, this company slashed its dividend by 36%, and only recently restored it (and only partially at that). As a result, its dividend growth rate is negative, and its dividend score is the lowest of the four.
KRC has the lowest current Yield of our four finalists, and its dividend growth rate is not enough to lift KRC out of third place in Dividend Score, however.
CUZ, which came into this round as one of our two front-runners, pays a second-tier current Yield but has the highest dividend growth rate of the four finalists. Its Dividend Score of 4.07 places second in this round.
HIW pays a high yield, but its dividend growth rate is inferior. Nevertheless, the Dividend Score for HIW comes in the highest of our four finalists, at 4.84.
As a FROG hunter, I put less emphasis on current Yield, and higher emphasis on Dividend Growth, so to me, CUZ is still the front-runner. While HIW is a distinctly better dividend payer, the superior FFO and TCFO growth rates of CUZ make it likely to achieve superior Gain going forward.
COWhands, by contrast, want the highest safe Yield they can get. With a strong Dividend Safety rating of B+, and the highest Dividend Score of the four finalists, COWhands would put HIW in the lead. CIO is now running a distinct third, and KRC barely remains in the running, in fourth place.
Valuation metrics
COWhands also seek the lowest Price/FFO ratio they can get, in a company with a strong, safe Yield. FROG hunters like me don’t mind paying a premium price for shares in a fast-growing company. Here are the valuation metrics for our finalists.
| Company | Div. Score | Div. Safety | Price/FFO | Premium to NAV |
| CUZ | 4.07 | A- | 14.1 | (-12.3)% |
| HIW | 4.84 | B+ | 11.5 | (-14.5)% |
| CIO | 3.01 | B+ | 10.9 | (-19.9)% |
| KRC | 3.26 | A- | 16.5 | (-19.6)% |
| Office Average | 4.14 | B+ | 16.4 | (-18.0)% |
| REIT Average | 3.31 | C | 26.2 | (-5.0)% |
Source: Hoya Capital Income Builder, Seeking Alpha Premium, and author’s calculations
KRC can now be safely eliminated, since it sports the highest Price/FFO ratio of the four finalists. COWhands would gravitate either to HIW or CIO. FROG hunters have been non-plussed by KRC’s FFO and TCFO growth rates all along.
As a FROG hunter, I still favor CUZ. Even if I cared about Price/FFO, CUZ is selling for a price well below both the Office average and the overall REIT average, so nothing has happened here to change my mind.
Final round: Modeled Return and Market Cap
My goal every year is to outperform the Vanguard Real Estate ETF (VNQ). Otherwise, why do all the work to pick individual companies?
Modeled Return is a Rube Goldberg device I invented, for the purpose of doing an apples-to-apples final score for all REITs in my coverage universe. It is derived by adding the 3-year trailing share price Gain (CAGR) to the Dividend Score. I consider this the bottom line, and only invest in companies whose Modeled Return exceeds that of the VNQ. (Note: Modeled Return is not an attempt to forecast this year’s return. All it does is identify which REITs are likely to outperform the VNQ. The bigger the difference in Modeled Return between the company and the VNQ, the better the odds of outperformance.)
| Company | Market Cap | Modeled Return |
| CUZ | $5.74 B | 4.10 |
| HIW | $4.67 B | 3.28 |
| CIO | $0.73 B | 14.65 |
| VNQ | — | 13.67 |
Source: TD Ameritrade and author’s calculations
Our two front-runners both sit in the market cap sweet spot, and would emerge as co-champions but for one thing: they are unloved by the market. Their share prices are lower now than they were three years ago, so their Modeled Returns of 4.10 and 3.28 are even lower than their Dividend Scores, and far short of the VNQ’s standard of 13.67.
The only company that has outpaced the VNQ is CIO. With a solid balance sheet and double-digit growth in FFO and TCFO, CIO is a FROG in every sense except one: it is too small. Research shows that companies with market caps under $1.4 billion tend to underperform the market. So CIO is what I call a Tadpole, and with a market cap of $0.73 billion, it is just now sprouting legs. Tadpoles can be very good investments, but the risks are such that it’s best to keep allocations small.
So there are no FROGs among Office REITs. Therefore, if you are going to invest in an Office REIT, it makes sense to choose a COW rather than a FROG, playing for value rather than growth. Forget Modeled Return and go for the highest safe Yield you can get. Since HIW has a little safer dividend than CIO, and a sturdier market cap, right in the sweet spot that lies between $4 billion and $10 billion, it is a slightly better choice than CIO, and worthy of a larger allocation.
All three REITs have strong Sunbelt exposure.
And the winner is . . .
It’s a tie!
For FROG hunters, the best choice is City Office (CIO), but with a relatively small allocation.
City Office REIT, Inc.
For COWhands, the best choice is Highwoods Properties (HIW).
Highwoods Properties Inc.
Honorable mention goes to Cousins Properties (CUZ), for its strong balance sheet, high growth rate, competitive and safe dividend, and strong concentration of assets in the Sunbelt. CUZ has everything except the market’s love.
Cousins Properties Incorporated
Be the first to comment