

Diego Thomazini/iStock via Getty Images
This article was first released to Systematic Income subscribers and free trials on Mar. 30
Recent market volatility has opened up discount valuation divergences between very similar CEFs. This offers income investors an opportunity to pick up additional yield, adopt a more defensive stance and generate alpha in their portfolios. In this article we highlight a number of switches in the Tax-exempt, Preferred and Loan CEF sectors.
Relative Value Rotation Recap
CEF switches or, relative value rotations, as we call them are a way for investors to get exposure to assets they may be already holding at a cheaper valuation. The point isn’t to find the fund with the widest discount or the “cheapest” fund there is but to provide the same type of allocation investors are already comfortable with but at a better price, so to speak.
Relative value rotations have a number of advantages for income portfolios. First, they can provide an additional margin of safety in the portfolio by providing exposure to very similar assets as other funds but at a cheaper valuation. Periods of market weakness tend to see significant weakness in high premium funds while funds already trading at cheaper valuations tend to be more resilient.
Second, relative value rotations can enhance portfolio yield by giving investors access to very similar assets but at a greater discount. The wider the discount, the higher the yield on the same set of assets, all else equal.
Third, relative value rotations that can deliver alpha – or an additional return over and above a static allocation. Because underlying yields are still relatively low, even 1% of additional alpha per year goes a long way.
Finally, switching into a similar but more attractively valued fund can also provide tax-loss harvesting opportunities, particularly relevant after a significant drawdown this year.
Current Opportunities
In this section, we highlight a number of relative value opportunities in the current CEF market. Specifically, we identify a pair of pretty similar funds – those holding fairly similar assets, often managed by the very same manager with a similar mandate – whose valuations have diverged from its historic pattern.
We like the PIMCO Income Strategy Fund II (PFN) over PIMCO Income Strategy Fund (PFL) with PFN trading at a 3.8% lower premium than PFL which is historically cheap. The right-hand chart shows the differential between the premiums of PFL and PFN, highlighting that PFL trades at an unusually elevated premium vs. PFN.
Systematic Income CEF Tool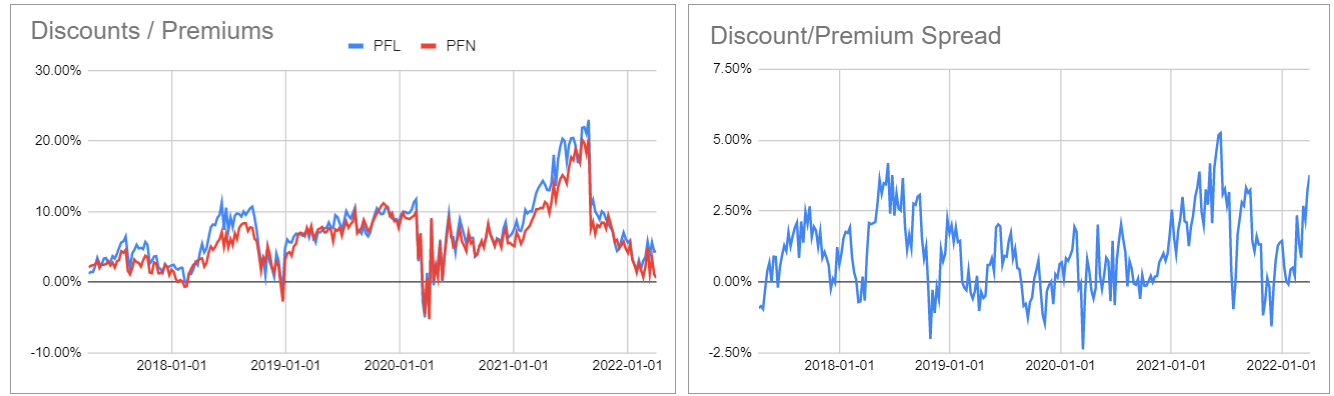
The two funds run very similar allocation profiles, leverage levels and fee structures (in fact, PFN has a tad lower fee).
Systematic Income CEF Tool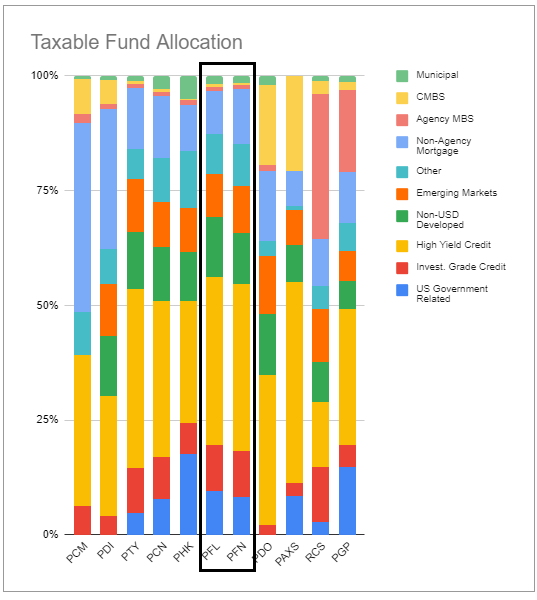
Their total NAV returns have tracked each historically with PFL pulling ahead very slightly which could be because of its slightly higher leverage level in 2021. We view PFN as one of the most attractive funds in the PIMCO suite at the moment. It trades at a 0.6% premium and a 10.11% current yield. It has a duration of 3.7.
Systematic Income CEF Tool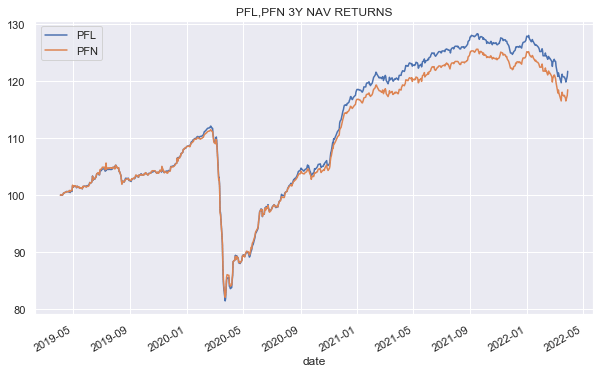
Staying with PIMCO, within their New York tax-exempt suite we like the PIMCO New York Municipal Income Fund II (PNI) vs. the PIMCO New York Municipal Income Fund III (PYN). The valuation between the two funds collapsed earlier in the year but has begun to widen out again. The two funds have put up pretty similar longer-term total NAV returns.
Systematic Income CEF Tool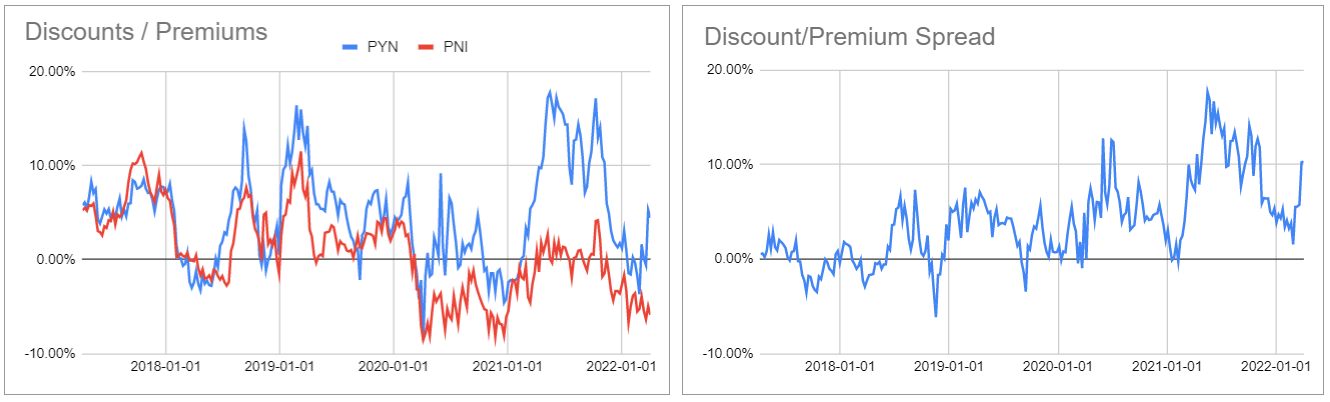
The valuation of PNI has been trading in line with the broader New York tax-exempt sector – fairly unusual for a PIMCO fund and despite the fact that the fund has strongly outperformed the sector historically.
Systematic Income CEF Tool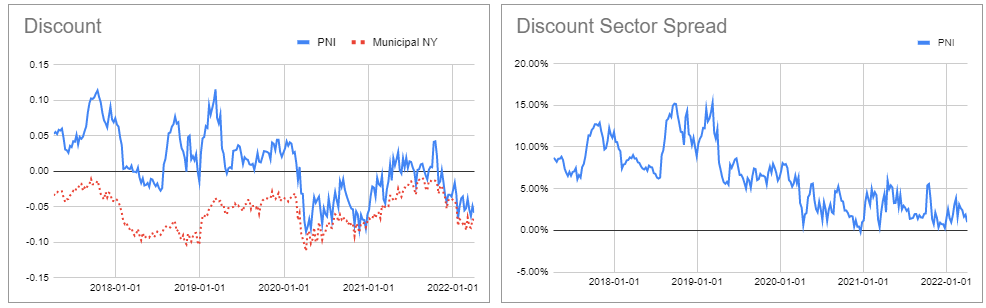
In the preferreds sector we always like to check in on the Flaherty suite of 5 funds in the sector. Currently, the Flaherty & Crumrine/Claymore Total Return Fund (FLC) is trading unusually cheap vs. the Flaherty & Crumrine Dynamic Preferred and Income Fund (DFP). And although DFP should trade at a higher valuation than FLC due to its very similar portfolio but lower management fee, the current divergence looks excessive. The two funds have put up essentially identical historic total NAV returns. The Flaherty suite of funds have put up the best historic performance in the sector and are worth following.
Systematic Income CEF Tool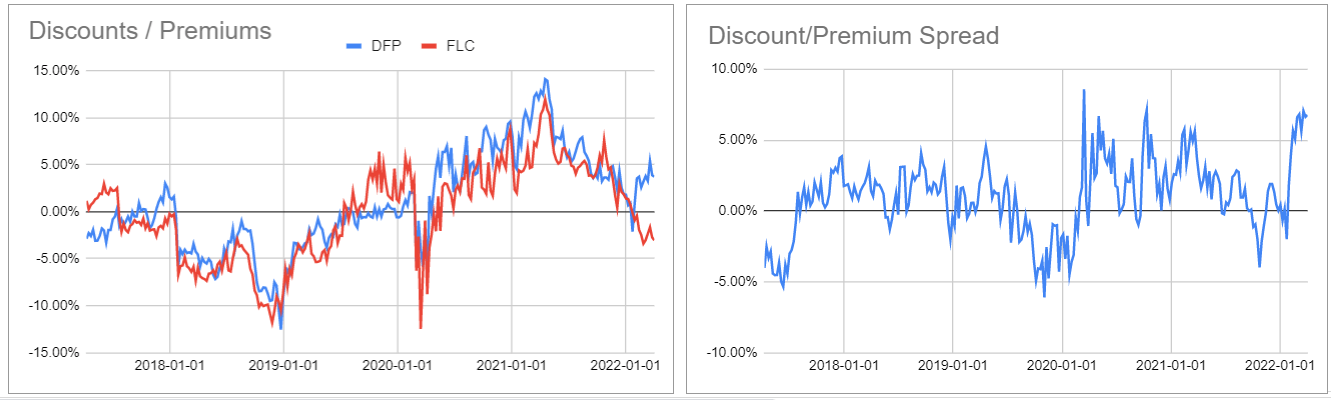
Also, in the preferreds sector, within the John Hancock suite, we like the John Hancock Preferred Income Fund (HPI) over the John Hancock Preferred Income Fund III (HPS). The John Hancock trio of funds run pretty much the same portfolios that have a much smaller allocation to financials than most other preferred CEFs. HPI trades at a 1.7% discount and a 7.86% current yield.
Systematic Income CEF Tool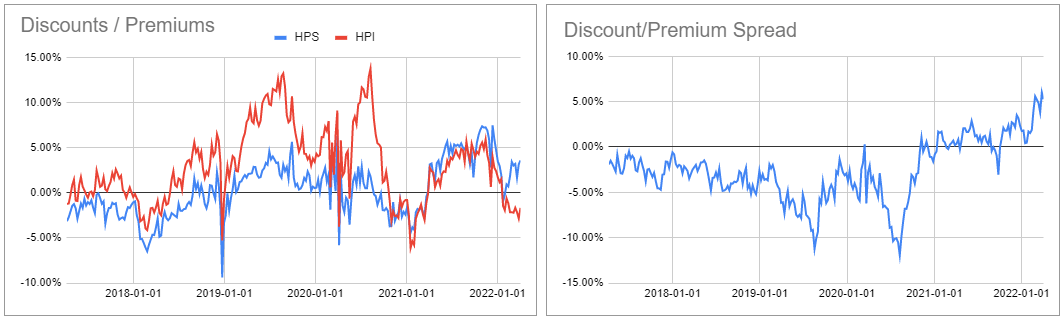
Finally, in the loan sector within the BlackRock set of funds we like the BlackRock Debt Strategies Fund (DSU) over the BlackRock Floating Rate Income Strategies Fund (FRA). While FRA is a pure loan fund, DSU has a 13% high-yield bond footprint as well. DSU has handily beaten FRA in historic total NAV returns as well as the broader sector. Its year-to-date total NAV performance is an impressive -1.6%. DSU trades at a 9.2% discount and a 7.1% current yield.
Systematic Income CEF Tool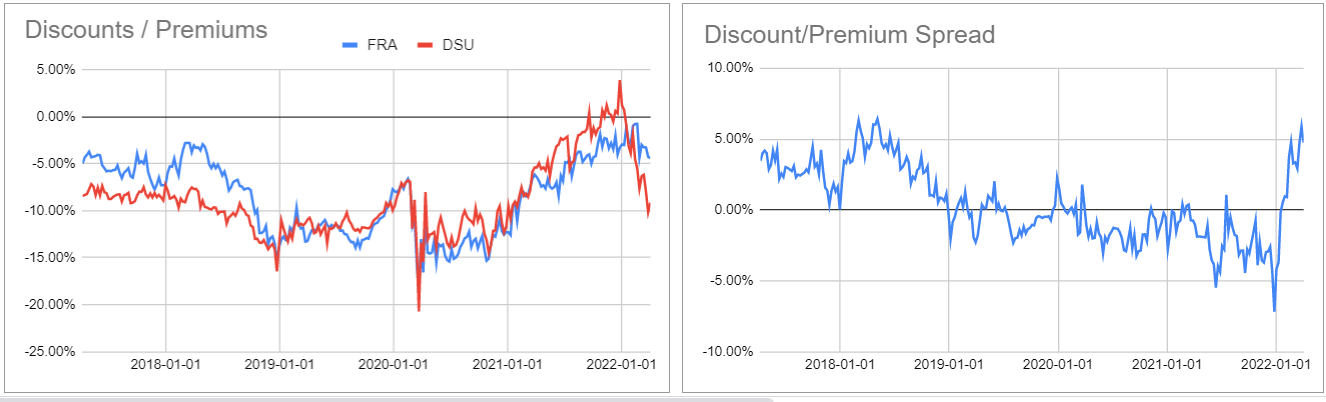
Takeaways
Recent volatility has pushed around discount valuations of pretty similar funds – a common dynamic which offers a number of attractive switch opportunities for CEF investors. Pursuing CEF rotations can provide additional margin of safety, while generating additional alpha and enhancing portfolio yield. This slow-but-steady focus on both defense and offense can keep income portfolio income levels and returns on a surer footing over the longer-term.
Be the first to comment