

Kimberly White
Dalolism and Thesis
Readers familiar with our writings know that our approach is fundamentally shaped by the thinking of Ray Dalio. As detailed in our early articles:
Diversification across different stocks is the LAST step of investing. The grand investing hierarchy should begin with risk isolation, asset class allocation, geographical diversification, and consideration of macroscopic cycles. That is why both in our own accounts and in our marketplace service, our first step is always risk isolation using a barbell model. Then the second step is asset allocation across classes that respond differently to fundamental economic forces as shown in the chart below. Only after these steps, do other more detailed steps follow.
Source: macro-ops.com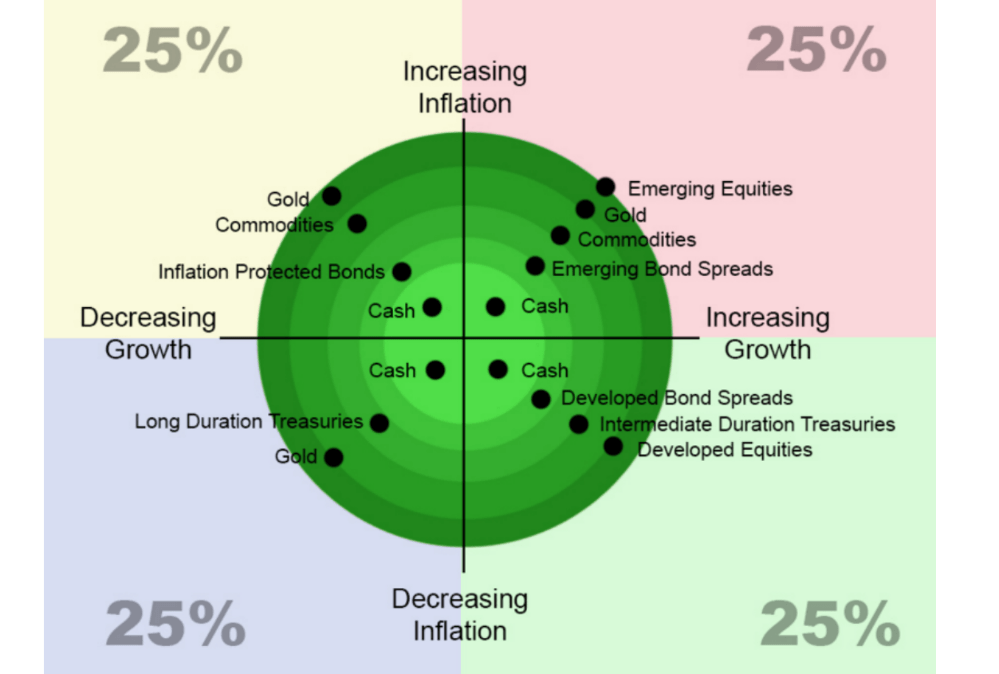
This article will focus on two other aspects of Dalioism: geographical diversification and the considerations of macroscopic cycles. In particular, I will examine two tobacco stocks, Philip Morris (NYSE:PM) and British American Tobacco (NYSE:BTI). I will argue that both PM and BTI are exemplary stocks that fit into the Dalio hierarchy. More specifically, the remainder of this article will argue:
- They both provide a hedge again the ongoing macrocycles. Due to the unique nature of their products, both PM and BTI have demonstrated resilience under different market conditions and insensitivity to macrocycles. Moreover, both of them are yielding far above their historical averages (as you can see from the next chart) AND also far above risk-free rates, providing a thick cushion against interest uncertainties.
- They both also provide excellent geographical diversification, especially for those whose exposures are mainly toward U.S. assets.
- And finally, their combination of a high return on capital employed (“ROCE”), capital allocation flexibility, and very reasonable valuation also provide favorable odds for long-term price appreciation.
Source: Seeking Alpha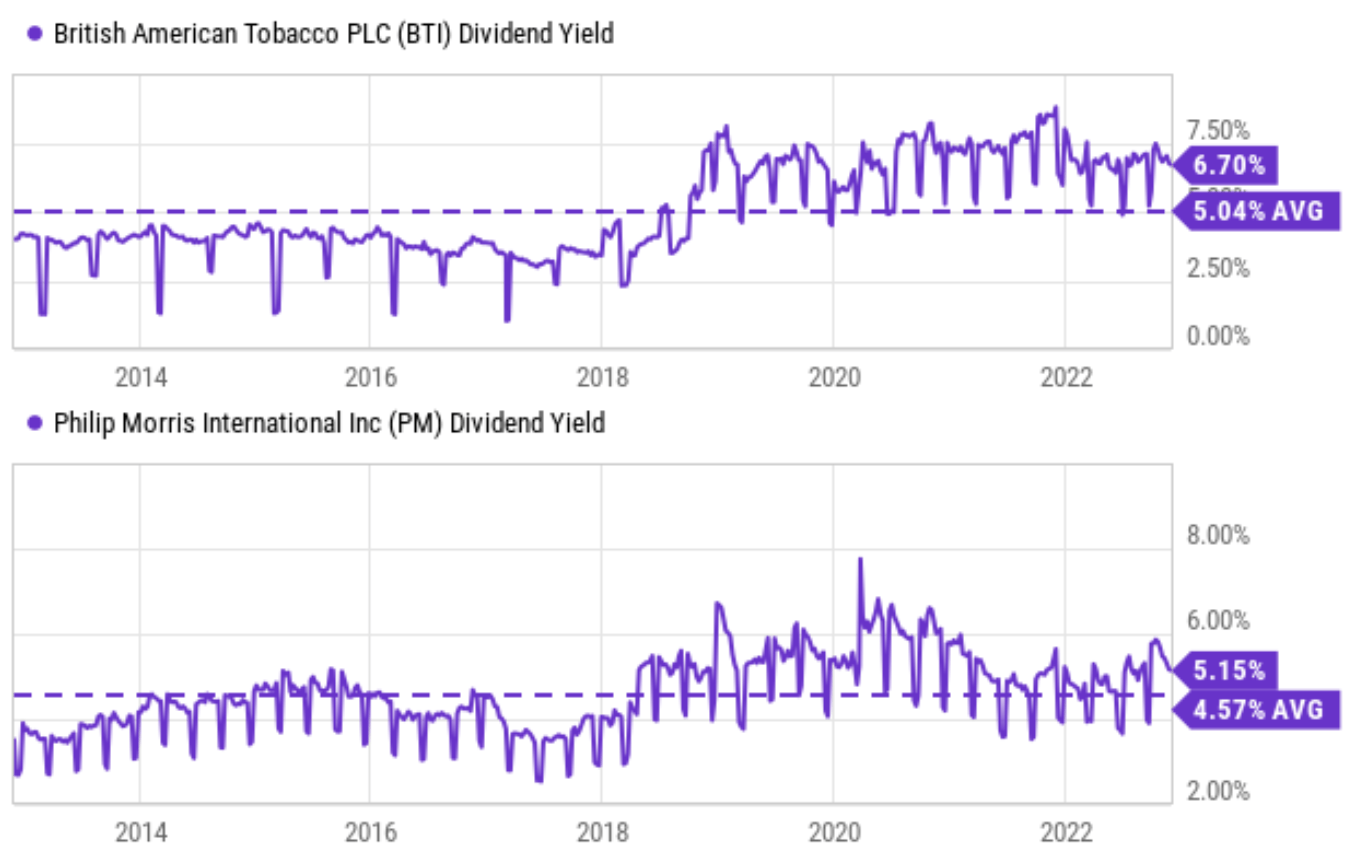
PM and BTI: Profitability and capital allocation flexibility
Both stocks have suffered setbacks and are still facing speedbumps ahead (to be detailed in the risk section). But over the long run (say 20 or 30 years or more), these leading tobacco stocks have demonstrated superb resilience and both stocks have far outperformed the overall market. And as you will see next, I see little change in the economics of both stocks compared to what they were 20 or 30 years ago. Both stocks still enjoy extremely low capital requirements (in Buffett’s language, “takes a penny to make”), superb profitability (“sells for a dime”), and remarkable brand loyalty.
The table below provides a snapshot of their profitability. Just to cite a few example metrics, PM’s gross profit margin (“GPM”) is already remarkable at 65.6%. And BTI’s GPM is even higher at 82.5%. To provide a reference point, the GPM of Apple (AAPL) – the poster boy for high profitability – was “only” around 45% in its recent quarterly report.
In terms of bottom-line metrics, their metrics are equally outstanding. For example, PM boasts a net profit margin (“NPM”) of 27.6%. And the NPM of BTI is ~20.5%. These levels of NPM are again far above the overall economy (about 8% on average) and extremely competitive even when compared to AAPL (about 25% on average in recent quarters).
Source: Seeking Alpha data.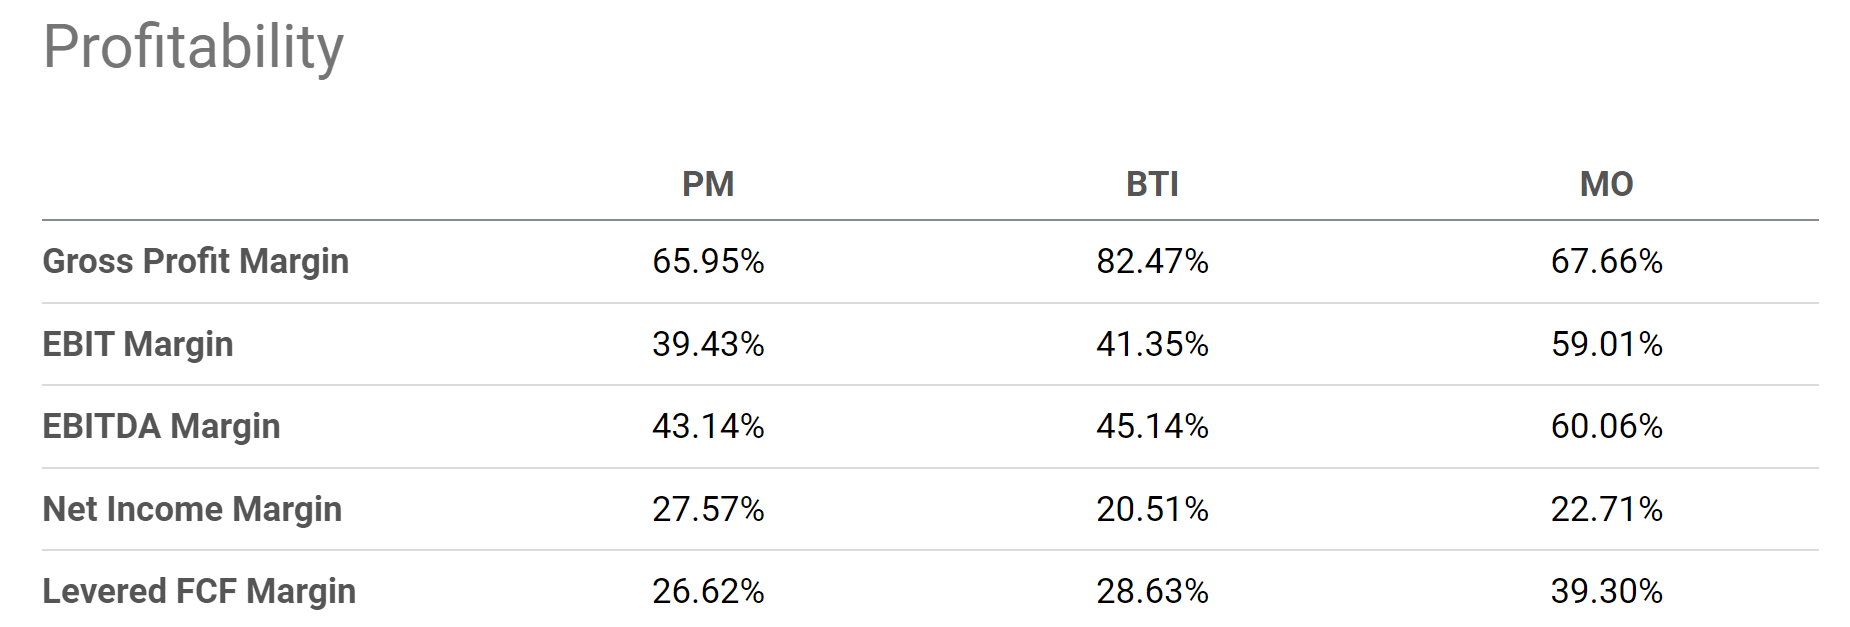
Thanks to such superb profitability, both PM and BTI are in a stable financial position and enjoy excellent capital allocation flexibly. As you can see from the following chart, both have been reducing their debt consistently in recent years year. To wit, PM has been reducing its debt since 2018 from a peak of $34 billion to the current level of $27 billion. The trend for BTI is very similar as seen from the bottom panel. Its debt also peaked in 2018 at around a total of $62 billion. Then it has been in constant decline to the current level of $54.4 billion.
Source: Seeking Alpha data.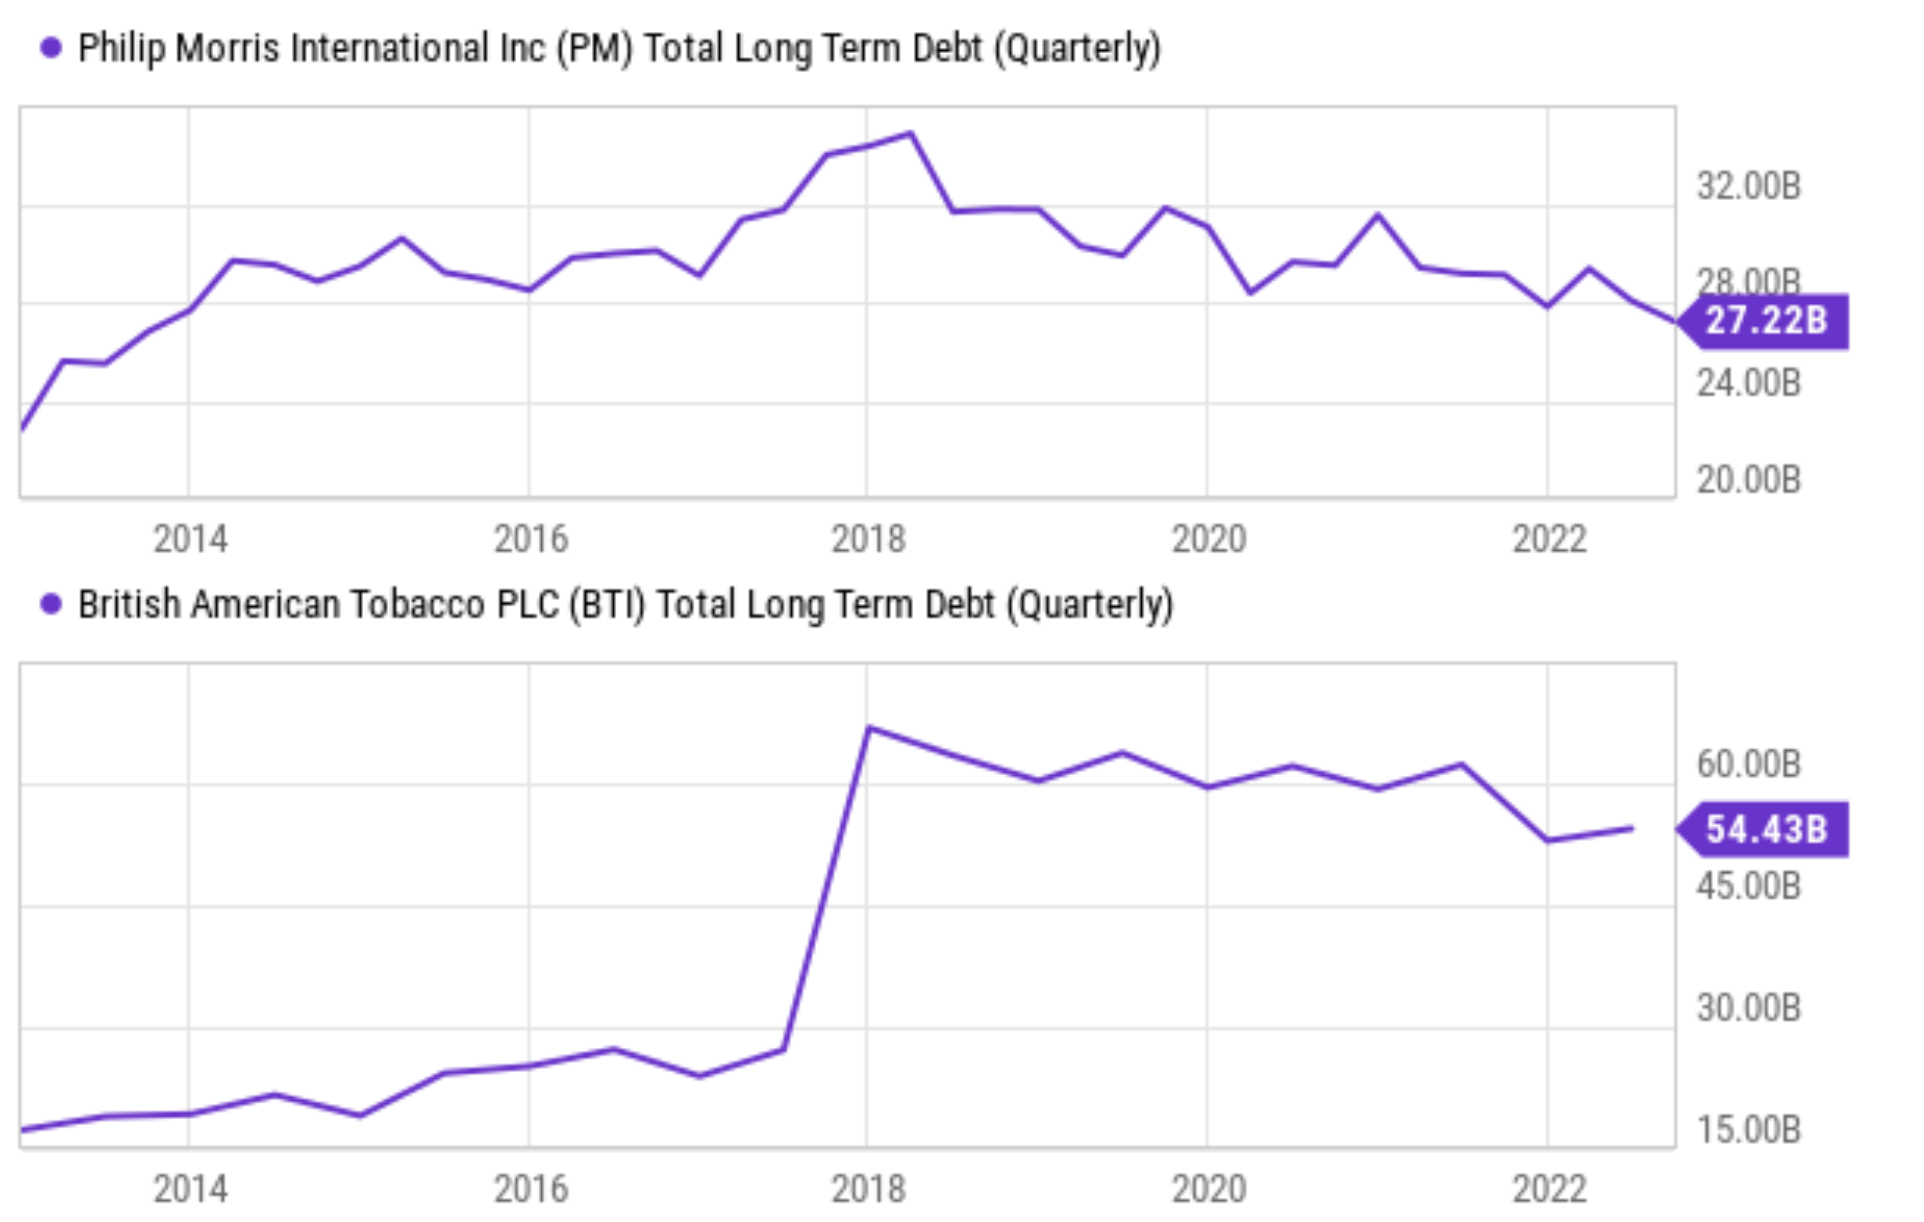
The combination of strong profitability and the reduced debt burden has brought about capital allocation flexibility for both companies. Specifically, as you can see from the chart below, PM’s interest coverage now hovers around a peak level in a decade, almost at 22x, which means PM only needs less than 5% of its EBIT earnings to service its debt. The picture of BTI is a bit weaker in relative terms as seen from the bottom panel, but still remarkably strong overall. BTI’s current interest coverage sits at 6.1x, again far below PM’s 22x (but PM is way too conservatively leveraged in my view). And if we broaden our view a little bit, the average interest coverage for the S&P 500 index is about 6x – a bit lower than BTI. But just as mentioned above, the average profitability of the S&P 500 index is nowhere near BTI.
Source: Seeking Alpha data.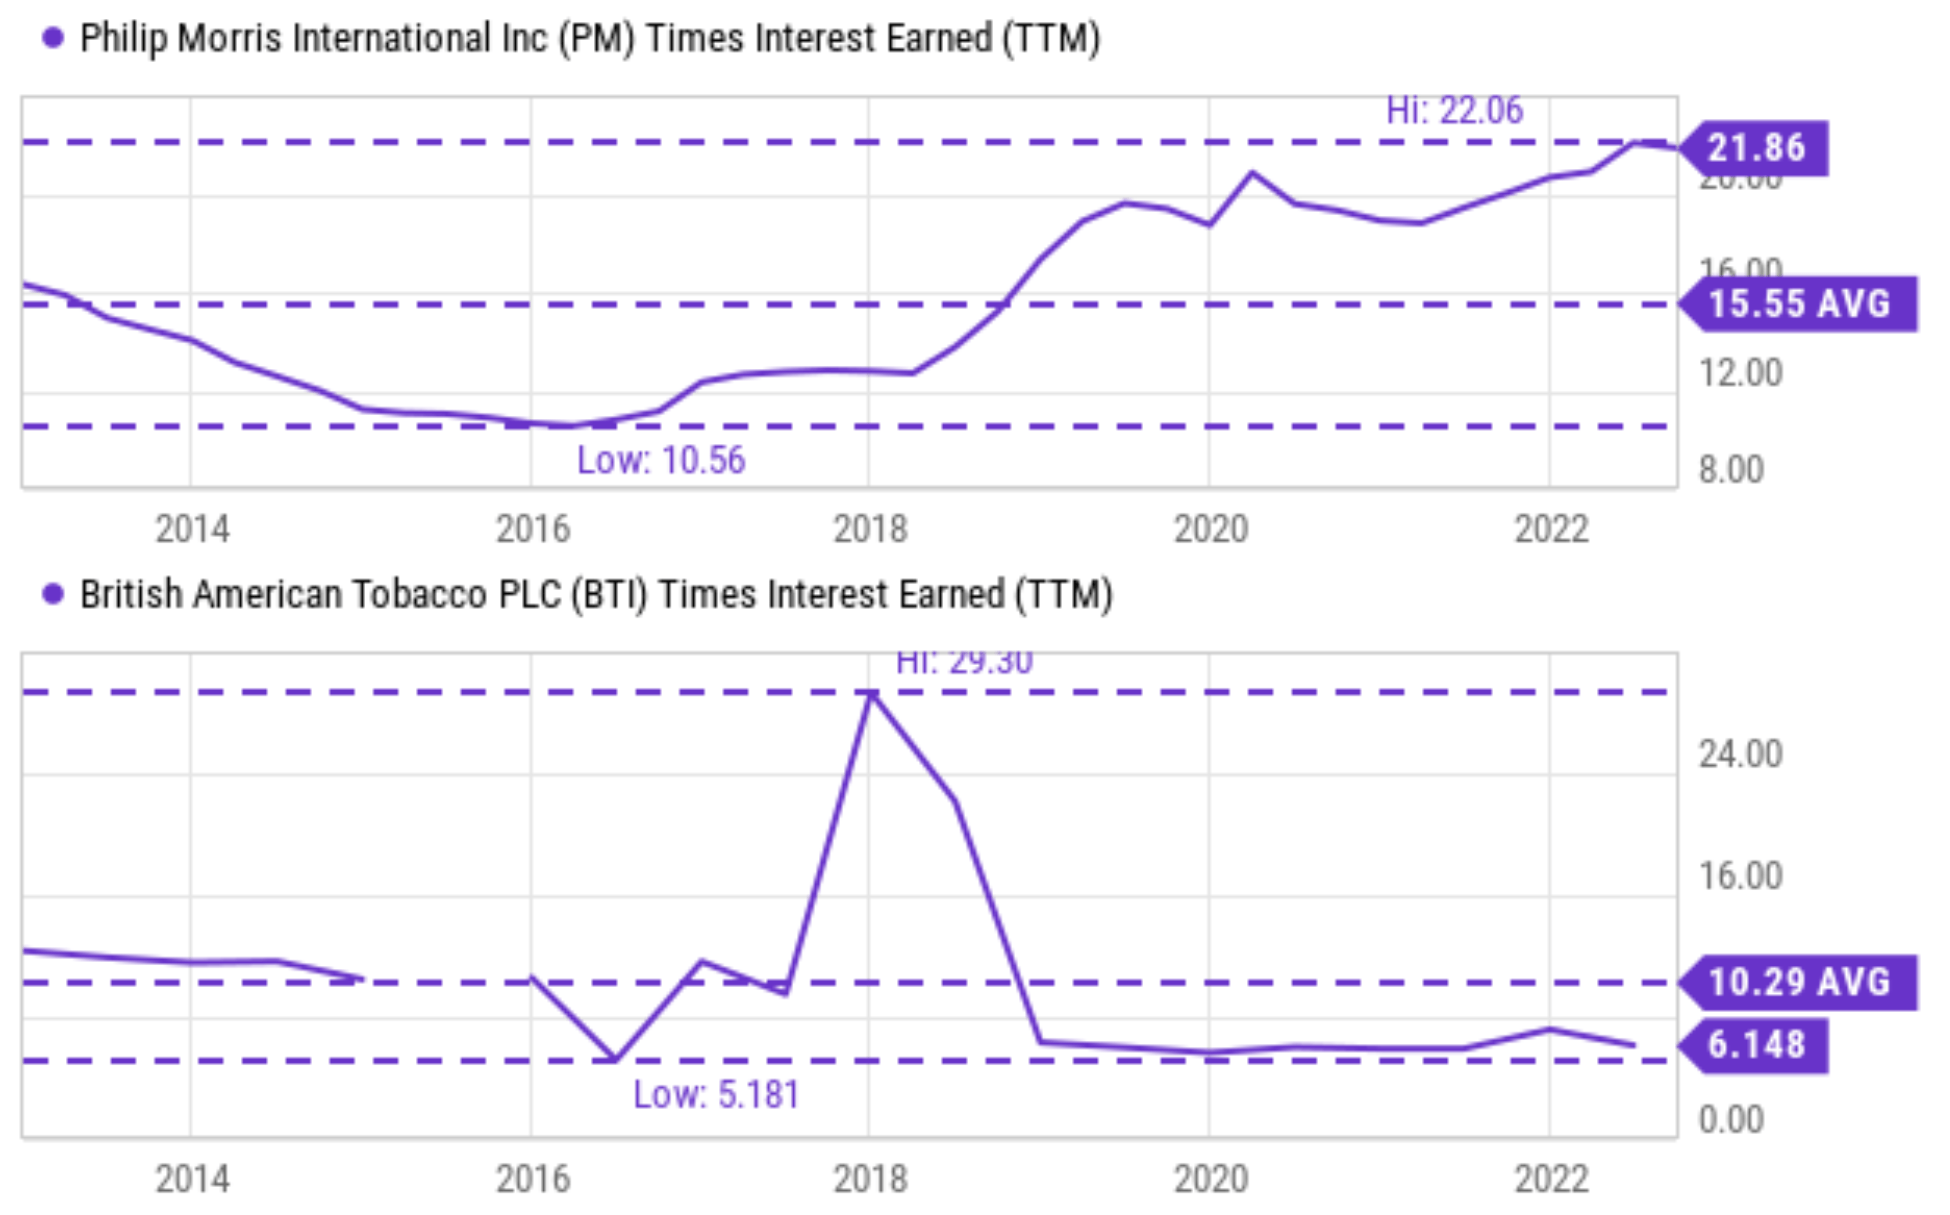
ROCE and long-term growth potential
As mentioned earlier, currently, both stocks offer a well-rounded combination of a high return on capital employed (“ROCE”), capital allocation flexibility, and very reasonable valuation. And this section will show that such a combination offers extremely enticing long-term return potentials. As detailed in our other writings, from the perspective of a long-term business owner, the growth rate is the product of ROCE and reinvestment rates (“RR”) in the long run.
The chart below shows the ROCE for both PM and BTI over the past 10 years. As you can see again, both of them have demonstrated ROCE that were both superb and stable over the long haul (that is why I mentioned earlier that I view their economics as unchanged compared to 20 or 30 years ago). As a matter of fact, both of them actually have improved their already-superb ROCE over the past decade. To wit, PM maintains a ROCE of 62.3% on average in the past 5 years since 2017, compared to an average of 45% in the earlier part of the decade. And BTI’s improvement is even more dramatic. Its average ROCE was about 45% too in the earlier part of the decade. But currently, it hovers around 91.7% on average in the past 5 years since 2017.
If we assume a 5% RR (which is about their historical average in recent years),
- PM could sustain a real growth rate of 3.1% (62.3% ROCE x 5% RR = 3.1% growth rates). And if we also assume a 3% inflation escalator, its notional growth rate would be 6.1%.
- BTI could sustain a real growth rate of 4.6% (91.7% ROCE x 5% RR = 4.6% growth rates). And if we also assume a 3% inflation escalator, its notional growth rate would be 7.6%.
Source: author based on data from Seeking Alpha.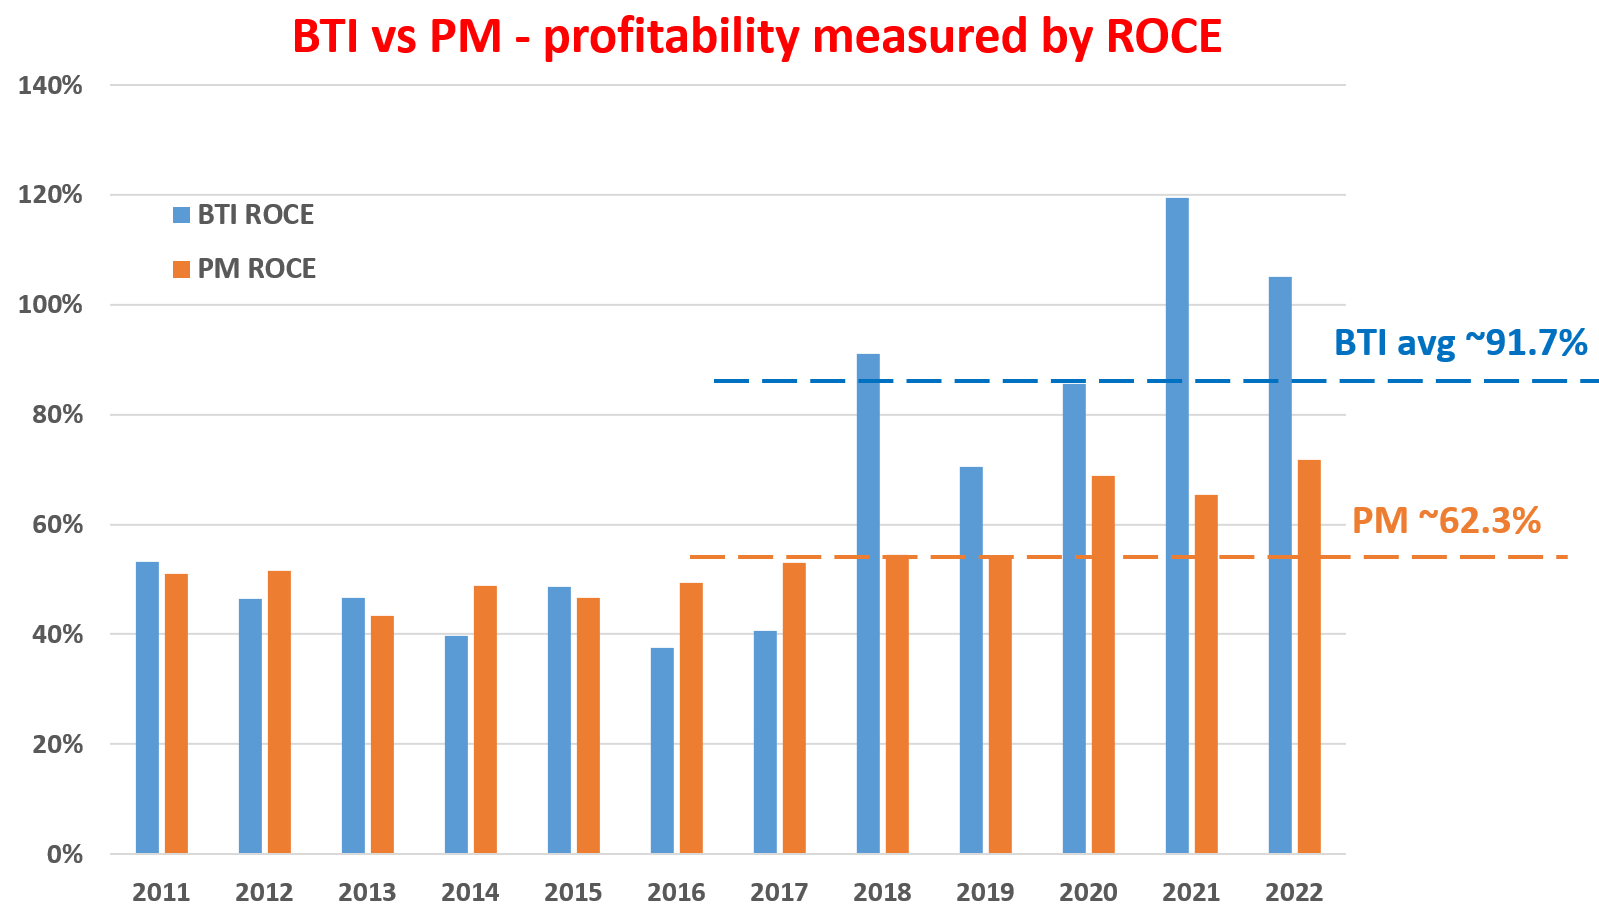
Total return potentials
Onto valuation. Despite their profitability and long-term growth potential, both stocks are quite reasonably valued both in absolute terms and relative terms as seen in the chart below. To wit, PM is priced at 17.1x FW PE, around its historical average. BTI is valued at about 9.3x FW PE, also around its historical average.
Since their current valuations are around their historical mean, let’s assume no change in their PE multiples in our return projection. In this case,
- PM’s current PE multiple provides an owner’s earning yield of 5.84%. Combined with the long-term growth potential of 6.1% projected above, PM is projected to deliver a total annual return of almost 12% (6.1% growth rate plus 5.8% of the owner’s earning yield).
- Similarly, BTI’s current PE multiple provides an owner’s earning yield of ~10%. Combined with the long-term growth potential of 4.6% projected above, it is projected to deliver a total annual return of almost 15% (4.6% growth rate plus ~10% of the owner’s earning yield).
Source: Seeking Alpha data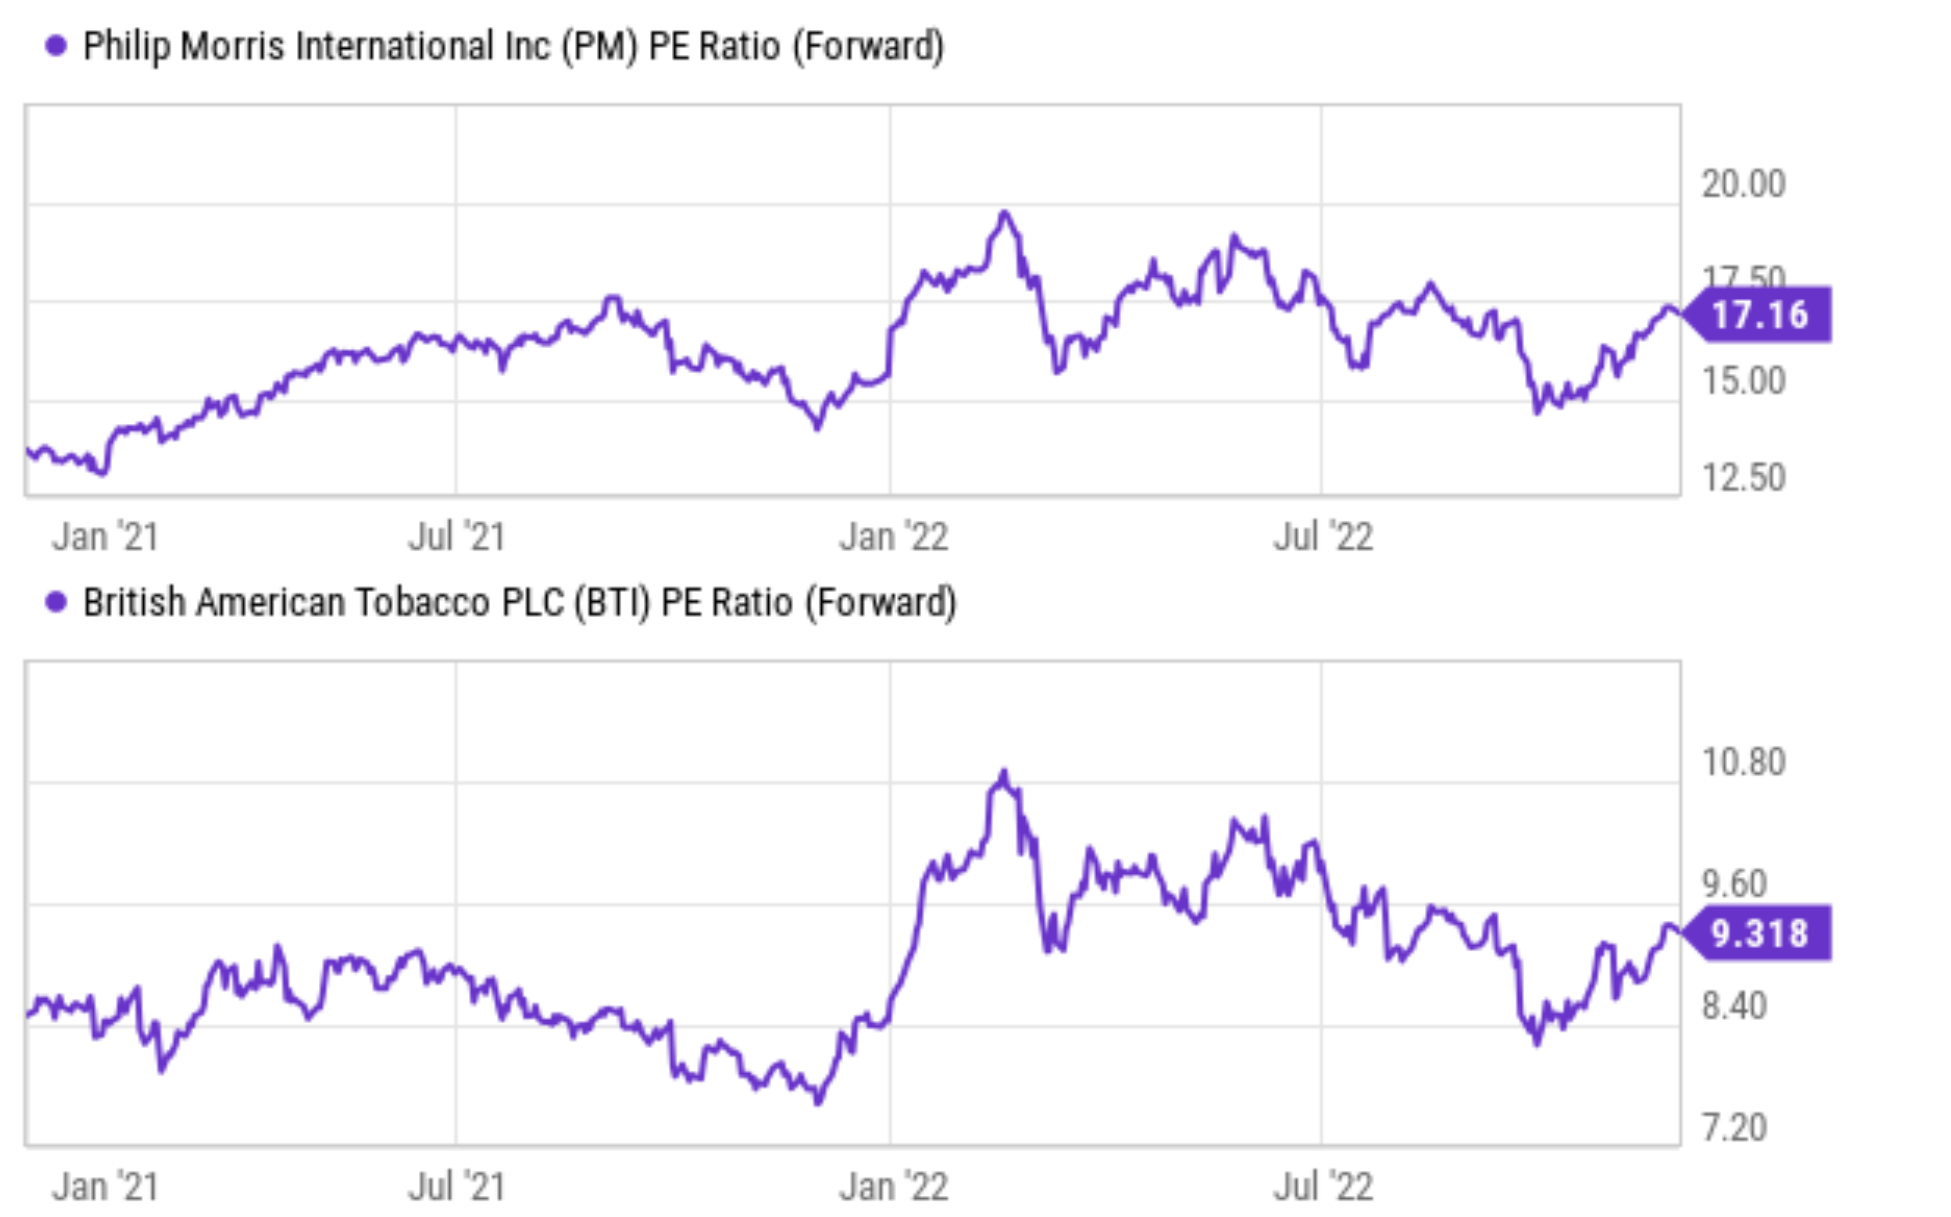
Risks and final thoughts
Both BTI and PM (together with the rest of the tobacco industry) are facing the secular decline of traditional combustible products. They are both investing aggressively in new products (non-combustible products). And both companies have been reporting robust growth in their new categories. But their new categories are still in an earlier stage and contribute only minimally to the total earnings. Both of them are also suffering from global supply chain disruptions. In particular, for PM, the semiconductor shortages have disrupted the production of its iQOS products in recent quarters and such disruptions could persist longer.
To conclude, both PM and BTI are exemplary stocks that fit into the Dalio investing hierarchy. They both provide a hedge against the ongoing macrocycles due to the unique resilience of their products. Both of them are yielding far above their historical averages AND also far above risk-free rates, providing a thick cushion against interest uncertainties. They both provide excellent geographical diversification also, especially for those whose exposures are mainly toward U.S. assets. As international companies, both BTI and PM are less sensitive to currency headwinds (or even could benefit from them). That is one consideration that I own BTI myself instead of Altria (MO). And finally, their combination of remarkable ROCEs, light capital requirements, and very reasonable valuation provide favorable odds for double-digit annual total return potentials.
Be the first to comment