

William_Potter
Investment Thesis
The Invesco Dividend Achievers ETF (NASDAQ:PFM) tracks the performance of 371 U.S. companies that have increased dividends for at least ten consecutive years. This strategy, which rewards stable stocks and excludes speculative ones, has paid off recently, with PFM outperforming the SPDR S&P 500 ETF (SPY) by 7% YTD. However, many other dividend-focused ETFs have done the same, further solidifying the idea that PFM is just an average dividend ETF with a high 0.52% expense ratio. I maintain my hold rating because of its defensive lean but don’t recommend buying it, as there are several other broad-based dividend ETFs that cost less with solid fundamentals.
ETF Overview
PFM tracks the NASDAQ US Broad Dividend Achievers Index, selecting constituents with at least ten years of increasing annual regular dividend payments. The Index is market-cap-weighted, reconstitutes annually in March, rebalances quarterly, and applies a 4% individual security cap for diversification purposes. PFM offers a 2.17% dividend yield, a 6.63% five-year annualized dividend growth rate, and a 0.52% expense ratio. While these metrics aren’t attractive, PFM typically has low turnover, which may be considered favorable for passive investors. Dividend streaks this long rarely end by choice but rather by necessity. As it stands, more companies are added each year rather than subtracted.
The SPDR S&P Dividend ETF (SDY) and the ProShares S&P 500 Dividend Aristocrats ETF (NOBL) are two peers that also value long dividend track records. SDY selects U.S. companies with 20+ years of consecutive dividend increases and weights by yield. NOBL selects large-cap S&P 500 stocks with 25+ years of successive increases and weights its constituents equally. PFM has less strict growth requirements and is market-cap-weighted, but it’s interesting to see how that changes its composition at the sector level, as shown below.
Morningstar
The key differentiator is that PFM is nearly 20% Technology, while SDY and NOBL are about 3-5%. Its next largest sector is Health Care at 16.61%, followed by Consumer Staples (14.31%), Financials (12.96%), and Industrials (11.86%). Note that there’s little exposure to Energy and Utilities, the two hottest sectors this year. SDY has the most Utilities exposure at 14.19%, which explains its superior YTD performance.
Going back to when NOBL launched in October 2013, PFM has gained an annualized 8.74% compared to 9.74% and 9.85% for SDY and NOBL. You may consider it a low-volatility ETF, given how its 12.63% annual standard deviation is close to what funds like the Invesco S&P 500 Low Volatility ETF (SPLV) experienced over the same period (11.99%).
Portfolio Visualizer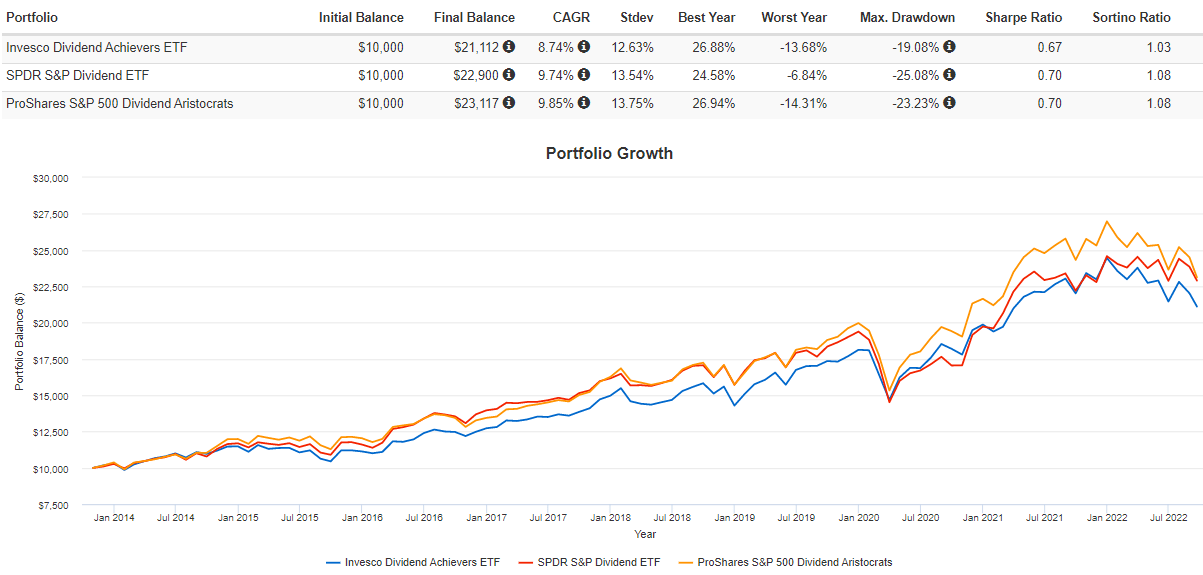
I’m highlighting PFM’s low-volatility features because it has the best “worst” six-month return period out of any large-cap value or dividend ETF in the last ten years (excluding those with insufficient history). Unfortunately, its ten-year returns are only 20th best out of the 28 ETF sample, and its best six-month period ranks dead last. In short, PFM mirrors how low-volatility ETFs typically perform. They do great on the downside but underperform on the way up.
The Sunday Investor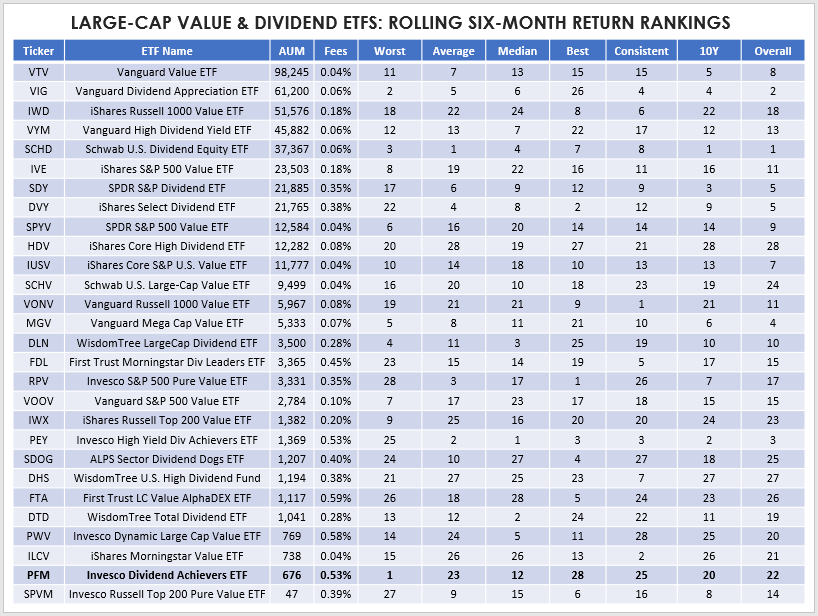
ETF Analysis
Top Ten Holdings
PFM’s top ten holdings are listed below. Led by Microsoft (MSFT), UnitedHealth Group (UNH), and Johnson & Johnson, these stocks total 25.55%. In terms of diversification at the company level, it’s excellent. However, as I recently pointed out in an article on the Vanguard Dividend Appreciation ETF (VIG), concentration becomes less of an issue as you add more ETFs to your portfolio. And, if done in an efficient way that minimizes overlap, it’s not much of a benefit or a concern.
Invesco
Industry and Holdings Snapshot
We can zoom out by looking at PFM’s top 25 industries and the top three holdings within each. The following table shows that Data Processing & Outsourced Services stocks like Visa (V) and Mastercard (MA) form one-quarter of PFM’s 20% Technology exposure. Systems Software (5.05%) and Semiconductors (4.01%) represent most of the remainder.
The Sunday Investor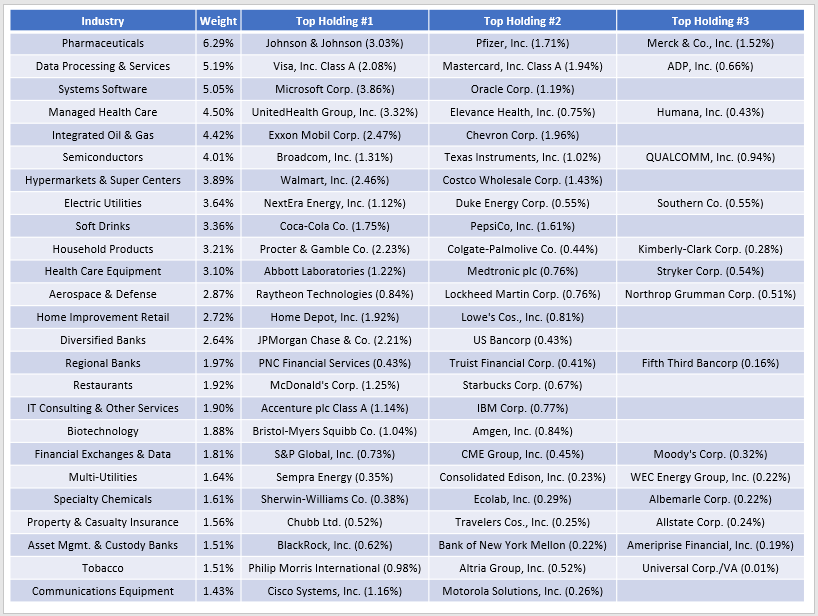
Low-beta Pharmaceuticals stocks like Johnson & Johnson (JNJ) and Pfizer (PFE) are prominent in Health Care. Also, 60/64 S&P 500 Dividend Aristocrats are included, totaling 33% of the weight. AbbVie (ABBV), Linde (LIN), Pentair (PNR), and Amcor (AMCR) are the four exclusions.
Industry Fundamentals vs. SDY and NOBL
The following table highlights size, volatility, growth, dividend, and valuation metrics for PFM’s top 25 industries. I think this view helps differentiate it from SDY and NOBL, and the results look positive in many cases.
The Sunday Investor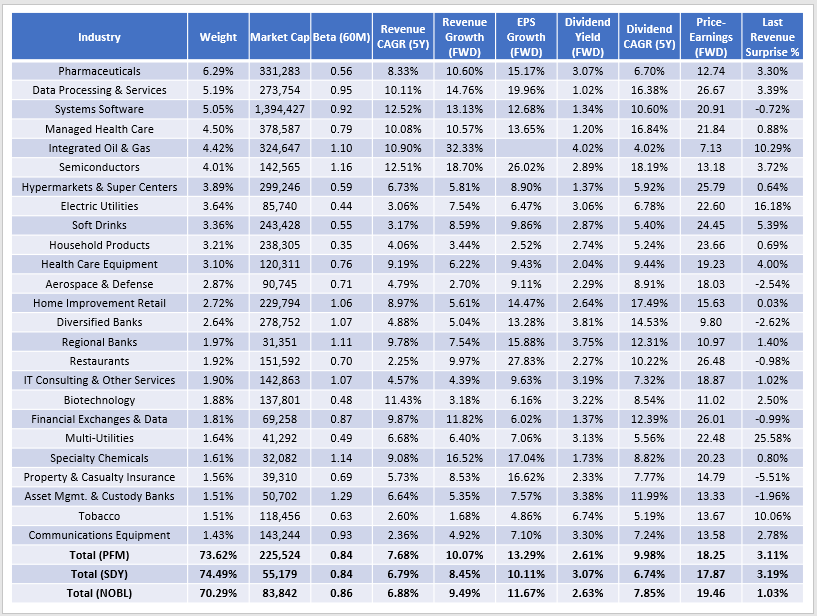
PFM’s market-cap-weighting scheme means its weighted-average market capitalization is substantially higher than SDY and NOBL ($225 vs. $55 vs. $83 billion). As a result, quality is relatively high. If we were to take Seeking Alpha’s Profitability Grades and normalize them on a scale of 1-10, PFM would score 9.27 against 7.51 and 8.43 for SDY and NOBL. Generally, this is true for most market-cap-weighted ETFs, and perhaps why they often outperform.
All three ETFs have similar volatility relative to the market, as measured by their five-year betas. In the dividend ETF space, this is pretty low. Most of the better-performing ones are in the 0.90-1.00 range, but they’re at greater risk in a prolonged downturn. Investors can seek some stability with these consistent dividend raisers.
PFM’s standout metrics include revenue, earnings, and dividend growth, which are 1-3% points higher than SDY and NOBL. Its constituents’ five-year dividend growth rate of 9.98% is average for the category but notably much better than the two listed peers. We also see that PFM trades at 18.25x forward earnings, 1.21x lower than NOBL. PFM’s gross dividend yield of 2.61% looks solid. However, you need to account for the high 0.52% expense ratio. SDY and NOBL are slightly better at 0.35%, but they are especially harmful to dividend investors. Out of 64 dividend ETFs, PFM’s fees are the ninth highest.
Finally, PFM’s 3.11% last quarter sales surprise figure is impressive, especially considering how there’s strength in multiple areas, including Pharmaceuticals, Data Processing & Outsourced Services, Integrated Oil & Gas, and Electric & Multi-Utilities. I think it’s the most attractive of the three, but that doesn’t mean you should jump on it. VYM, DLN, and SPHD are three other ETFs doing relatively well YTD, as SDY outperforms due to its high Utilities exposure.
Seeking Alpha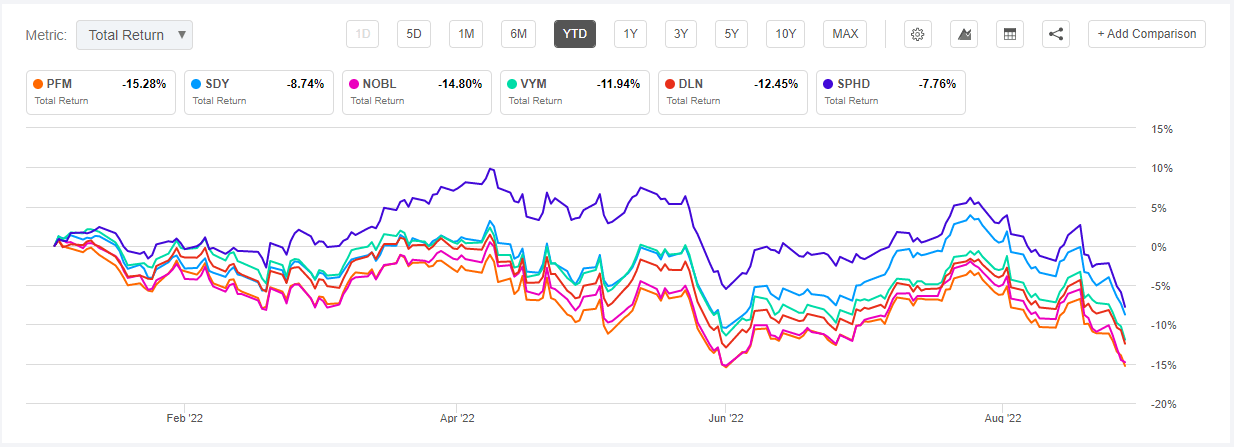
Investment Recommendation
If the dividend ETF space weren’t so crowded, I’d probably give PFM a better review. Its fundamentals look relatively strong compared to SDY and NOBL, but many other options are available. The 0.52% expense ratio is what ultimately sinks it for me. These fees reduce what otherwise would be a decent yield and can wipe away 8-10% of your total gains if held for ten years. Instead, I encourage dividend investors to consider other ETFs like VYM, SCHD, CDC, DGRO, and DGRW, which are also doing well against the broader market. Thank you for reading, and I look forward to discussing this further in the comments section below.
Be the first to comment