


NicoElNino
Thesis
Recent market corrections, both the equity market and bond market, have brought many ETFs into attractive valuations. And this article will focus on dividend ETFs for income-oriented investors: the Invesco High Yield Equity Dividend Achievers ETF (NASDAQ:PEY) and also the Vanguard High Dividend Yield ETF (NYSEARCA:VYM).
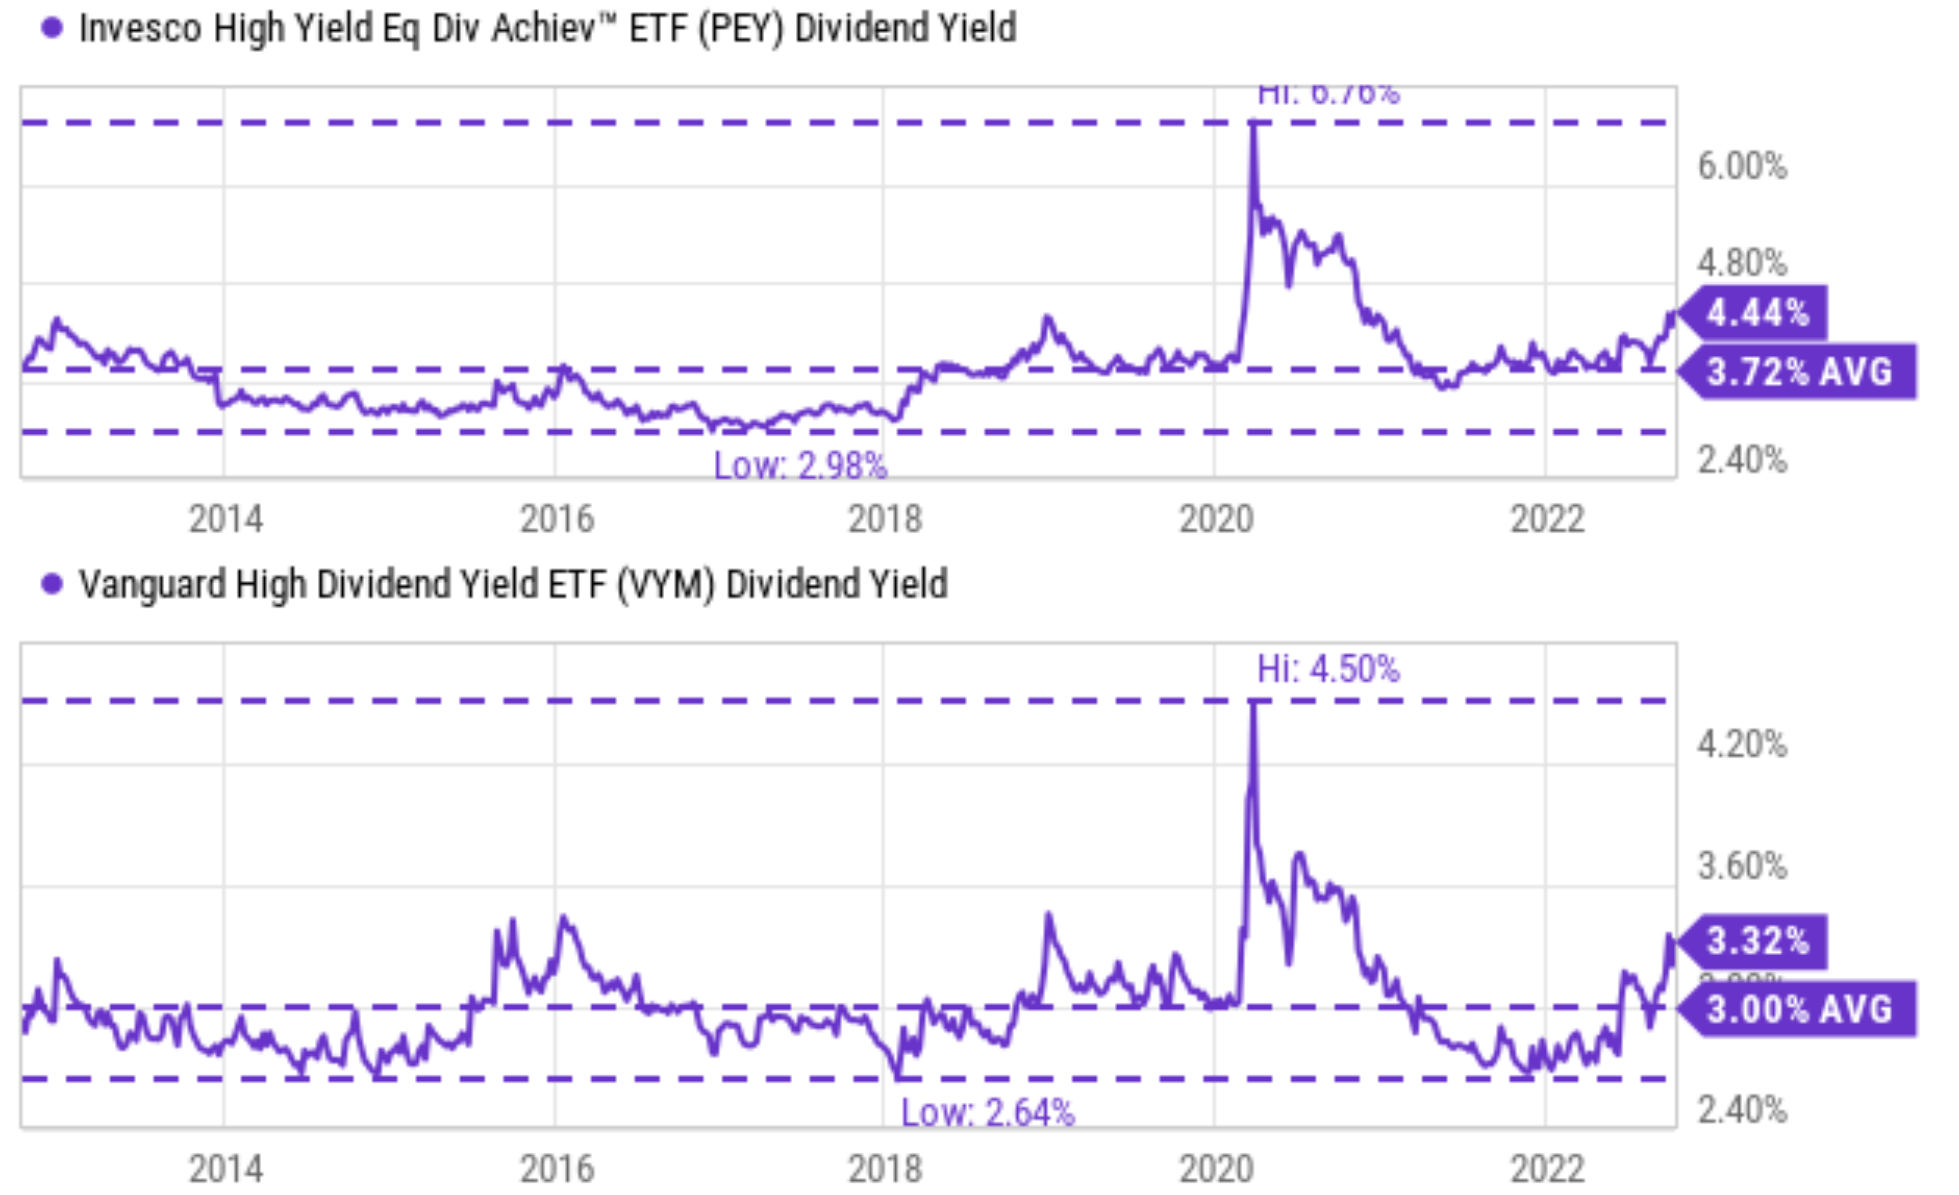
Both ETFs seek high yields and high current income. And as you can see from the following chart, both of them are indeed providing attractive dividend yields, both in absolute and relative terms. PEY is yielding 4.44% currently, and VYM is yielding 3.32%. Both yields are substantially higher than the S&P 500 index (about 1.8% as of this writing) and compete favorably against treasury bond rates too (about 3.8% for 10-year treasury bonds).
Source: Seeking Alpha data
More importantly, you can see that their current yields are substantially above their historical averages. They are actually near the peak level in a decade if you exclude the outlier data points during the COVID fire sale. In the past 10 years, the average yield from PEY is 3.72% and 3.00% from VYM. Thus, for PEY, its current yield of 4.44% is about 19.3% above its historical average, signaling a sizable valuation discount. VYM’s current yield is about 10.6% above its historic average, again also signaling a 10% valuation discount.
Although in the remainder of this article, you will see a few reasons why I favor VYM over PEY despite PEY’s higher current yield and larger discount in terms of its dividend yields. In brief, these considerations include:
- I anticipate PEY’s higher expense ratios to keep creating a fee headwind.
- I anticipate PEY’s higher tax attrition to keep creating a tax headwind.
- And finally, I also anticipate PEY’s indexing method to keep creating higher volatility risks.
PEY and VYM: Basic information
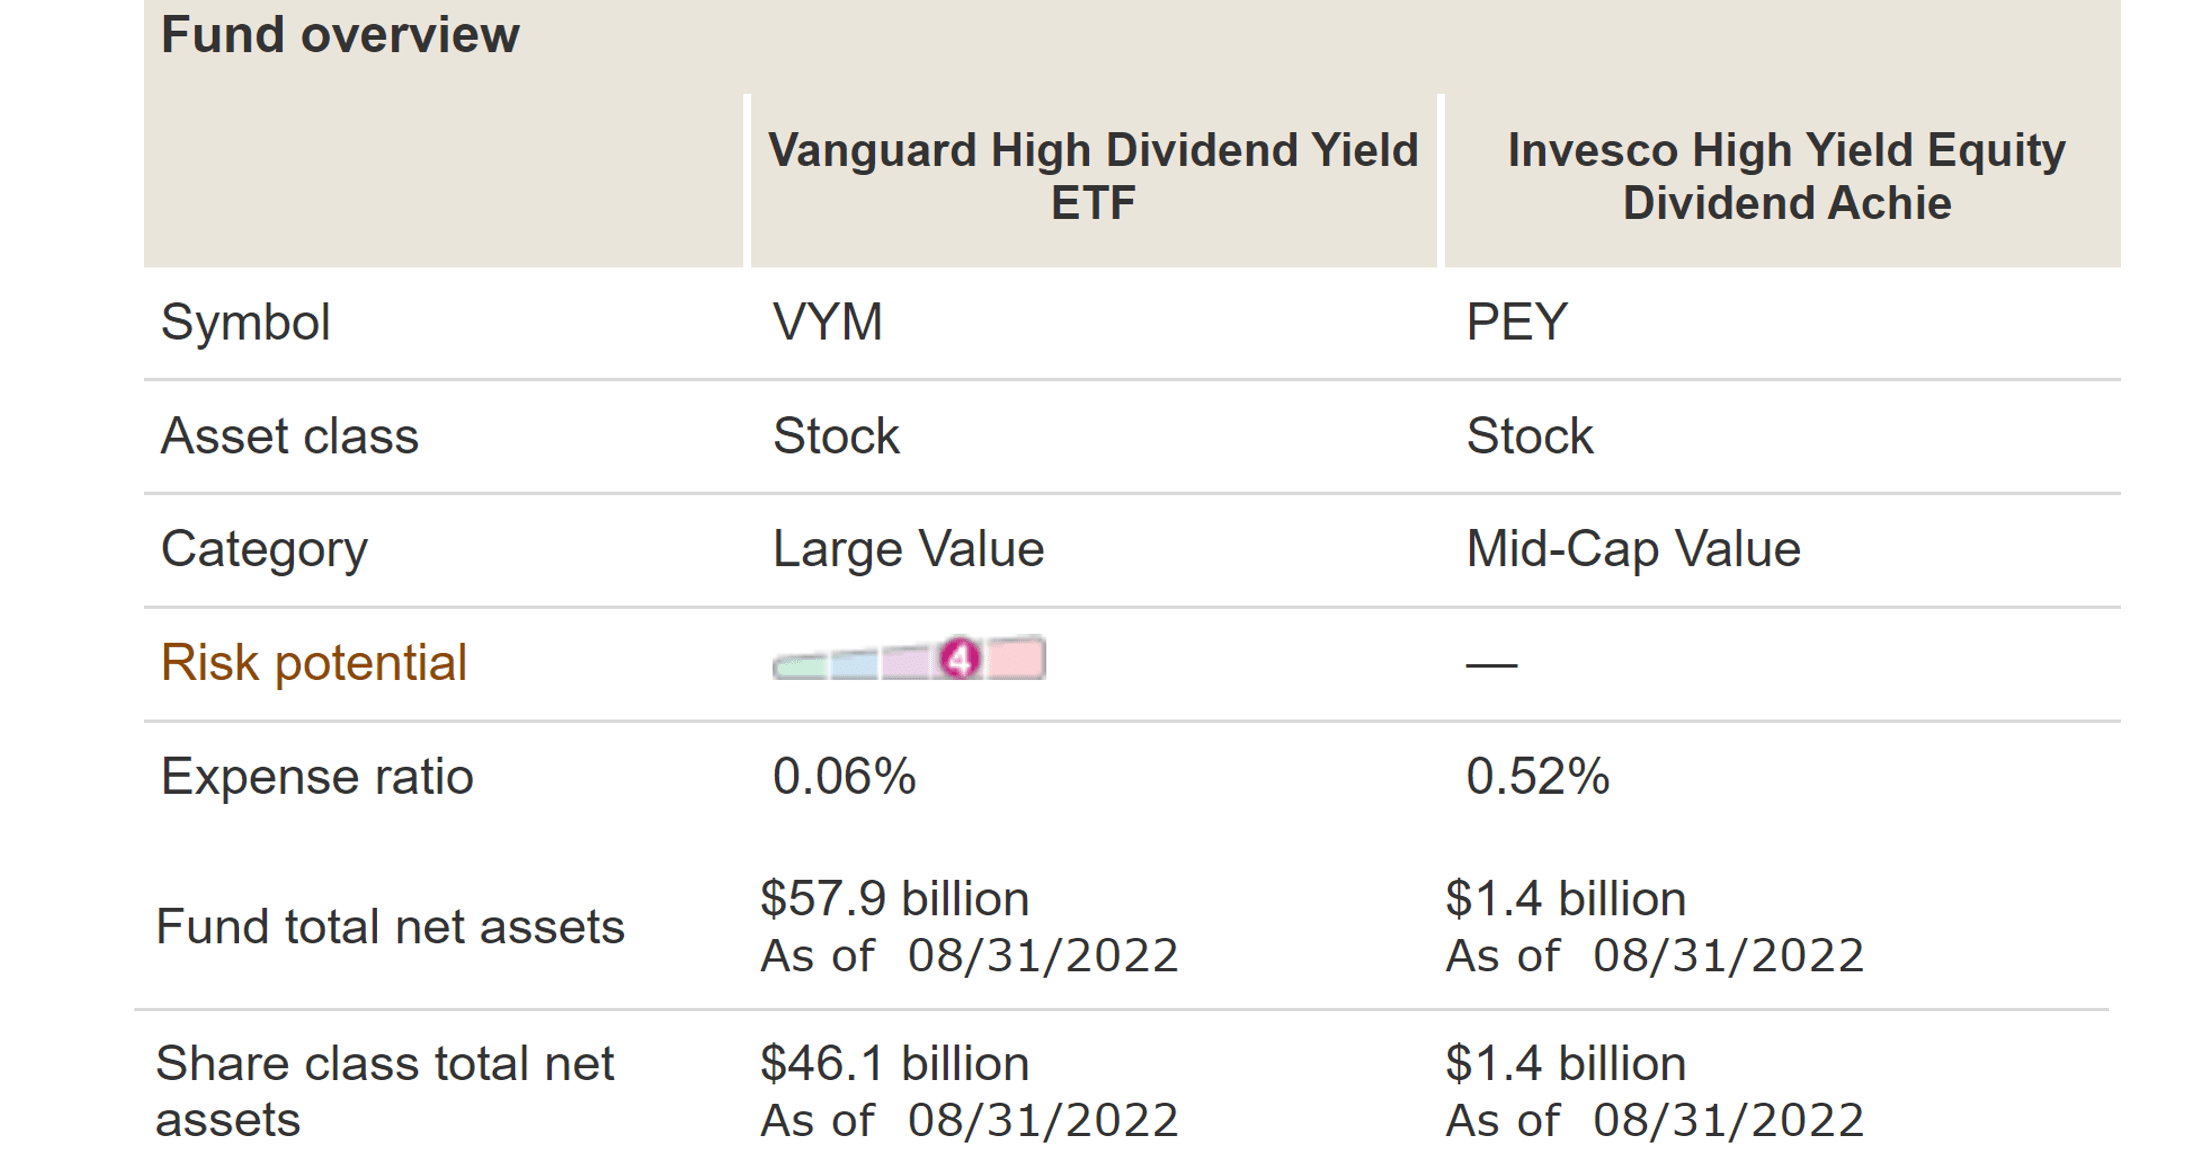
Just in case some readers are not familiar with these funds yet, the following chart shows an overview of their basic information. VYM is a much larger fund with $57.9 billion in total net assets, compared to $1.4 billion from PEY. Although VYM’s told fund assets include mutual funds and the ETF share class total net assets is $46.1 billion, still much larger than PEY. In terms of expenses, VYM charges a lower expense ratio of 0.06% and PEY charges a slightly higher expense ratio of 0.52%. Do not overlook these seemingly small fees. As we will see, they (especially in the case of PEY) are not that small when put under the proper context.
Source: Vanguard data
Although both funds emphasize dividend yield, their approaches are different because of the underlying indexing method. Their indexing methods are detailed in their fund descriptions quoted below. And the emphases were added by me. In the subsequent discussion, we will elaborate on the implications of the differences in their indexing method.
PEY fund description: PEY is based on the NASDAQ US Dividend Achievers™ 50 Index. The Fund will normally invest at least 90% of its total assets in dividend paying common stocks that comprise the Index. The Index is comprised of 50 stocks selected principally on the basis of dividend yield and consistent growth in dividends. The Fund and the Index are reconstituted annually in March and rebalanced quarterly in March, June, September and December.
VYM fund description: VYM seeks to track the performance of the FTSE® High Dividend Yield Index, which measures the investment return of common stocks of companies characterized by high dividend yields. It provides a convenient way to track the performance of stocks that are forecasted to have above-average dividend yields.
Past performance comparison
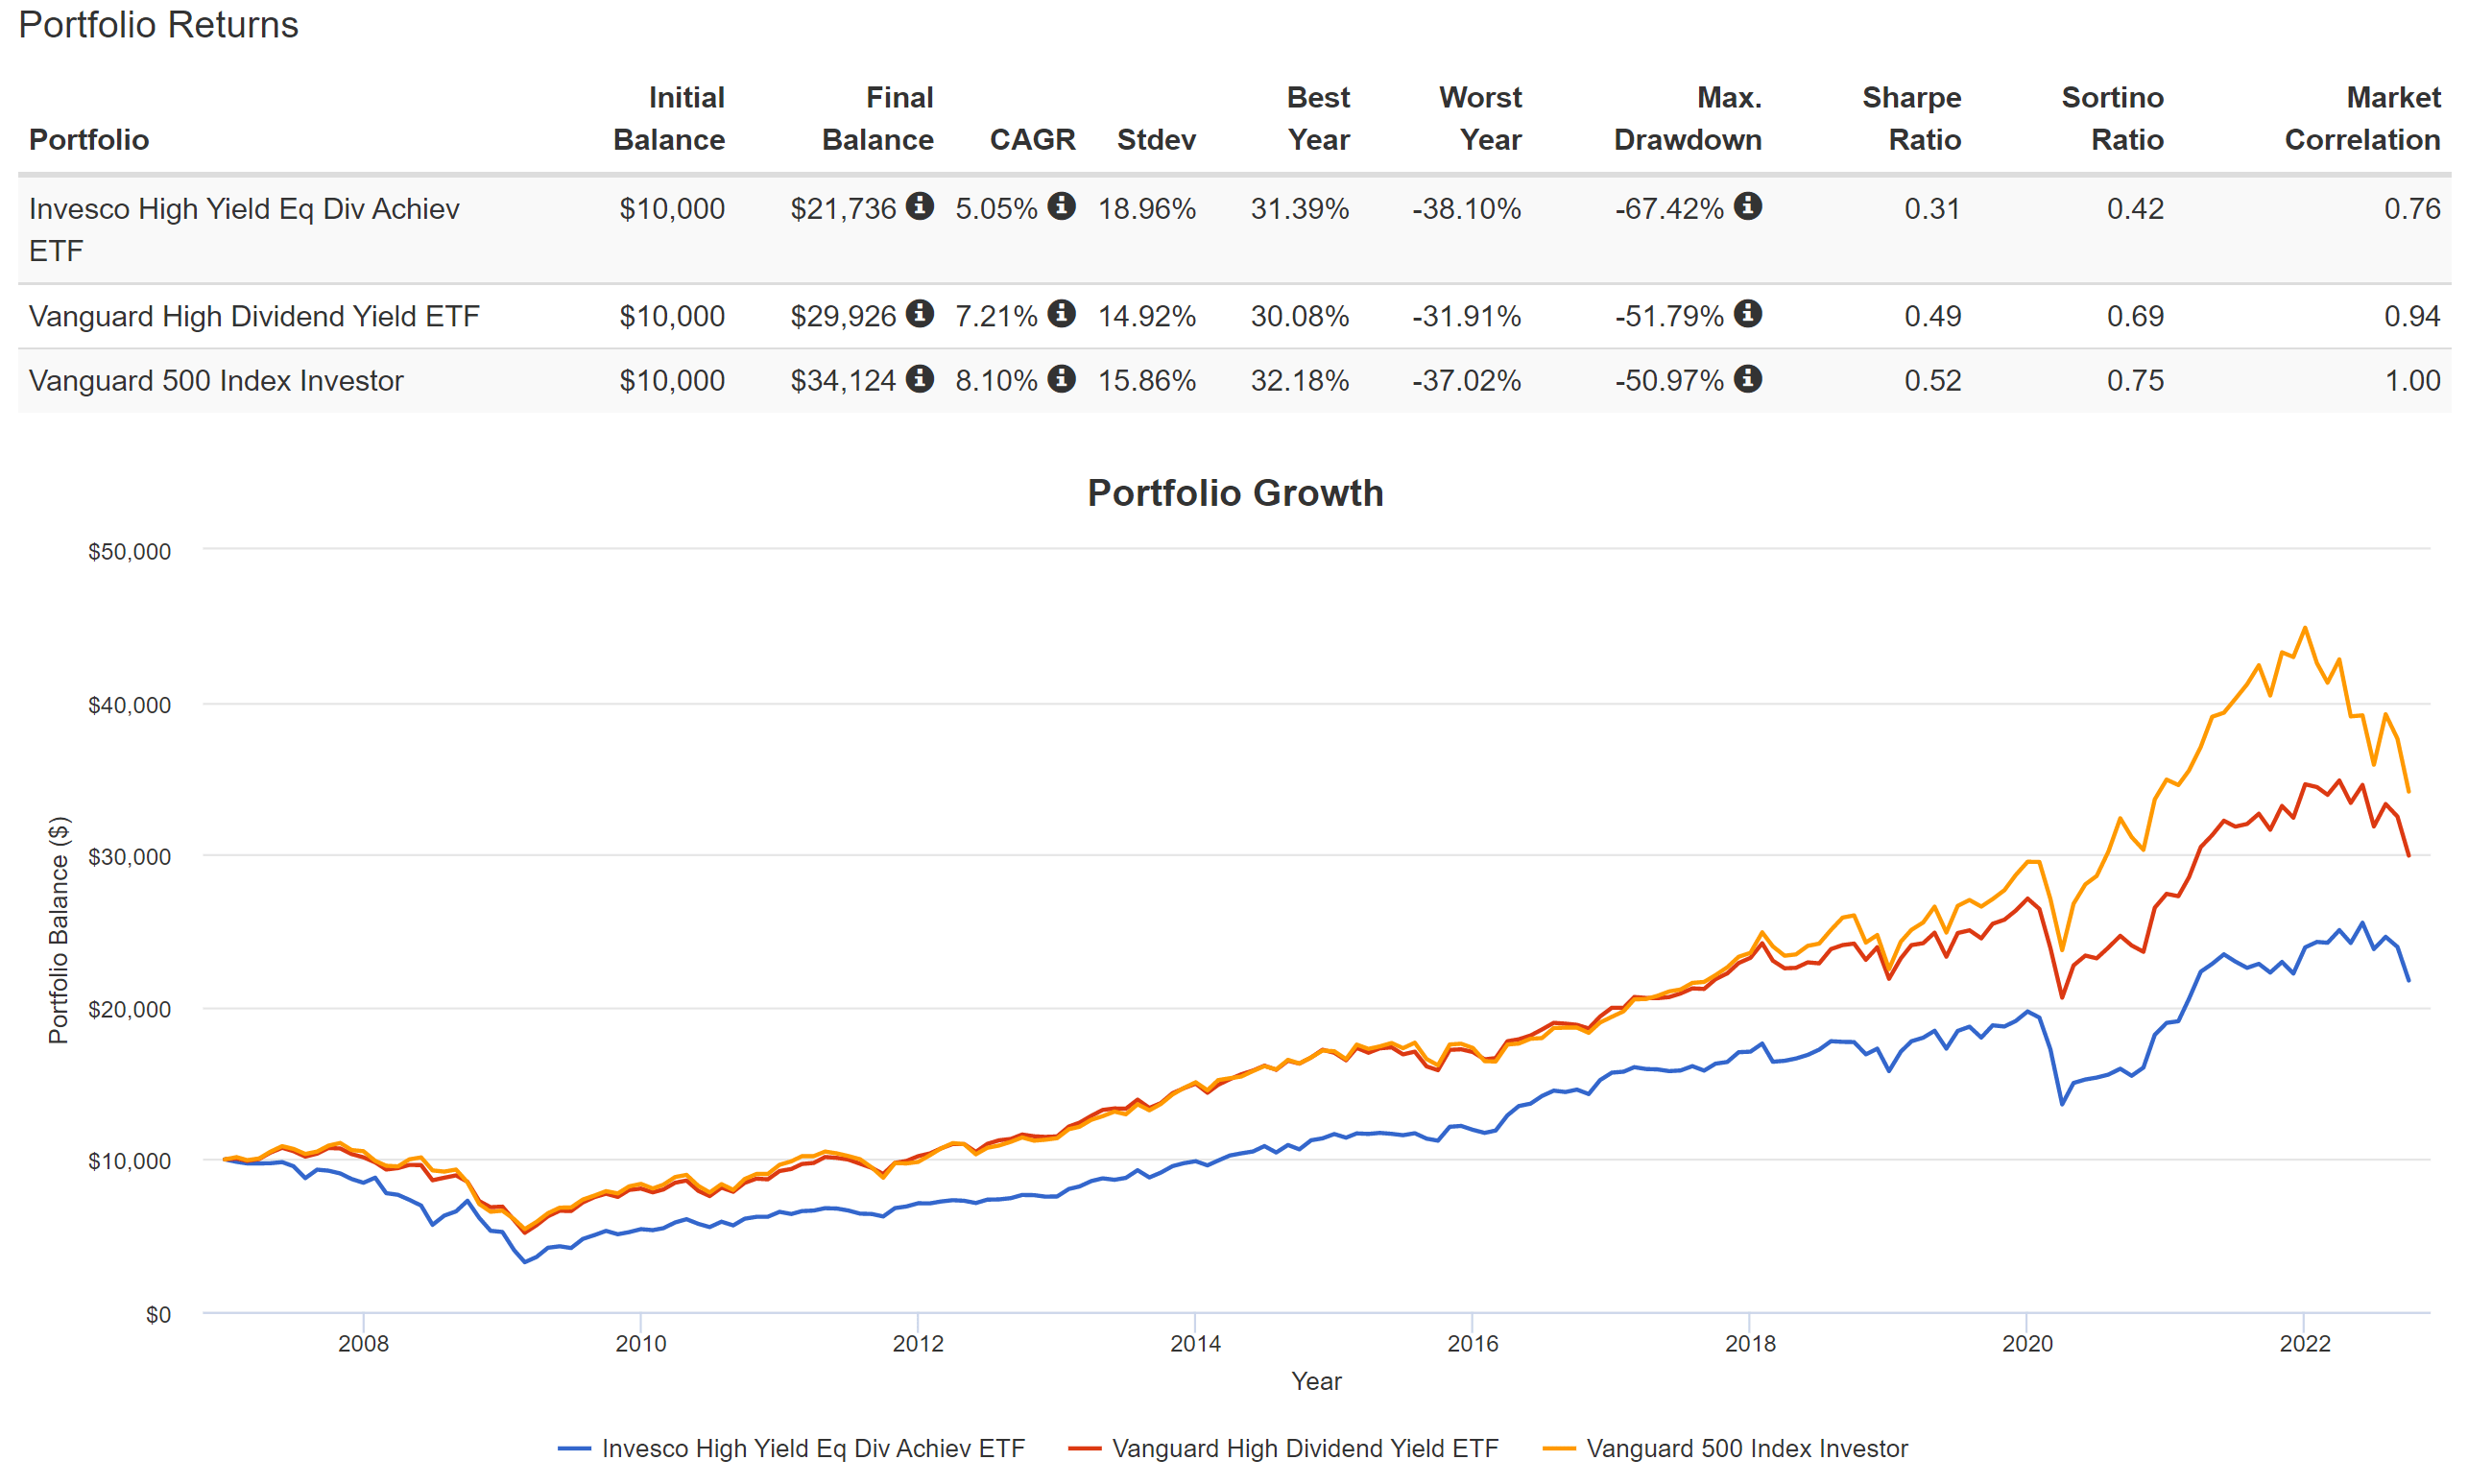
Both the PEY and VYM funds have delivered healthy returns in the past (since VYM’s inception in Nov 2006) as you can see from the chart below. PEY was launched even earlier, in Dec 2004. However, with a 7.21% CAGR, VYM has delivered superior performance. Compared to PEY’s 5.05% CAGR, the alpha is more than 210 basis points per year. When compounded over the years, such an alpha has accumulated into a sizable difference of more than 82% in total return (299% vs 217%).
Also, note that VYM has suffered lower volatilities at the same time due to the difference in their indexing methods (more on this later). In terms of standard deviation, VYM’s volatility has been on average 14.9%, 4% lower than the 18.9% from PEY. In terms of worst-year performance, the difference was a sizable 6.2% (VYM’s 31.9% vs PEY’s 38.1%). And in terms of maximum drawdowns, the comparison is really dramatic here: VYM’s 51.8% worst drawdown is lower than PEY’s 67.4% by more than 15%.
Going forward, I see the above trend as very likely to continue in the future. That is, I see good odds for VYM to keep leading PEY both in terms of higher returns and also lower volatility risks for reasons to be detailed next.
Source: Portfolio Visualizer
Indexing method and concentration risks
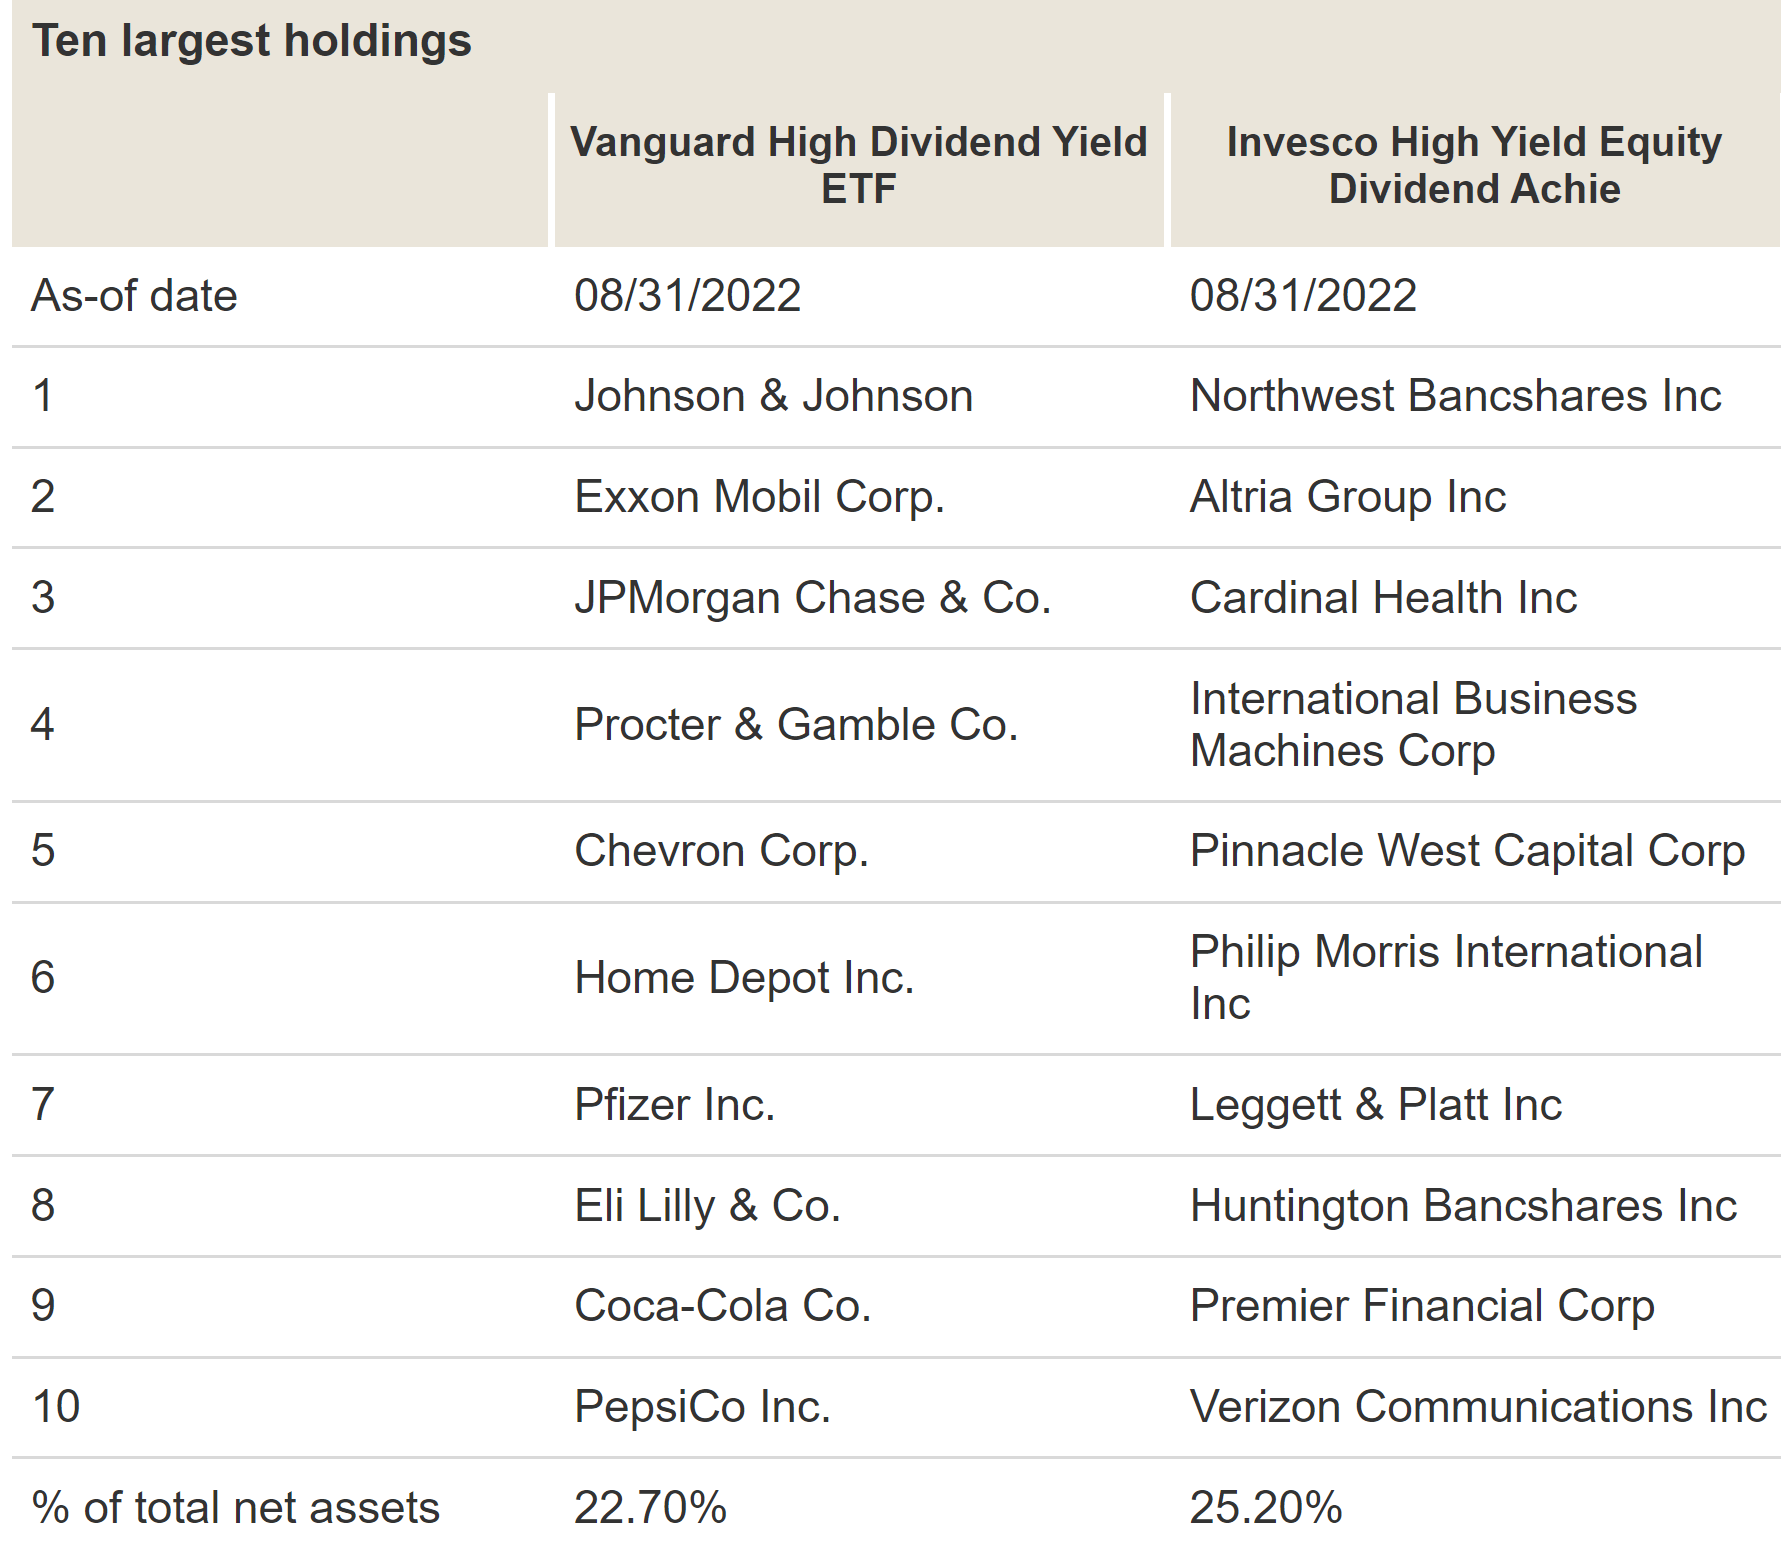
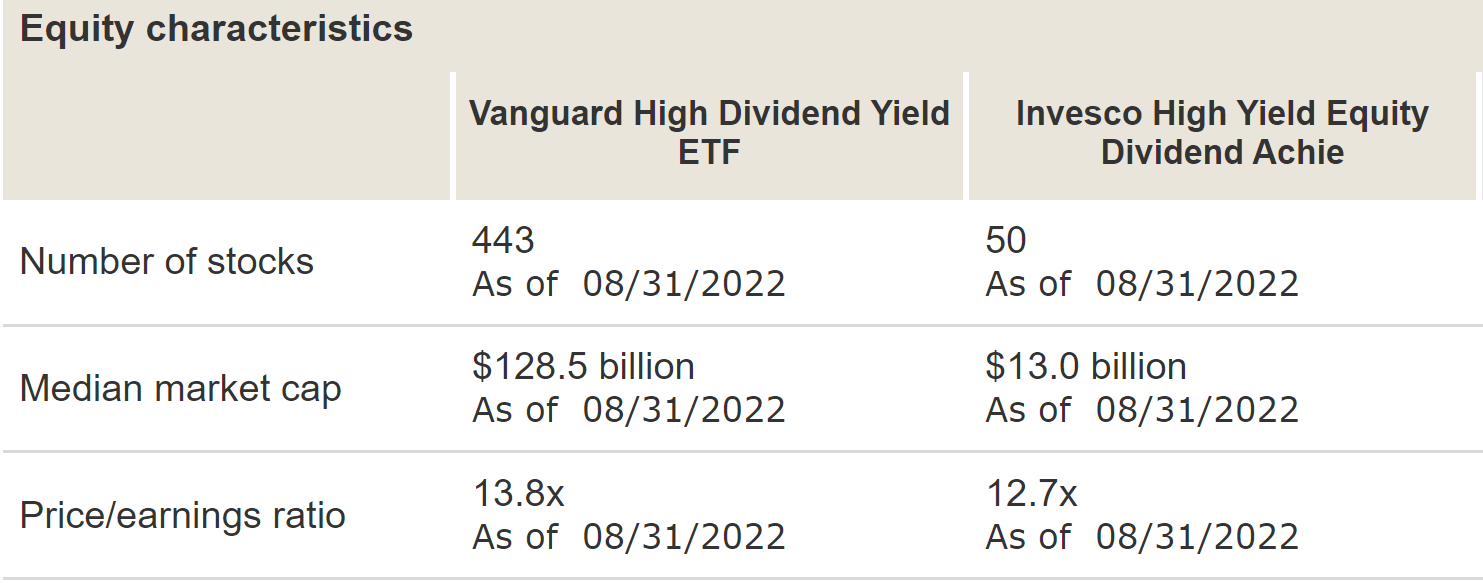
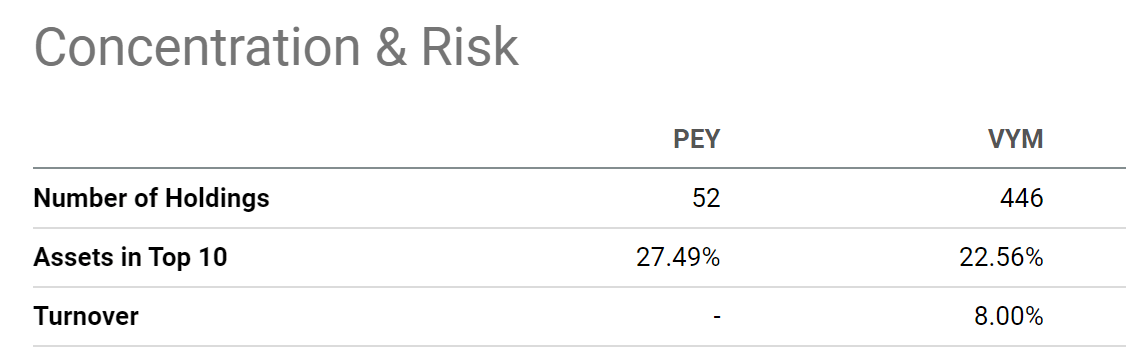
The fundamental reason for my above forecast lies in the differences in their indexing methods. Both funds are indexed by market capitalization, and as a result, both are equally top-heavy. Their top 10 holdings are listed below, and they represent more than 22.7% of the total net asset for VYM and 25.2% for PEY as you can see from the first chart below. However, VYM holds a total of 443 stocks while PEY only has 50 stocks as you can see from the second chart below. So as a result, for the remainder of their assets, VYM is much better diversified.
More importantly, VYM is more tilted toward large-cap and more prominent companies as you can see from the contrast in their top 10 holdings. PEY’s top holdings such as Northwest Bancshares Inc and Altria Group Inc are all admittedly mature and safe investors. However, they are not comparable to the blue chips that VYM holds such as Johnson & Johnson, Exxon Mobil Corp, or JPMorgan Chase in terms of financial strength and safety. All told, the median market cap for VYM’s holdings is $128.5 billion, about 10x larger than PYE’s $13.0 billion.
Despite such a stark contrast in the quality of their holdings, VYM and PEY are currently valued at about the same PE multiples. VYM is priced at 13.8x PE, only about 8% above PEY’s 12.7x.
Source: Vanguard data
Source: Vanguard data
Other risks and final thoughts
Besides the risks mentioned above, investors should also pay attention to tax issues. VYM features a relatively low turnover rate of 8% as seen in the chart below. PEY does not provide its turnover rate data. But judging by its after-tax returns and its indexing methods, it should have higher turnover rates and therefore suffers strong tax headwinds.
Source: Seeking Alpha data
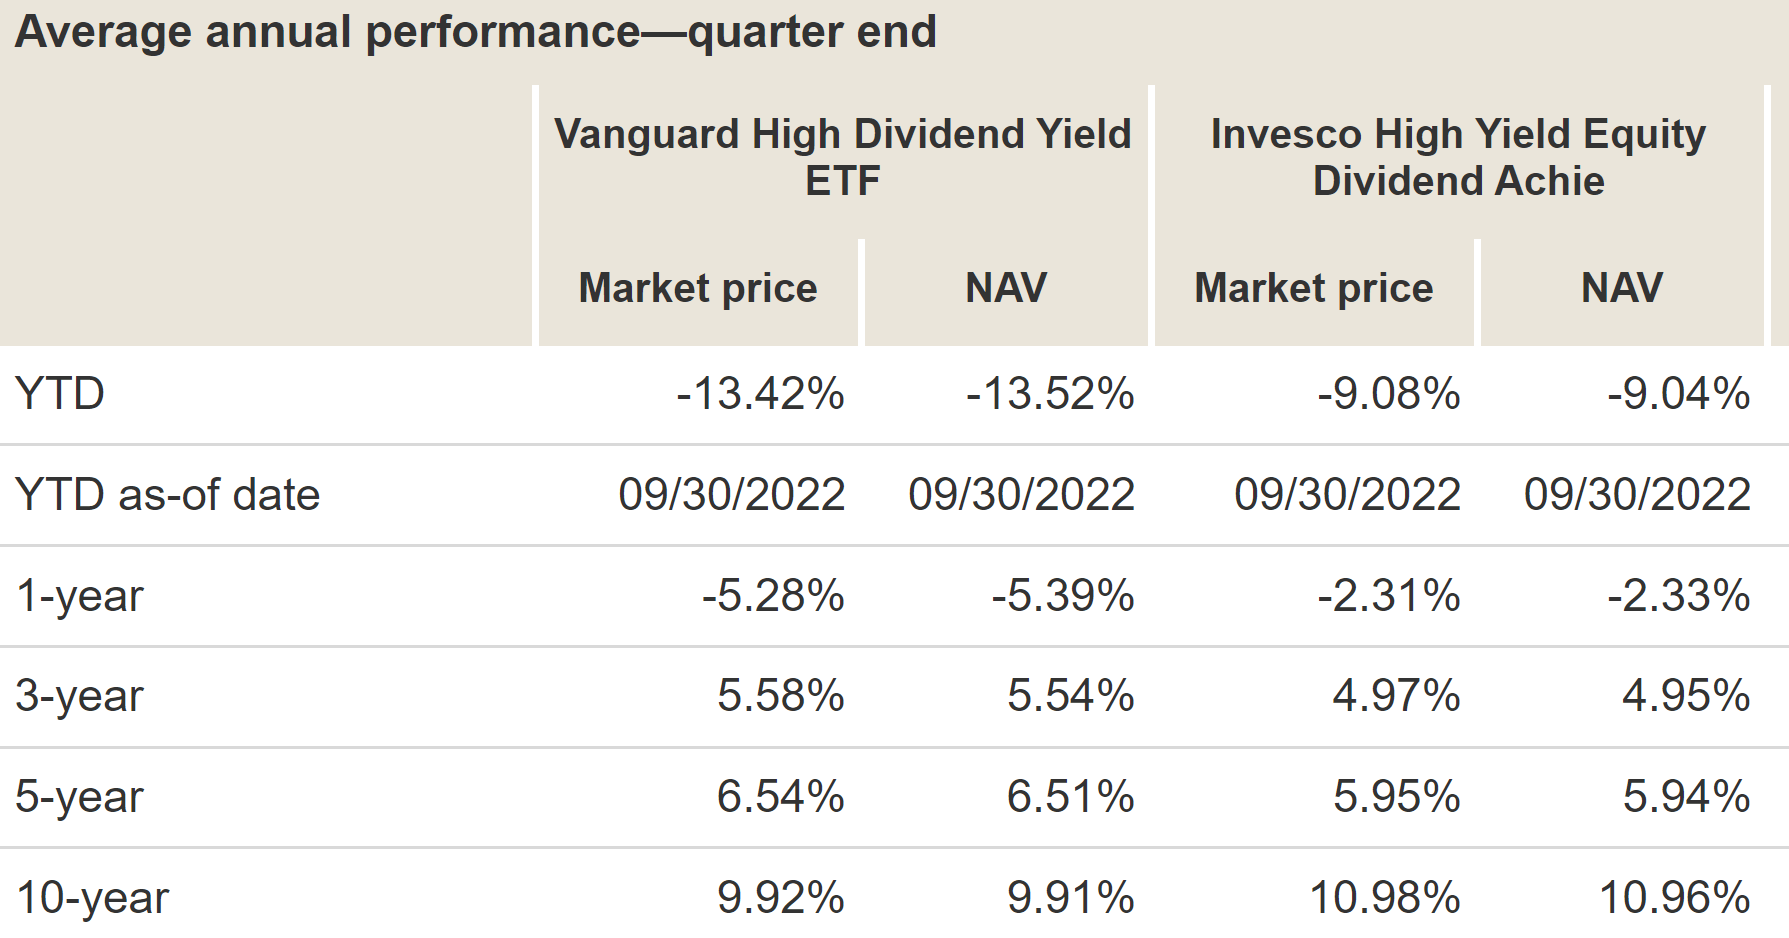
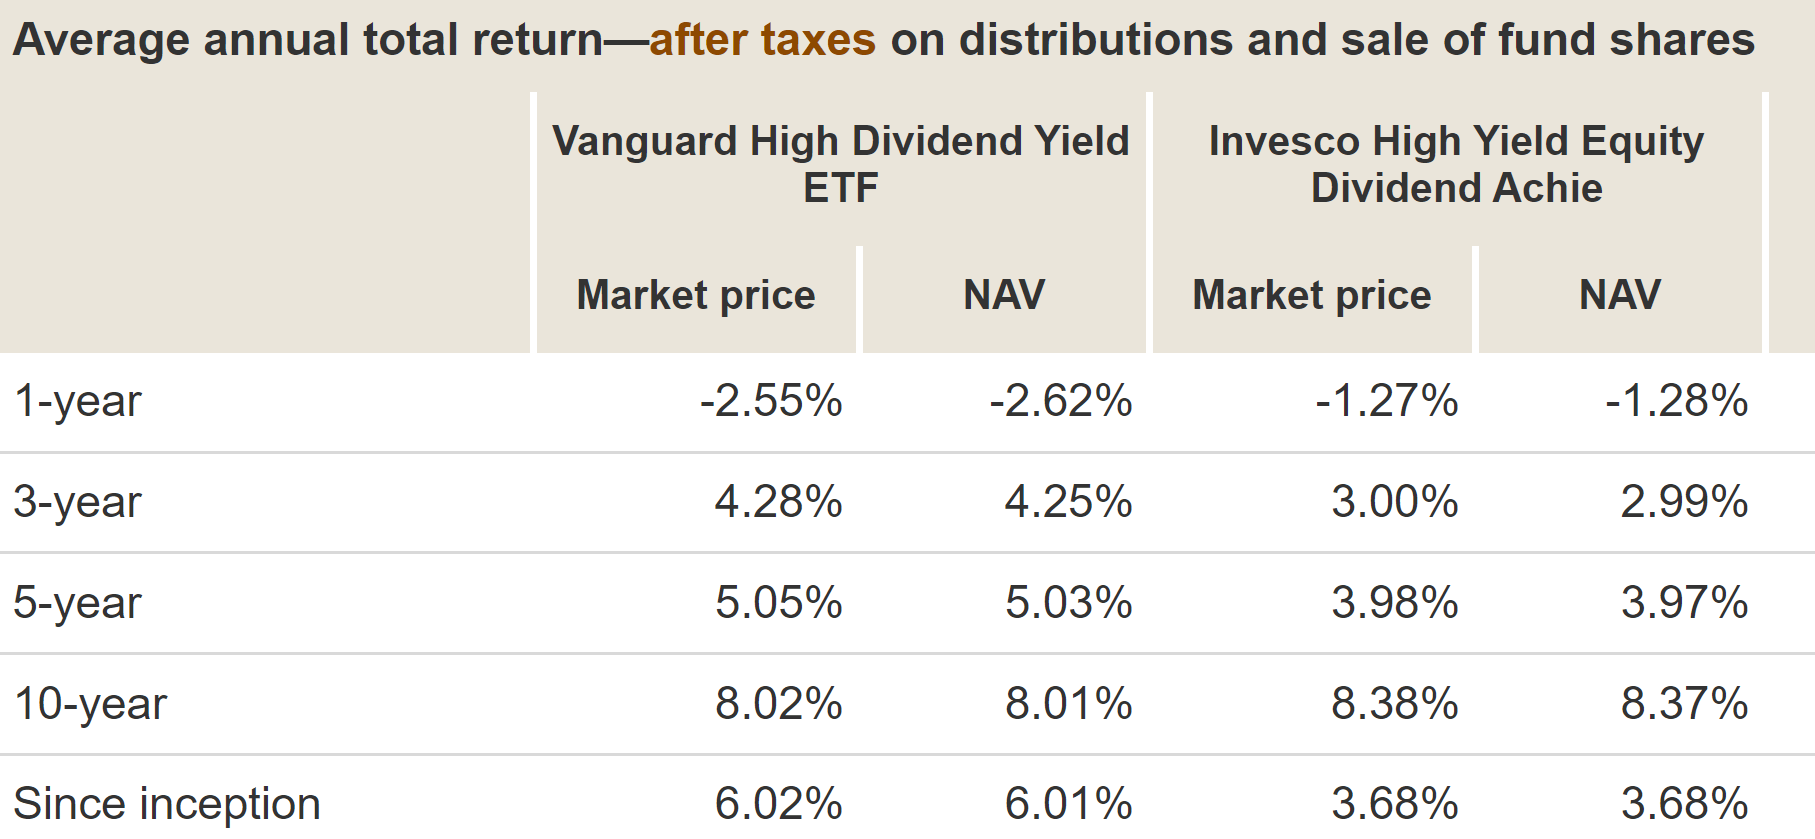
As aforementioned, PEY’s underlying index is reconstituted annually in March and rebalanced quarterly. In terms of tax consequences, the first table below compares the pre-tax return from VYM and PEY over the past decade. As you can see from the following chart, PEY outperformed VYM on a 10-year basis by about 1% in terms of NVA (1.05% to be exact). However, a large part of this outperformance was canceled off by the tax headwinds as you can see from the second chart below. PEY’s average annual total return, after taxes on distributions and sale of fund shares, came in at 8.37%, now only leading VYM’s 8.01% by about 0.36% in the past 10 years.
Finally, let’s put the fees we mentioned earlier into perspective. As aforementioned, VYM charges a lower expense ratio of 0.06% and PEY charges a higher expense ratio of 0.52%. Compared to their average after-tax return of ~8% in the past 10 years, VYM’s fee is about 0.75% of the after-tax return (not zero but close enough). But PEY’s fee is about 6.5% of its average after-tax returns: a sizable portion.
To conclude, recent market corrections presented some interesting dividend ETF opportunities for income-oriented investors. Currently, both PEY and VYM are attractively valued. Both are yielding at a level close to the peak level in a decade (excluding the periods during the COVID fire sale). Although I favor VYM over PEY despite PEY’s higher current yield and larger discount. The key considerations are PEY’s higher fees, higher tax headwinds, and higher volatility risks caused by its indexing method.
Source: Vanguard data
Source: Vanguard data
Be the first to comment