

burwellphotography/E+ via Getty Images
Investment Thesis
PepsiCo, Inc. (NASDAQ:PEP) remains a stellar defensive play for the bearish stock market, given its strong uptrend with an 821.60% stock price appreciation over the past three decades.
PEP 30Y Stock Price
PEP 30Y Stock Price (Seeking Alpha)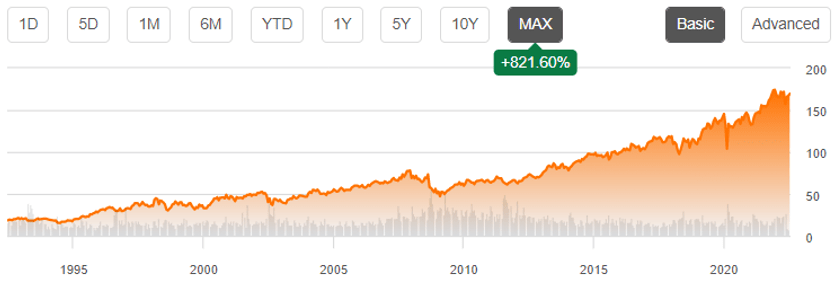
In addition, PEP continues to report exemplary revenue and net income growth in the past two years, with the projected 79% boost in sales post-reopening cadence, compared to pre-pandemic levels. Nonetheless, investors should be well advised of the potential temporary headwinds in the form of inflation, the Fed’s hike on interest rates, and recession moving forward. Therefore, we may expect to see a decoupling of the company’s financial and stock performance in the short and intermediate term, as witnessed in 2008.
PEP Has Had Impressive Growth In The Past Two Years
PEP Revenue, Net Income, Net Income Margin, and Gross Margin (S&P Capital IQ)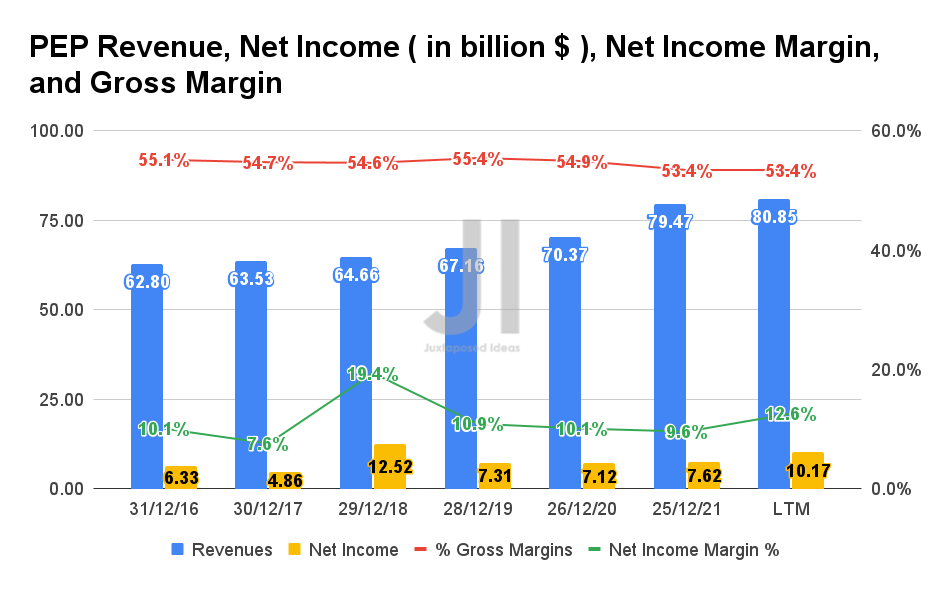
Prior to the pandemic, PEP reported revenue growth at a CAGR of 2.26%. As one of the “staple products” in the market, it is evident that the company has had excellent sales in the past two years, while recording an impressive revenue CAGR of 8.78% at the same time. In the LTM alone, PEP reported remarkable revenues of $80.85B and gross margins of 53.4%, representing a tremendous sales increase of 20.3% from FY2019 levels. Therefore, it is evident that the pandemic has brought forward its revenue growth by easily three years, if not more.
In addition, PEP reported impressive net incomes of $10.17B and net income margins of 12.6% in the LTM, representing an increase of 39.1% and 1.7 percentage points from FY2019 levels. Assuming that PEP is able to sustain its excellent sales moving forward, we expect to see improved bottom-line profitability as well, thereby potentially boosting and/or holding its stock price performance steady over time.
PEP Operating Expense (S&P Capital IQ)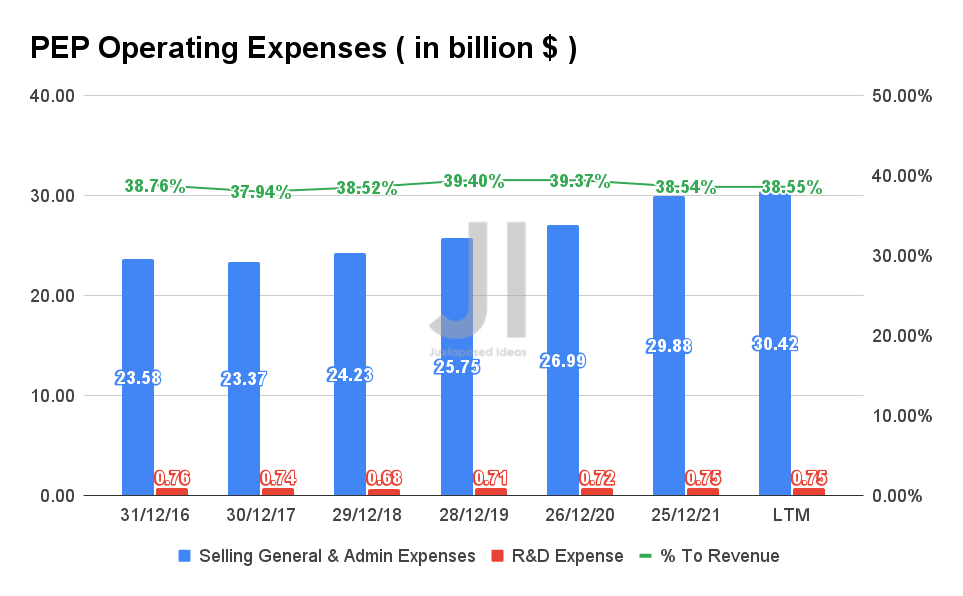
By the LTM, PEP reported operating expenses of $31.17B, representing an increase of 17.8% from FY2019 levels, with a relatively stable ratio to its growing revenues of 38.55% at the same time. Given its obviously improving net income profitability, it is evident that the company has been relatively prudent in its operating expenses in the past few years.
PEP Cash/ Equivalents, FCF, and FCF Margins (S&P Capital IQ)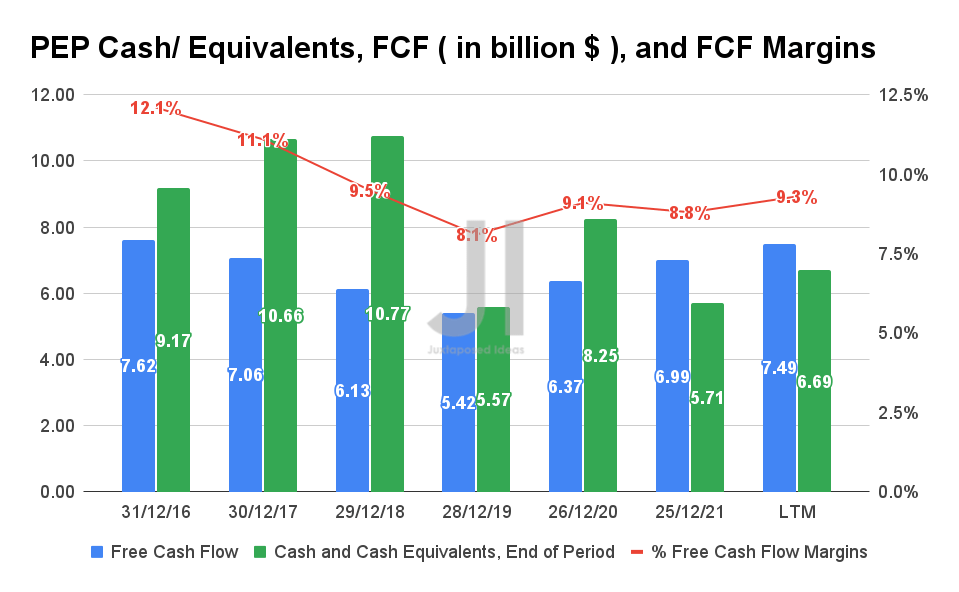
As a result of its increased net income profitability, it made sense that PEP has been able to report decent improvement in its Free Cash Flow (FCF) generation in the past few years. In the LTM, the company reported an FCF of $7.49B with an FCF margin of 9.3%, representing a remarkable increase of 38.1% and 1.2 percentage points from FY2019 levels, respectively.
Therefore, given the strong consumer demand for PEP’s products, we are convinced of its robust FCF generation moving forward, despite the market concerns of inflation and a potential recession. In fact, the company had shown its sales resilience during the past recession in 2008, when it reported revenues of $43.2B, net incomes of over $5B, and FCF of over $4.5B.
PEP Long-Term Debt, Interest Expense, Net PPE and Capex (S&P Capital IQ)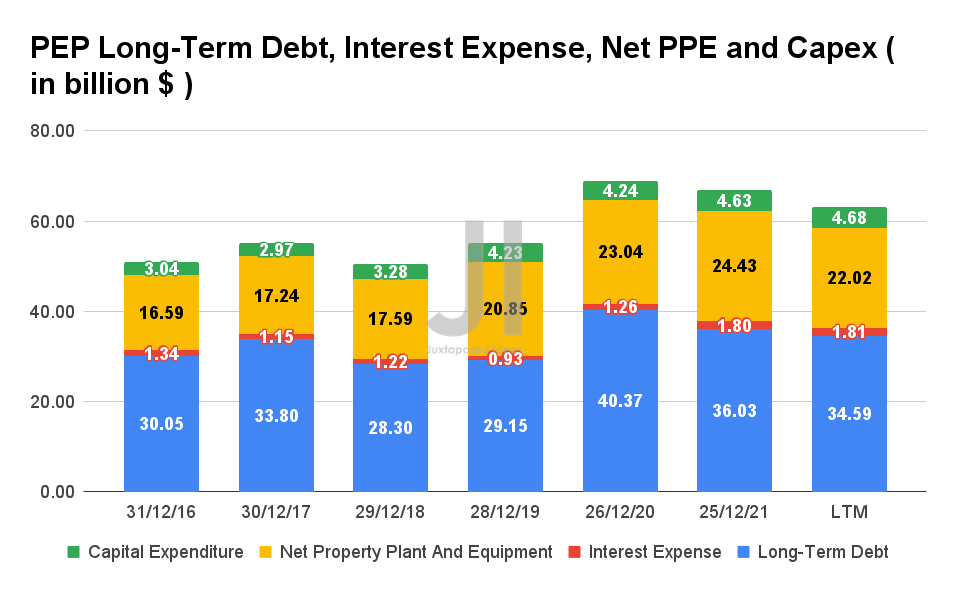
It is evident that PEP took on more long-term debts in FY2020, though we can also see significant efforts in deleveraging in the past year. The company reported long-term debts of $34.59B and interest expenses of $1.81B, representing an increase of 18.6% and 94.6% from FY2019 levels, respectively, though a notable decrease of long-term debts by 14.3% since FY2020.
At the same time, it made sense for PEP to increase its net PPE assets and capital expenditure to meet the massive consumer demand in the past year. By the LTM, the company reported net PPE assets of $22.02B and Capex of $4.68B, representing an increase of 5.6% and 10.6% from FY2019 levels, respectively. Nonetheless, we are not overly concerned, given PEP’s continually improving FCF profitability in the LTM. In addition, these would directly contribute to its top and bottom line in the intermediate term.
PEP Projected Revenue and Net Income (S&P Capital IQ)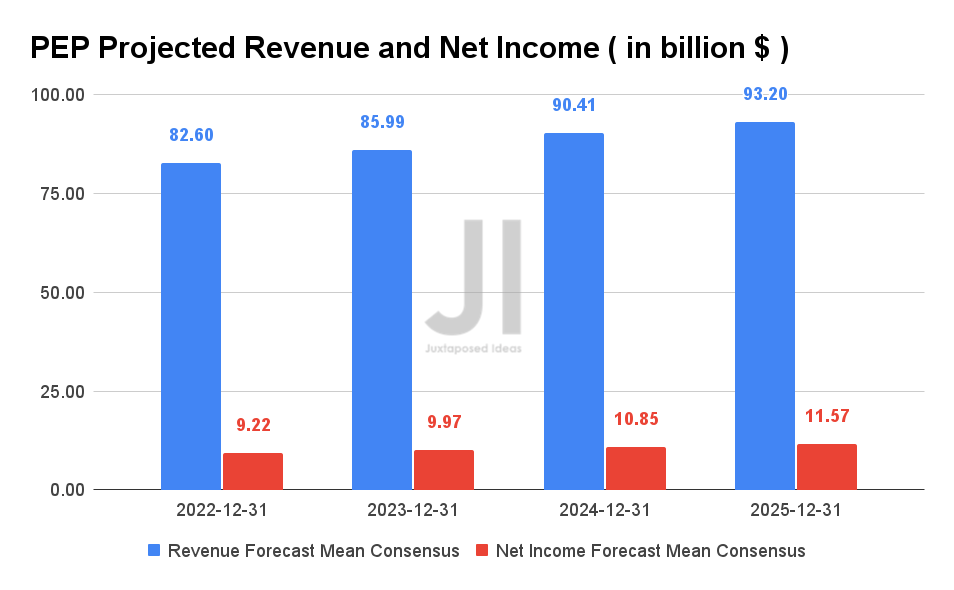
Over the next four years, PEP is expected to report revenue and net income at an excellent CAGR of 4.06% and 11.04%, respectively, with improving net income margins of 9.6% in FY2021 to 12.4% in FY2025. For FY2022, consensus estimates that the company will report revenues of $82.6B and net incomes of $9.22B, representing impressive YoY growth of 3.9% and 21%, respectively.
Analysts and long-term PEP investors will also be closely watching its performance in FQ2’22, given consensus revenue estimates of $19.48B and EPS of $1.74, representing an increase of 1.39% and 1.05%, respectively.
PEP Is Still An Excellent Dividend Stock
PEP 10Y Share Price (adj) and Dividend Yield
PEP 10Y Share Price (adj) and Dividend Yield (S&P Capital IQ)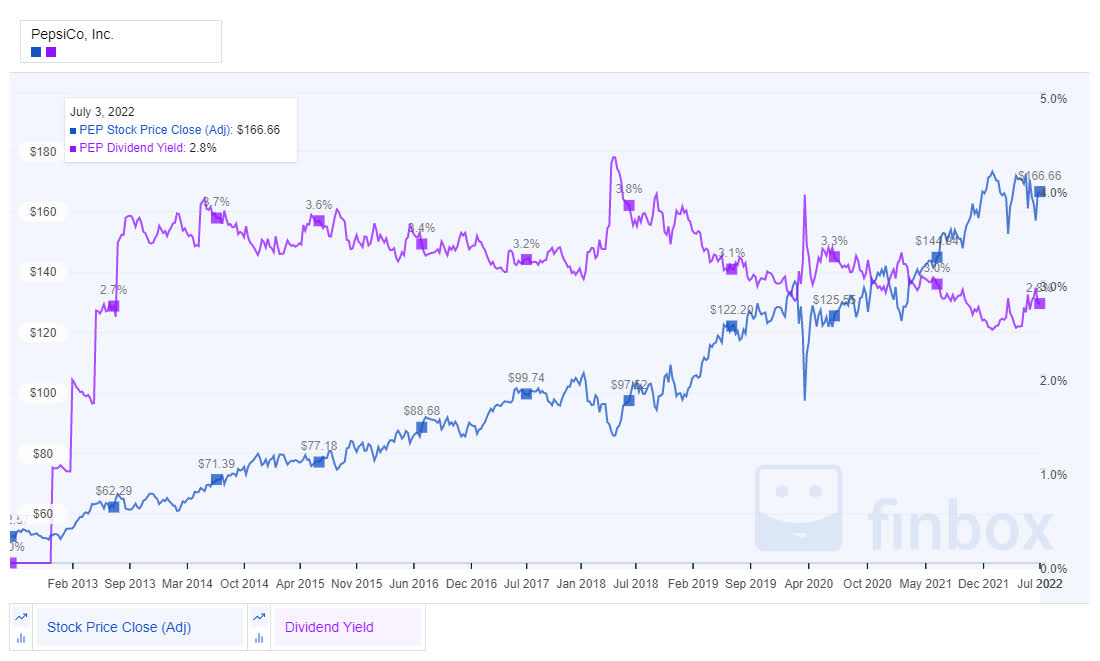
PEP has had a discernible long-term stock price uptrend over the last ten years. Though the stock had a slight decline in its dividend yield from 3.7% in 2014 to 2.8% in 2022, its dividend payout has been increasing at a CAGR of 8.05% in the past ten years, from $0.53 to $1.15. The fact that the company increased its payout by 20.3% in the past two years also highlights that PEP is a serious dividend stock for a long-term hold.
PEP Share Count and Share-Based Compensation (S&P Capital IQ)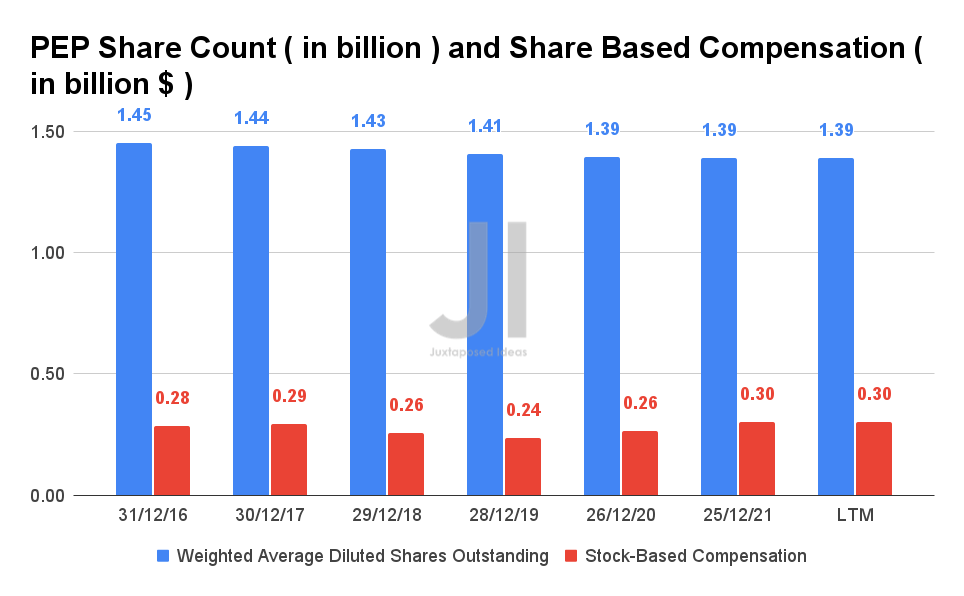
PEP also has been embarking on share buyback programs, with up to $10B authorized through February 2026. Combined with its modest stock-based compensation (SBC) of $300M in the LTM, we expect PEP to provide excellent value to its existing investors indeed.
So, Is PEP Stock A Buy, Sell, or Hold?
PEP 5Y EV/Revenue and P/E Valuations
PEP 5Y EV/Revenue and P/E Valuations (S&P Capital IQ)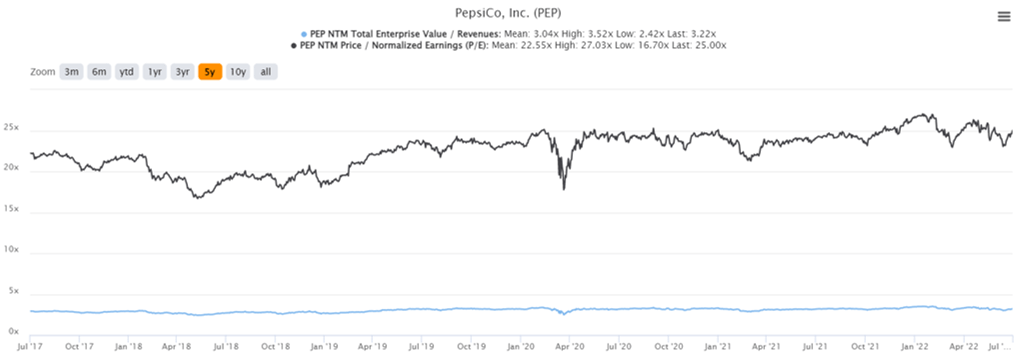
PEP is currently trading at an EV/NTM Revenue of 3.22x and NTM P/E of 25x, lower than its 3Y mean of 3.04x and 22.55x, respectively. The stock is also trading at $169.39, only down 4.6% from its 52 weeks high of $177.62 and at a premium of 14.6% from its 52 weeks low of $147.77. It is apparent that PEP is still trading at a premium, though the stock seems to be struggling to break out of the $175 resistance level since January 2022.
PEP 5Y Stock Price
PEP 5Y Stock Price (Seeking Alpha)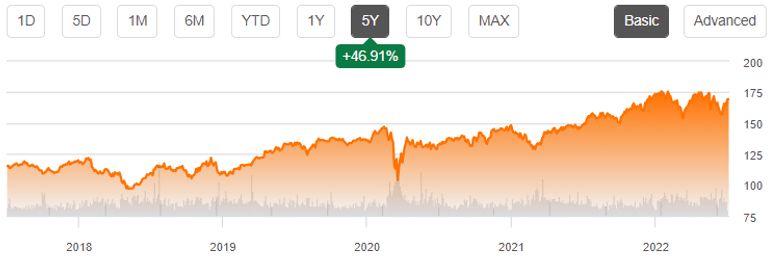
Despite the attractive buy rating from consensus estimates with a price target of $183.80, we are not convinced of its minimal 8.51% upside from current prices. In addition, we expect to see moderate volatility over the next week as PEP releases its FQ2’22 earnings on 12 July 2022.
In addition, long-term PEP investors would be well advised of a potential stock decline, assuming that the recession takes place in the next few quarters, since the stock also fell by over 30% during the two years of recession in 2008 and 2009, given the bear market condition then. As a result, we encourage investors to wait for more clarity post earnings and, potentially, a deeper retracement before adding more exposure to this solid stock, especially given its baked-in premium in the past few years.
Therefore, we rate PEP stock as a Hold for now.
Be the first to comment