

spooh
This article was coproduced with Dividend Sensei.
Most bills are monthly, and most dividends are quarterly. While it’s not hard to generate monthly revenue by owning companies with staggered dividend payout dates, there’s something so simple and elegant about monthly dividend stocks.
Unfortunately, most monthly dividend stocks are mREITs, BDCs, or CEFs, a veritable minefield of sucker yields and value traps.
This is why I cherish the handful of quality monthly dividend blue-chips that are time-tested ways for retirees to pay the bills today while growing their income and wealth tomorrow.
Let me show you the four reasons why I just recommended Pembina Pipeline (NYSE:PBA) for Dividend Kings members, bought some for my retirement portfolio, and you might want to do the same.
Reason One: Pembina Is The Complete High-Yield Monthly Dividend Package
Here’s the bottom-line up front on Pembina:
-
Canadian Company: foreign diversification
-
15% tax withholding (not in retirement accounts) – tax credit available to recoup withheld dividend
-
1099 tax form, qualified dividends
-
NO K1 tax form
Reasons To Potentially Buy Pembina Today
-
89% quality low-risk 12/13 Super SWAN (sleep well at night) midstream
-
the 102nd highest quality company on the Master List (80th percentile)
-
92% dividend safety score
-
0-year dividend growth streak (no cuts since 1998, 24-year streak)
-
5.4% very safe yield, paid monthly
-
0.5% average recession dividend cut risk
-
1.4% severe recession dividend cut risk
-
8% historically undervalued (potential reasonable buy)
-
Fair Value: $40.07 (10.2X cash flow)
-
9.4X forward cash flow vs. 11X to 13X historical
-
BBB stable outlook credit rating = 7.5% 30-year bankruptcy risk
-
76th industry percentile risk management consensus = Good
-
5% to 15% CAGR margin-of-error growth consensus range
-
management growth guidance: 5% CAGR
-
7.1% CAGR median growth consensus
-
5-year consensus total return potential: 11% to 20% CAGR
-
base-case 5-year consensus return potential: 12% CAGR (2X more than the S&P consensus)
-
consensus 12-month total return forecast: 19%
-
Fundamentally Justified 12-Month Returns: 14% CAGR
PBA Growth Outlook Is Solid:
|
Metric |
2021 growth |
2022 consensus growth |
2023 consensus growth |
2024 consensus growth |
2025 consensus growth |
2026 consensus growth |
2027 consensus growth |
|
Sales |
55% |
21% |
-11% |
-23% |
NA |
NA |
NA |
|
Dividend |
0% |
0% |
4% |
4% |
2% |
3% |
15% |
|
Operating Cash Flow |
27% |
-2% |
5% |
4% |
NA |
NA |
NA |
|
EBITDA |
23% |
22% |
1% |
1% |
NA |
NA |
NA |
|
EBIT (operating profit) |
28% |
20% |
5% |
0% |
NA |
NA |
NA |
(Source: FAST Graphs, FactSet)
Like CA banks, PBA froze its dividend during the Pandemic but is expected to start growing it again in 2023.
-
the negative sales growth forecast is likely an artifact
-
cash flows growing, and that’s what pays the dividend
PBA Rolling Returns Since November 2003
PBA is a very consistent market-beater, with average rolling returns of 14% to 17% across every time-frame over the last 19 years.
-
12.5% CAGR future returns expected
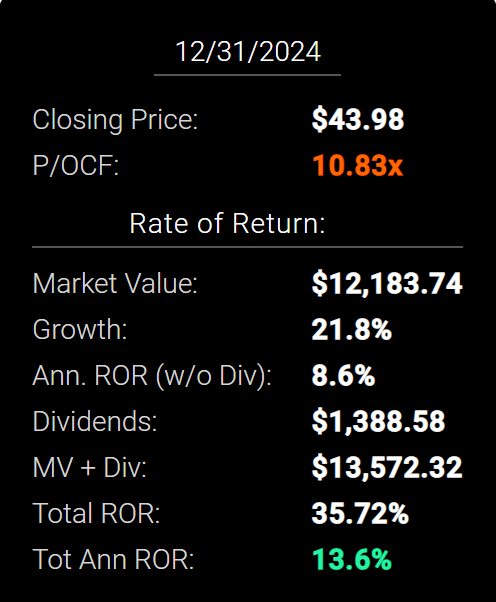
PBA 2024 Consensus Total Return Potential
FAST Graphs FAST Graphs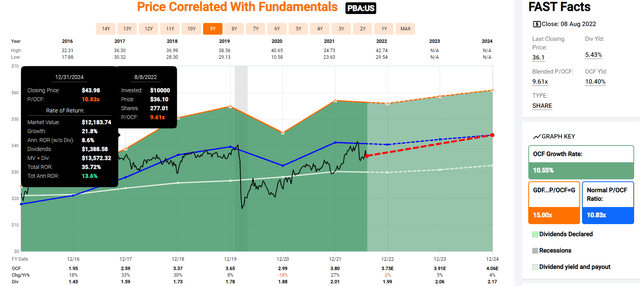
(Source: FAST Graphs, FactSet)
If PBA grows as analysts expect through 2024 and returns to historical fair value, it could deliver 36% total returns or 14% annually.
-
50% better than the S&P 500
Now compare that to the S&P 500 consensus.
S&P 2024 Consensus Total Return Potential
FAST Graphs Fast Graphs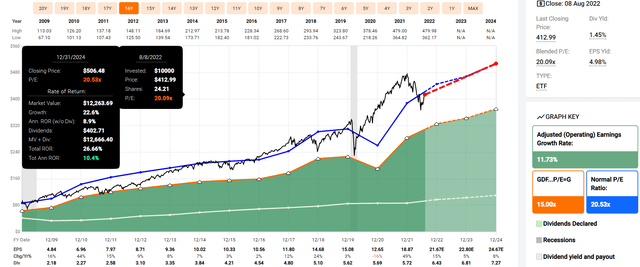
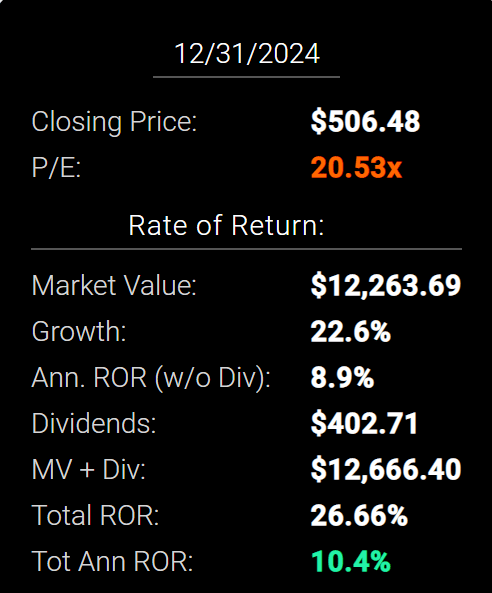
Analysts expect about 27% or 10% annual returns from the S&P 500 over the next 2.5 years.
PBA 2027 Consensus Total Return Potential
FAST Graphs FAST Graphs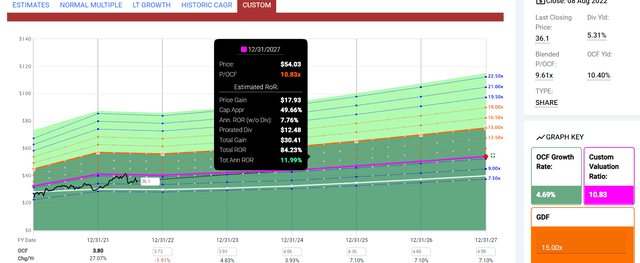
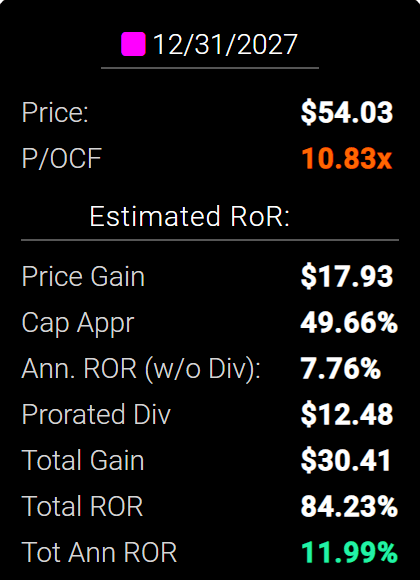
By 2027, if PBA grows as expected and returns to historical mid-range historical fair value, it could deliver 84% or 12% annual returns.
-
about 2X more than the S&P 500 consensus
S&P 500 2027 Consensus Return Potential
|
Year |
Upside Potential By End of That Year |
Consensus CAGR Return Potential By End of That Year |
Probability-Weighted Return (Annualized) |
Inflation And Risk-Adjusted Expected Returns |
|
2027 |
46.39% |
7.92% |
5.94% |
3.66% |
(Source: DK S&P 500 Valuation And Total Return Tool)
Over the next five years, analysts expect about 46% total returns from the S&P 500 or 8% annually.
PBA Long-Term Consensus Total Return Potential
|
Investment Strategy |
Yield |
LT Consensus Growth |
LT Consensus Total Return Potential |
Long-Term Risk-Adjusted Expected Return |
Long-Term Inflation And Risk-Adjusted Expected Returns |
Years To Double Your Inflation & Risk-Adjusted Wealth |
10-Year Inflation And Risk-Adjusted Expected Return |
|
Pembina |
5.4% |
7.1% |
12.5% |
8.8% |
6.5% |
11.0 |
1.88 |
|
Dividend Aristocrats |
2.5% |
8.6% |
11.0% |
7.7% |
5.5% |
13.1 |
1.71 |
|
S&P 500 |
1.6% |
8.5% |
10.1% |
7.1% |
4.9% |
14.8 |
1.61 |
(Sources: Morningstar, FactSet, YCharts) – ignores valuation, which cancels out over 30+ years
Analysts think PBA could outperform almost every popular investment strategy, including the S&P 500 and dividend aristocrats.
PBA Total Returns Since November 2003
PBA has delivered very strong 16% annual returns for 35 years, a 15X bagger over the last 18 years.
That’s 9.5X inflation-adjusted returns, 3X more than the S&P 500.
A Dividend Growth Blue-Chip You Can Trust
Pembina has historically been a dividend dream stock.
PBA Cumulative Dividend Since 2005:
|
Metric |
S&P 500 |
Pembina |
|
Total Dividends |
$831 |
$7,357 |
|
Annualized Income Growth Rate |
8.19% |
13.10% |
|
Total Income/Initial Investment |
0.83 |
7.36 |
|
Inflation-Adjusted Income/Initial Investment |
0.54 |
4.75 |
|
More Inflation-Adjusted Income Than The S&P 500 |
8.85 |
(Source: Portfolio Visualizer Premium)
PBA has delivered 13% annual income growth and 7.4X an investor’s initial investment in inflation-adjusted dividends over the last 17 years.
-
a 95% yield on cost means that number is rising very quickly now
PBA has recouped investors’ initial investments almost 5X since 2005, adjusted for inflation.
-
9X more inflation-adjusted income than the S&P 500
PBA Consensus Future Income Growth Potential:
|
Analyst Consensus Income Growth Forecast |
Risk-Adjusted Expected Income Growth |
Risk And Tax-Adjusted Expected Income Growth |
Risk, Inflation, And Tax Adjusted Income Growth Consensus |
|
10.5% |
7.4% |
6.3% |
4.0% |
(Source: DK Research Terminal, FactSet)
Analysts think PBA could deliver similar 11% annual income growth in the future, which, adjusted for the risk of the company not growing as expected, inflation, and taxes, is 4.0% real expected income growth.
Now compare that to what they expect from the S&P 500.
|
Time Frame |
S&P Inflation-Adjusted Dividend Growth |
S&P Inflation-Adjusted Earnings Growth |
|
1871-2021 |
1.6% |
2.1% |
|
1945-2021 |
2.4% |
3.5% |
|
1981-2021 (Modern Falling Rate Era) |
2.8% |
3.8% |
|
2008-2021 (Modern Low Rate Era) |
3.5% |
6.2% |
|
FactSet Future Consensus |
2.0% |
5.2% |
(Sources: S&P, FactSet, Multipl.com)
-
1.7% post-tax inflation-adjusted income growth from the S&P 500
-
S&P 500’s historical post-tax inflation-adjusted income growth rate (current tax code) is 5.8% CAGR
S&P is now dominated by companies favoring buybacks over dividends, potentially explaining the slower income growth in the future.
What about a 60/40 retirement portfolio?
-
0.5% consensus inflation, risk, and tax-adjusted income growth.
In other words, PBA could generate about 3X faster real income growth than the S&P 500 and 8X faster income growth than a 60/40.
-
And a 3.5X higher and safer yield on day one
What inflation-adjusted returns do analysts expect in the future?
Inflation-Adjusted Consensus Return Potential: $1,000 Initial Investment
|
Time Frame (Years) |
7.9% CAGR Inflation-Adjusted S&P Consensus |
8.8% Inflation-Adjusted Aristocrat Consensus |
10.3% CAGR Inflation-Adjusted PBA Consensus |
Difference Between Inflation-Adjusted PBA Consensus And S&P Consensus |
|
5 |
$1,461.18 |
$1,523.16 |
$1,631.11 |
$169.93 |
|
10 |
$2,135.06 |
$2,320.01 |
$2,660.53 |
$525.47 |
|
15 |
$3,119.71 |
$3,533.75 |
$4,339.62 |
$1,219.91 |
|
20 |
$4,558.47 |
$5,382.46 |
$7,078.40 |
$2,519.93 |
|
25 |
$6,660.75 |
$8,198.35 |
$11,545.66 |
$4,884.91 |
|
30 |
$9,732.58 |
$12,487.39 |
$18,832.27 |
$9,099.69 |
(Source: DK Research Terminal, FactSet) – ignoring starting valuation, which cancels out over 30+ years
In the coming decades, management and analysts think PBA could deliver 19X inflation-adjusted returns, about 2X more than the S&P 500 and 50% more than the dividend aristocrats.
|
Time Frame (Years) |
Ratio Aristocrats/S&P Consensus |
Ratio Inflation-Adjusted PBA Consensus vs. S&P consensus |
|
5 |
1.04 |
1.12 |
|
10 |
1.09 |
1.25 |
|
15 |
1.13 |
1.39 |
|
20 |
1.18 |
1.55 |
|
25 |
1.23 |
1.73 |
|
30 |
1.28 |
1.93 |
(Source: DK Research Terminal, FactSet)
PBA Investment Decision Score
Dividend Kings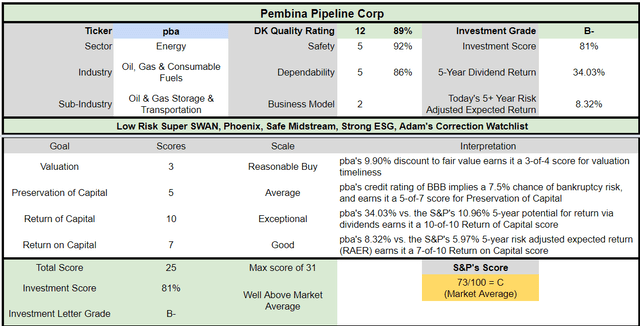
PBA is a reasonable and prudent high-yield monthly blue-chip option.
-
8% discount vs. 5% market premium = 13% better valuation
-
5.4% yield vs. 1.6% yield (3.5X higher and much safer)
-
25% better consensus long-term return potential
-
33% better risk-adjusted expected return over the next five years
-
3X higher consensus dividends over the next five years
Reason Two: One Of The World’s Highest Quality Companies
There are many ways to measure safety and quality, and I factor in pretty much all of them.
The Dividend Kings’ overall quality scores are based on a 257-point model that includes:
-
Dividend safety
-
Balance sheet strength
-
Credit ratings
-
Credit default swap medium-term bankruptcy risk data
-
Short and long-term bankruptcy risk
-
Accounting and corporate fraud risk
-
Profitability and business model
-
Growth consensus estimates
-
Management growth guidance
-
Historical earnings growth rates
-
Historical cash flow growth rates
-
Historical dividend growth rates
-
Historical sales growth rates
-
Cost of capital
-
GF Scores
-
Morningstar business model uncertainty score
-
Long-term risk-management scores from MSCI, Morningstar, FactSet, S&P, Reuters’/Refinitiv, and Just Capital
-
Management quality
-
Dividend-friendly corporate culture/income dependability
-
Long-term total returns (a Ben Graham sign of quality)
-
Analyst consensus long-term return potential
It includes over 1,000 fundamental metrics, including the 12 rating agencies we use to assess fundamental risk.
-
credit and risk management ratings make up 41% of the DK safety, and quality model
-
dividend/balance sheet/risk ratings make up 82% of the DK safety and quality model
How do we know that our safety and quality model works well?
During the two worst recessions in 75 years, our safety model 87% of blue-chip dividend cuts, the ultimate baptism by fire for any dividend safety model.
How does PBA score on our comprehensive safety and quality models?
PBA Dividend Safety
|
Rating |
Dividend Kings Safety Score (165 Point Safety Model) |
Approximate Dividend Cut Risk (Average Recession) |
Approximate Dividend Cut Risk In Pandemic Level Recession |
|
1 – unsafe |
0% to 20% |
over 4% |
16+% |
|
2- below average |
21% to 40% |
over 2% |
8% to 16% |
|
3 – average |
41% to 60% |
2% |
4% to 8% |
|
4 – safe |
61% to 80% |
1% |
2% to 4% |
|
5- very safe |
81% to 100% |
0.5% |
1% to 2% |
|
PBA |
92% |
0.50% |
1.40% |
|
Risk Rating |
Low-Risk (76th industry percentile risk-management consensus) |
BBB stable outlook credit rating 7.5% 30-year bankruptcy risk |
20% OR LESS Max Risk Cap Recommendation |
Long-Term Dependability
|
Company |
DK Long-Term Dependability Score |
Interpretation |
Points |
|
Non-Dependable Companies |
21% or below |
Poor Dependability |
1 |
|
Low Dependability Companies |
22% to 60% |
Below-Average Dependability |
2 |
|
S&P 500/Industry Average |
61% (61% to 70% range) |
Average Dependability |
3 |
|
Above-Average |
71% to 80% |
Very Dependable |
4 |
|
Very Good |
81% or higher |
Exceptional Dependability |
5 |
|
PBA |
86% |
Exceptional Dependability |
5 |
Overall Quality
|
PBA |
Final Score |
Rating |
|
Safety |
92% |
5/5 Very Safe |
|
Business Model |
80% |
2/3 narrow and stable moat |
|
Dependability |
86% |
5/5 exceptional |
|
Total |
89% |
12/13 Super SWAN |
|
Risk Rating |
4/5 Low-Risk |
|
|
15% OR LESS Max Risk Cap Rec |
10% Margin of Safety For A Potentially Good Buy |
PBA is the 102nd highest quality company on the DK 500 Master list.
How significant is this? The DK 500 Master List is one of the world’s best watchlists, including
-
every dividend aristocrat (S&P companies with 25+ year dividend growth streaks)
-
every dividend champion (every company, including foreign, with 25+ year dividend growth streaks)
-
every dividend king (every company with 50+ year dividend growth streaks)
-
every foreign aristocrat (every company with 20+ year dividend growth streaks)
-
every Ultra SWAN (wide moat aristocrats, as close to perfect quality companies as exist)
-
40 of the world’s best growth stocks
In other words, even among the world’s best companies, PBA is higher quality than 80% of them, similar in quality to such aristocrats and Ultra SWANs as:
-
Coca-Cola (KO): Ultra SWAN dividend king
-
Altria (MO): Ultra SWAN dividend king
-
Procter & Gamble (PG): Ultra SWAN dividend king
-
Kimberly-Clark (KMB): Ultra SWAN dividend aristocrat
-
Caterpillar (CAT): Ultra SWAN dividend aristocrat
-
Canadian Imperial Bank of Commerce (CM): Ultra SWAN
-
Royal Bank of Canada (RY): Ultra SWAN
PBA is the 3rd highest quality midstream.
|
Company/MLP |
Ticker |
Quality Score |
Safety Score |
Long-Term Risk Management Consensus Industry Percentile |
Longest Maturing Bond |
Longest Maturing Bond Yield To Maturity |
|
Enbridge |
ENB |
91% |
92% |
74% |
2112 |
6.1% |
|
Enterprise Products Partners (uses K-1 tax form) |
EPD |
90% |
96% |
67% |
2078 |
5.4% |
|
Pembina Pipeline Corp |
PBA |
89% |
92% |
76% |
2081 |
7.1% |
|
Magellan Midstream Partners (uses K-1) |
MMP |
83% |
85% |
49% |
2050 |
5.2% |
|
MPLX (uses K-1) |
MPLX |
80% |
87% |
58% |
2058 |
3.9% |
|
National Fuel Gas |
NFG |
78% |
83% |
40% |
2031 |
2.7% |
|
Brookfield Infrastructure Corp |
BIPC |
75% |
78% |
44% |
2032 |
3.0% |
|
TC Energy |
TRP |
74% |
79% |
69% |
2081 |
5.0% |
|
ONEOK |
OKE |
73% |
75% |
76% |
2051 |
4.3% |
|
Kinder Morgan |
KMI |
71% |
74% |
60% |
2098 |
4.9% |
|
NextEra Energy Partners |
NEP |
70% |
66% |
80% |
2026 |
2.8% |
|
Williams Companies |
WMB |
65% |
67% |
65% |
2050 |
3.3% |
|
Average |
78.3% |
81.2% |
63.2% |
20.62 |
4.5% |
(Source: DK Research Terminal)
Why I Trust Pembina And So Can You
See section 3 of this article for a deep dive into why the energy transition will take decades, not years.
Pembina was founded in 1954 in Calgary, Canada, making it one of the oldest midstreams in North America.
Pembina is a vertically integrated midstream focused primarily on Canada.
-
3.1 million bpd of oil & gas transport capacity
-
6.1 billion cubic feet of daily gas processing capacity
-
354,000 barrels/day of natural gas liquids fractionation capacity
-
32 million barrels of storage capacity
-
20,000 barrels per day of propane export capacity
PBA is essential to Canada’s fossil fuel industry and helps producers maximize their assets’ value.
PBA’s business is:
-
40% oil
-
35% NGL
-
25% natural gas
65% to 70% of revenue is from take or pay contracts.
-
volume is reserved on its system
-
producers pay PBA 100% regardless of whether they ship any product at all
-
15% of cash flow is sensitive to commodity prices
Pembina Is Pursuing A Free Cash Flow Self-Funding Business Model
|
Year |
Distributable Cash Flow |
Free Cash Flow |
Dividends |
DCF Payout Ratio |
FCF Payout Ratio |
Dividend/Share |
|
2022 |
$2,011.0 |
$1,787.97 |
$1,091.72 |
54.3% |
61.1% |
$1.96 |
|
2023 |
$2,019.0 |
$1,821.39 |
$1,141.85 |
56.6% |
62.7% |
$2.05 |
|
2024 |
$2,140.0 |
$1,754.55 |
$1,186.41 |
55.4% |
67.6% |
$2.13 |
|
2025 |
$2,082.0 |
$1,214.26 |
$1,208.69 |
58.1% |
99.5% |
$2.17 |
|
2026 |
$2,087.0 |
$1,281.10 |
$1,242.11 |
59.5% |
97.0% |
$2.23 |
|
Annual Growth |
0.93% |
-0.94% |
5.49% |
2.33% |
5.23% |
5.49% |
(Source: FactSet Research Terminal)
Management says it can grow cash flow and dividends by 5% annually over time.
According to rating agencies, the safe payout ratio for this industry is 83% DCF payout ratio, and Pembina’s is 54% this year and is expected to remain under 60% through 2026.
Even accounting for increased growth spending in 2025 and 2026, analysts expect PBA will be able to grow the dividend at management’s target rate and fully cover the dividend with free cash flow.
-
zero reliance on equity to fund its growth plans
88% of cash flow is ultimately fee-based, with 80% of contracts from investment grade counterparties or secured with letters of credit.
PBA has over 200 customers, with the top 20 representing about 70% of cash flow. Its energy utility business model has allowed it to grow cash flows by 11% annually over the last 10 years while growing the dividend 5% annually.
-
PBA avoided cuttings its dividend, unlike many larger and less well-managed and conservative midstreams during the worst industry downturns in history
PBA has a 13-year average debt maturity with average borrowing costs of 4% and targets 3.5X to 4.25 leverage vs. 5.0 or less the rating agency safety guideline.
It targets a 5X cash flow interest coverage ratio vs. 2+ safe according to rating agencies.
Management’s capital allocation priorities are
-
balance sheet safety
-
maintaining the dividend
-
growing the business
-
discretionary cash flow uses dividend growth, buybacks, and debt reduction
It’s planning on pursuing a prudent mix of all of these goals in 2022 and has secured all the funding it needs internally with no need for equity issuances.
The company’s financial guardrails are safety policies put in place to secure the dividend and the company’s future.
-
80+% of cash flow from fee-based contracts
-
pay out the dividend exclusively from fee-based contracted revenue
-
75+% of contracts with investment grade or secured counterparties
-
maintain its BBB credit rating
Pembina recently agreed to a joint venture with KKR, one of the world’s largest alternative asset managers, and Energy Transfer Canada to create a new natural gas processing giant.
-
significant increasing PBA’s economies of scale
PBA believes the new joint venture will have many benefits, including lower capital costs to maximize the growth opportunities in Canadian natural gas.
-
Canada has the world’s largest natural gas reserves
-
and could be a critical LNG supplier to Europe as it attempts to become independent of Russia for gas supplies
PBA is planning on reducing its CO2 emissions by 30% by 2030.
-
CA is expected to impose a 170 CAD/ton carbon tax by this time
-
a smart move by PBA to reduce its costs
PBA’s green energy transition plan primarily focuses on carbon sequestration.
-
Bond investors are willing to buy PBA bonds maturing in 2081
-
implying the “smart money” on Wall Street thinks PBA will still be around in 50 years to pay off that debt
Kinder Morgan abandoned its Trans Mountain Pipeline due to lawsuits by First Nation’s tribes, and the government of Canada is dedicated to finding private partnerships to complete it.
Pembina is one of the most trusted operators in Canada and is planning on launching a bid for the TMP, as well as is pursuing several other joint ventures with First Nation tribes.
-
getting projects completed and past a gauntlet of lawsuits is critical to good risk management in this industry
-
and achieving safe and sustainable 5+% long-term growth
According to McKinsey and Cummins, hydrogen will be a $3.5 trillion potential market by 2030.
-
mostly focused on steel and ships
Pembina plans to leverage its strong NGL business to become a leader in Canadian hydrogen production.
PBA’s carbon sequestration joint venture for carbon sequestration is with TC Energy and is called the Alberta Carbon Grid.
-
TC Energy is the largest midstream in North America
-
the plan has the backing of the Alberta government
-
Alberta is the heart of Canada’s oil production industry
Pembina has a reasonable plan to transition to a green energy future, and rating agencies, analysts, and the bond market thinks they will succeed.
In the medium term, PBA plans to pursue $3.1 billion in growth projects at attractive returns on investment.
-
These include projects with 20-year contracts with oil giants like Conoco-Phillips before construction is even begun
Quantitative Analysis: The Math Backing Up PBA’s Investment Thesis
Ben Graham recommended combining qualitative (the story) analysis with quantitative analysis looking at the past, present, and likely future.
PBA Credit Ratings
|
Rating Agency |
Credit Rating |
30-Year Default/Bankruptcy Risk |
Chance of Losing 100% Of Your Investment Is 1 In… |
|
S&P |
BBB Stable Outlook |
7.50% |
13.3 |
|
DBRS |
BBB+ Stable Outlook |
5% |
20.0 |
|
Consensus |
BBB Stable Outlook |
6.25% |
16.0 |
(Source: S&P, Moody’s)
Rating agencies estimate PBA’s fundamental risk at 6.3%, indicating a 1 in 16 chance of losing all your money buying the company today.
PBA Leverage Consensus Forecast
|
Year |
Debt/EBITDA |
Net Debt/EBITDA (5.0 Or Less Safe According To Credit Rating Agencies) |
Interest Coverage (2+ Safe) |
|
2020 |
3.31 |
3.86 |
6.11 |
|
2021 |
3.30 |
3.85 |
4.84 |
|
2022 |
3.17 |
3.31 |
5.90 |
|
2023 |
3.11 |
3.14 |
6.27 |
|
2024 |
3.25 |
3.15 |
5.90 |
|
2025 |
3.00 |
3.72 |
NA |
|
2026 |
3.03 |
3.63 |
NA |
|
2027 |
2.95 |
NA |
NA |
|
Annualized Change |
-1.67% |
-1.01% |
-0.89% |
(Source: FactSet Research)
Management’s target is 3.5X to 4.25X leverage and 5X interest coverage, and analysts believe it will achieve those goals.
PBA Balance Sheet Consensus Forecast
|
Year |
Total Debt (Millions) |
Cash |
Net Debt (Millions) |
Interest Cost (Millions) |
EBITDA (Millions) |
Operating Income (Millions) |
|
2020 |
$8,591 |
$64 |
$9,996 |
$332 |
$2,592 |
$2,029 |
|
2021 |
$8,902 |
$34 |
$10,365 |
$347 |
$2,695 |
$1,679 |
|
2022 |
$9,007 |
$157 |
$9,381 |
$349 |
$2,837 |
$2,060 |
|
2023 |
$8,904 |
$170 |
$8,995 |
$338 |
$2,866 |
$2,119 |
|
2024 |
$9,464 |
$283 |
$9,160 |
$350 |
$2,912 |
$2,064 |
|
2025 |
$8,658 |
NA |
$10,754 |
NA |
$2,890 |
NA |
|
2026 |
$8,879 |
NA |
$10,646 |
NA |
$2,934 |
NA |
|
2027 |
$9,105 |
NA |
NA |
NA |
$3,091 |
NA |
|
Annualized Growth |
0.83% |
45.01% |
1.06% |
1.33% |
2.55% |
0.43% |
(Source: FactSet Research)
PBA’s debt is growing slowly, with cash flow growing faster, resulting in gradually lower leverage and a safer balance sheet.
PBA Bond Profile
-
$1.9 billion in liquidity
-
well-staggered debt maturities (little problem refinancing maturing bonds)
-
95% unsecured bonds (very good financial flexibility)
-
bond investors willing to lend to PBA for 59 years at 7.2% (4.8% originally)
-
the average borrowing cost is 3.87%
-
1.65% after inflation vs. 7.9% returns on invested capital
Profitability: Wall Street’s Favorite Quality Proxy
PBA profitability is historically in the top 20% of peers.
PBA 12-Month Profitability Vs. Peers
|
Metric |
TTM |
Industry Percentile |
Major Oil & Gas Companies providers More Profitable Than PBA (Out Of 1,103) |
|
Gross Margins |
29.64% |
52.48 |
524 |
|
Operating Margin |
28.78% |
74.59 |
280 |
|
Net Margin |
14.46% |
71.18 |
318 |
|
Return On Equity |
8.98% |
55.53 |
491 |
|
Return On Assets |
4.46% |
60.74 |
433 |
|
Returns On Invested Capital |
6.69% |
62.74 |
411 |
|
Return On Capital (Greenblatt) |
12.23% |
57.65 |
467 |
|
Return On Capital Employed |
7.89% |
53.44 |
514 |
|
Average |
14.14% |
61.04 |
430 |
(Source: Gurufocus Premium)
It’s boom times for oil & gas producers, and PBA’s profitability has fallen to the 61st percentile during the last year.
-
PBA’s profitability is a lot more stable than most energy companies
-
the case with the midstream industry
PBA Profit Margin Consensus Forecast
|
Year |
FCF Margin |
EBITDA Margin |
EBIT (Operating) Margin |
Net Margin |
|
2020 |
20.3% |
52.9% |
41.4% |
-5.1% |
|
2021 |
26.9% |
39.8% |
24.8% |
14.4% |
|
2022 |
19.1% |
34.0% |
24.7% |
14.9% |
|
2023 |
24.8% |
41.5% |
30.7% |
18.0% |
|
2024 |
31.8% |
50.7% |
35.9% |
23.6% |
|
Annualized Growth |
11.83% |
-1.08% |
-3.51% |
NA |
|
Annualized Growth (Post Pandemic) |
5.66% |
8.38% |
13.14% |
17.92% |
(Source: FactSet Research Terminal)
PBA’s profitability in 2021 was expected, including 27% free cash flow margins and 40% EBITDA margins.
In 2024 it’s expected to have 32% FCF margins and 51% EBITDA margins.
-
growing economies of scale
PBA Medium-Term Consensus Forecast
|
Year |
Sales |
Free Cash Flow |
EBITDA |
EBIT (Operating Income) |
Net Income |
|
2020 |
$4,899 |
$995 |
$2,592 |
$2,029 |
-$250 |
|
2021 |
$6,772 |
$1,824 |
$2,695 |
$1,679 |
$975 |
|
2022 |
$8,356 |
$1,599 |
$2,837 |
$2,060 |
$1,246 |
|
2023 |
$6,913 |
$1,715 |
$2,866 |
$2,119 |
$1,243 |
|
2024 |
$5,748 |
$1,826 |
$2,912 |
$2,064 |
$1,357 |
|
2025 |
NA |
$1,691 |
$2,890 |
NA |
$1,885 |
|
2026 |
NA |
$1,730 |
$2,934 |
NA |
$1,889 |
|
2027 |
NA |
$1,760 |
$3,091 |
NA |
NA |
|
Annualized Growth |
4.08% |
8.49% |
2.55% |
0.43% |
NA |
|
Annualized Growth (Post Pandemic) |
-5.32% |
-0.59% |
2.31% |
7.12% |
14.14% |
|
Cumulative Next 3 Years |
$21,017 |
$5,140 |
$8,615 |
$6,243 |
$3,846 |
(Source: FactSet Research Terminal)
PBA’s sales might be volatile, buts its cash flows are not; in fact, they are expected to grow at 7% to 14% CAGR over the next few years.
-
133% of net income converted to free cash flow
-
an excellent cash conversion ratio
-
confirming the quality of the company, safety of the dividend, and low accounting fraud risk
Reason Three: Steady Growth Prospects For Decades To Come
I have no interest in recommending a company that can’t consistently grow its dividend. Thankfully PBA has solid growth prospects.
PBA Medium-Term Consensus Forecast
|
Year |
Sales |
Free Cash Flow |
EBITDA |
EBIT (Operating Income) |
Net Income |
|
2020 |
$4,899 |
$995 |
$2,592 |
$2,029 |
-$250 |
|
2021 |
$6,772 |
$1,824 |
$2,695 |
$1,679 |
$975 |
|
2022 |
$8,356 |
$1,599 |
$2,837 |
$2,060 |
$1,246 |
|
2023 |
$6,913 |
$1,715 |
$2,866 |
$2,119 |
$1,243 |
|
2024 |
$5,748 |
$1,826 |
$2,912 |
$2,064 |
$1,357 |
|
2025 |
NA |
$1,691 |
$2,890 |
NA |
$1,885 |
|
2026 |
NA |
$1,730 |
$2,934 |
NA |
$1,889 |
|
2027 |
NA |
$1,760 |
$3,091 |
NA |
NA |
|
Annualized Growth |
4.08% |
8.49% |
2.55% |
0.43% |
NA |
|
Annualized Growth (Post Pandemic) |
-5.32% |
-0.59% |
2.31% |
7.12% |
14.14% |
|
Cumulative Next 3 Years |
$21,017 |
$5,140 |
$8,615 |
$6,243 |
$3,846 |
(Source: FactSet Research Terminal)
PBA’s sales might be volatile, buts its cash flows are not; in fact, they are expected to grow at 7% to 14% CAGR over the next few years.
-
133% of net income converted to free cash flow
-
an excellent cash conversion ratio
-
confirming the quality of the company, safety of the dividend, and low accounting fraud risk
PBA Dividend Growth Consensus Forecast
|
Year |
Dividend Consensus |
DCF/Share Consensus |
DCF Payout Ratio |
Retained (Post-Dividend) Cash Flow |
Buyback Potential |
Debt Repayment Potential |
|
2022 |
$1.96 |
$3.57 |
54.9% |
$897 |
3.50% |
10.0% |
|
2023 |
$2.05 |
$3.66 |
56.0% |
$897 |
3.50% |
10.1% |
|
2024 |
$2.13 |
$3.73 |
57.1% |
$891 |
3.47% |
10.0% |
|
2025 |
$2.17 |
$3.59 |
60.4% |
$791 |
3.08% |
8.4% |
|
2026 |
$2.23 |
$3.65 |
61.1% |
$791 |
3.08% |
9.1% |
|
2027 |
$2.56 |
$3.64 |
70.3% |
$602 |
2.35% |
6.9% |
|
Total 2022 Through 2027 |
$13.10 |
$21.84 |
60.0% |
$4,868.18 |
18.98% |
54.67% |
|
Annualized Rate |
5.5% |
0.4% |
5.1% |
-7.7% |
-7.7% |
-6.9% |
(Source: FactSet Research Terminal)
83% is the payout DCF payout ratio credit rating agencies consider safe for this industry.
PBA’s DCF payout ratio is 55% right now and is expected to average 60% through 2027, allowing PBA to retain almost $5 billion in post-dividend cash flow.
-
enough to repay 55% of its debt or buyback almost 20% of shares at current valuations
PBA Buyback Consensus Forecast
|
Year |
Consensus Buybacks ($ Millions) |
% Of Shares (At Current Valuations) |
Market Cap |
|
2022 |
$223 |
0.9% |
$25,651 |
|
2023 |
$149 |
0.6% |
$25,651 |
|
2024 |
$466 |
1.8% |
$25,651 |
|
2025 |
NA |
NA |
$25,651 |
|
2026 |
$154 |
0.6% |
$25,651 |
|
2027 |
$154 |
0.6% |
$25,651 |
|
Total 2022 through 2027 |
$1,146 |
4.5% |
$25,651 |
|
Annualized Rate |
0.92% |
Average Annual Buybacks |
$229 |
(Source: FactSet Research Terminal)
PBA is expected to average $230 million in buybacks through 2027, or roughly 1% of shares at current valuations.
|
Time Frame (Years) |
Net Buyback Rate |
Shares Remaining |
Net Shares Repurchased |
Each Share You Own Is Worth X Times More (Not Including Future Growth And Dividends) |
|
5 |
0.9% |
95.48% |
4.52% |
1.05 |
|
10 |
0.9% |
91.17% |
8.83% |
1.10 |
|
15 |
0.9% |
87.05% |
12.95% |
1.15 |
|
20 |
0.9% |
83.12% |
16.88% |
1.20 |
|
25 |
0.9% |
79.37% |
20.63% |
1.26 |
|
30 |
0.9% |
75.78% |
24.22% |
1.32 |
(Source: FactSet Research Terminal)
Historically PBA has grown its share count (116% over the last 22 years) as it makes acquisitions, very much like REITs do.
PBA Long-Term Growth Outlook
-
7.1% to 14.1% is the actual growth consensus range
-
7.1% median consensus from all 17 analysts
-
management guidance: 5%
How accurate are analysts at forecasting PBA’s growth over time?
-
smoothing for outliers, historical analyst margins of error are 25% to the upside and 20% to the downside
-
5% to 15% CAGR margin-of-error adjusted growth consensus range
-
70% statistical probability PBA grows at 5% to 15% in the future
PBA’s historical growth rates are among the best in midstream, and analysts expect growth to be similar to the last 13 and 20 years.
Management says to expect growth similar to the last three years.
The IEA estimates North America has $13 trillion of infrastructure investment potential through 2030 alone, making PBA’s 5% to 7% growth outlook very reasonable and realistic.
Reason Four: A Wonderful Company At A Fair Price
For the last decade, millions of investors have paid 11 to 13X cash flow for PBA outside of bear markets and bubbles.
-
88% statistical probability that this represents the intrinsic value range for PBA
|
Metric |
Historical Fair Value (9 years, 100% bear market) |
2021 |
2022 |
2023 |
2024 |
12-Month Forward Fair Value |
|
5-year average yield |
5.29% |
$37.62 |
$37.05 |
$37.05 |
$40.26 |
|
|
13-year median yield |
4.98% |
$39.96 |
$39.36 |
$39.36 |
$42.77 |
|
|
Operating Cash Flow |
10.83 |
$41.15 |
$40.40 |
$42.35 |
$43.97 |
|
|
Average |
$39.52 |
$38.88 |
$39.47 |
$42.28 |
$39.23 |
|
|
Current Price |
$36.10 |
|||||
|
Discount To Fair Value |
8.66% |
7.16% |
8.53% |
14.61% |
7.98% |
|
|
Upside To Fair Value |
9.48% |
7.71% |
9.33% |
17.11% |
8.67% (14% including dividend) |
|
|
2022 OCF |
2023 Forward OCF |
2021 Weighted EPS |
2022 Weighted EPS |
12-Month Forward EPS |
12-Month Average Fair Value Forward OCF |
Current Forward OCF |
|
$3.73 |
$3.91 |
$1.51 |
$2.33 |
$3.84 |
10.2 |
9.4 |
I conservatively estimate PBA is historically worth 10.2X cash flow and today trades at 9.4X.
|
Analyst Median 12-Month Price Target |
Morningstar Fair Value Estimate |
|
$40.89 (10.7X cash flow) |
$29.00 (7.6X cash flow) |
|
Discount To Price Target (Not A Fair Value Estimate) |
Discount To Fair Value |
|
11.71% |
-24.48% |
|
Upside To Price Target (Not Including Dividend) |
Upside To Fair Value (Not Including Dividend) |
|
13.27% |
-19.67% |
|
12-Month Median Total Return Price (Including Dividend) |
Fair Value + 12-Month Dividend |
|
$42.85 |
$30.96 |
|
Discount To Total Price Target (Not A Fair Value Estimate) |
Discount To Fair Value + 12-Month Dividend |
|
15.75% |
-16.60% |
|
Upside To Price Target ( Including Dividend) |
Upside To Fair Value + Dividend |
|
18.70% |
-14.24% |
Morningstar’s fair value estimate of 7.6X cash flow is 100% not justified by PBA’s historical valuations.
FAST Graphs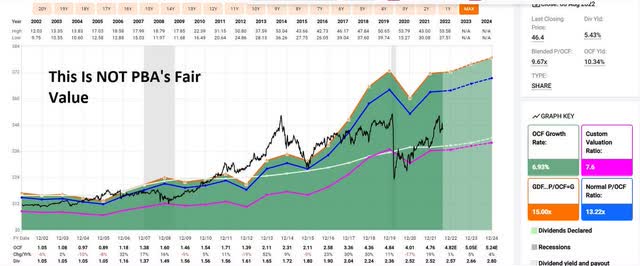
PBA has only traded at 7.6X cash flow during the Pandemic and in the depths of the Great Recession.
Analysts think PBA will trade at 10.7X in 12 months, a 19% total return.
Fundamentals would justify a 14% total return over the next year.
I don’t recommend companies based on 12-month forecasts but on the margin of safety and whether or not it sufficiently compensates you for a company’s risk profile.
Margin Of Safety Not 12-Month Price Targets Are How I Make Investment Decisions
|
Rating |
Margin Of Safety For Medium-Risk 12/13 Quality Super SWANs |
2022 Fair Value Price |
2023 Fair Value Price |
12-Month Forward Fair Value |
|
Potentially Reasonable Buy |
0% |
$38.88 |
$39.47 |
$39.23 |
|
Potentially Good Buy |
10% |
$35.00 |
$35.52 |
$35.31 |
|
Potentially Strong Buy |
20% |
$31.11 |
$31.57 |
$31.39 |
|
Potentially Very Strong Buy |
30% |
$24.50 |
$27.63 |
$27.46 |
|
Potentially Ultra-Value Buy |
40% |
$23.33 |
$23.68 |
$23.54 |
|
Currently |
$36.10 |
7.16% |
8.53% |
7.98% |
|
Upside To Fair Value (Not Including Dividends) |
7.71% |
9.33% |
8.67% |
For anyone comfortable with its risk profile, PBA is a potentially reasonable buy and 2% above its good buy price.
Risk Profile: Why Pembina Isn’t Right For Everyone
There are no risk-free companies, and no company is right for everyone. You have to be comfortable with the fundamental risk profile.
What Could Cause PBA’s Investment Thesis To Break
-
safety falls to 40% or less
-
balance sheet collapses (approximately 6.3% or less probability according to rating agencies)
-
a major botched acquisition
-
growth outlook falls to less than 2.6% for six years
-
PBA’s role in my portfolio is to deliver long-term 10+% returns with minimal fundamental risk
-
8+% total return requirement for defensive sectors (including midstream)
-
10+% for non-defensive (cyclical) sectors
How long it takes for a company’s investment thesis to break depends on the quality of the company.
|
Quality |
Years For The Thesis To Break Entirely |
|
Below-Average |
1 |
|
Average |
2 |
|
Above-Average |
3 |
|
Blue-Chip |
4 |
|
SWAN |
5 |
|
Super SWAN |
6 |
|
Ultra SWAN |
7 |
|
100% Quality Companies (MSFT, LOW, and MA) |
8 |
These are my rule of thumb for when to sell a stock if the investment thesis has broken. PBA is highly unlikely to suffer such catastrophic declines in fundamentals.
PBA’s Risk Profile Summary
We assign Pembina a Morningstar Uncertainty Rating of Medium. Pembina’s biggest challenges are primarily regulatory, legal, and other stakeholder risks related to identifying and executing projects within its growth portfolio.
The Jordan Cove LNG project and the Keystone XL pipeline are prominent examples of the challenges involved. With the failure of Jordan Cove LNG, as well as the petrochemicals joint venture, the remaining backlog of projects doesn’t have the same level of high-profile challenges.
The addition of the Trans Mountain pipeline could be acquired after the pipeline’s completion in late 2023 and could be such an effort. Given the fierce opposition to the pipeline from various stakeholder communities, we expect to see some level of continued opposition via court challenges while the pipeline is in service.
Material ESG exposures create additional risk for midstream investors. In this industry, the most significant exposures are greenhouse gas emissions (from upstream extraction, midstream operations, and downstream consumption), and other emissions, effluents, pipeline spills, and opposition and protests.
In addition to the reputational threat, these issues could force climate-conscious consumers away from fossil fuels in greater numbers, resulting in long-term demand erosion. Climate concerns could also trigger regulatory interventions, such as production limits and the removal of existing infrastructure. – Morningstar
Pembina’s Risk Profile Includes:
-
economic cyclicality risk: modest cash flow variability in recessions
-
M&A execution risk: PBA likes to make big deals
-
regulatory risk: specifically for new project approvals (Keystone XL is a good example of what can go wrong, and so is TransMountain, which PBA is thinking of buying)
-
failure of the green energy transition plan
-
talent retention risk in the tightest job market in 50 years
-
cyber-security risk: hackers and ransomware (Colonial pipeline hack is an example of what can happen)
-
currency risk: including the dividend
-
geographic risk: PBA is CA focused and CA is potentially planning some very aggressive carbon taxes
Morningstar is one of the more critical analysts regarding PBA’s growth strategy.
-
they consider its M&A-focused growth plans to be riskier than organic growth projects
-
they are skeptical of the KKR venture and believe that PBA’s overall management quality is poor
-
an assessment rating agencies and the overall analyst consensus disagrees with
How do we quantify, monitor, and track such a complex risk profile? By doing what big institutions do.
Long-Term Risk Analysis: How Large Institutions Measure Total Risk
-
see the risk section of this video to get an in-depth view (and link to two reports) of how DK and big institutions measure long-term risk management by companies
PBA Long-Term Risk-Management Consensus
|
Rating Agency |
Industry Percentile |
Rating Agency Classification |
|
MSCI 37 Metric Model |
78.0% |
A, Above-Average, Positive Trend |
|
Morningstar/Sustainalytics 20 Metric Model |
99.0% |
18.5/100 Low Risk |
|
Reuters’/Refinitiv 500+ Metric Model |
89.3% |
Good |
|
S&P 1,000+ Metric Model |
41.0% |
Average, Stable Trend |
|
FactSet |
70.0% |
Above-Average, Positive Trend |
|
Morningstar Global Percentile (All 15,000 Rated Companies) |
80.4% |
Very Good |
|
Consensus |
76.3% |
Low Risk, Good Risk-Management, Stable Trend |
(Sources: Morningstar, FactSet, S&P, Reuters, MSCI)
PBA’s Long-Term Risk Management Is The 115th Best In The Master List (77th Percentile)
|
Classification |
Average Consensus LT Risk-Management Industry Percentile |
Risk-Management Rating |
|
S&P Global (SPGI) #1 Risk Management In The Master List |
94 |
Exceptional |
|
Strong ESG Stocks |
78 |
Good – Bordering On Very Good |
|
Pembina |
76 |
Good |
|
Foreign Dividend Stocks |
75 |
Good |
|
Ultra SWANs |
71 |
Good |
|
Low Volatility Stocks |
68 |
Above-Average |
|
Dividend Aristocrats |
67 |
Above-Average |
|
Dividend Kings |
63 |
Above-Average |
|
Master List average |
62 |
Above-Average |
|
Hyper-Growth stocks |
61 |
Above-Average |
|
Monthly Dividend Stocks |
60 |
Above-Average |
|
Dividend Champions |
57 |
Average bordering on above-average |
(Source: DK Research Terminal)
PBA’s risk-management consensus is in the top 23% of the world’s highest quality companies and similar to that of such other blue-chips as
-
Novo Nordisk (NVO): Ultra SWAN global aristocrat
-
Texas Instruments (TXN): Ultra SWAN
-
Royal Bank of Canada (RY): Ultra SWAN
-
Philip Morris International (PM): Ultra SWAN Dividend King
-
Qualcomm (QCOM): Ultra SWAN
The bottom line is that all companies have risks, and PBA is good at managing theirs.
How We Monitor PBA’s Risk Profile
-
17 analysts
-
2 credit rating agencies
-
6 total risk rating agencies
-
23 experts who collectively know this business better than anyone other than management
When the facts change, I change my mind. What do you do, sir? – John Maynard Keynes
There are no sacred cows at iREIT or Dividend Kings. Wherever the fundamentals lead, we always follow. That’s the essence of disciplined financial science, the math behind retiring rich and staying rich in retirement.
Bottom Line: Pembina Pipeline Is A 5.4% Monthly Dividend Retirees Can Trust
Safe monthly dividend stocks are rare and precious, and that’s why I love recommending them at reasonable to attractive valuations.
Let me be clear; Super SWAN status doesn’t mean a stock can’t fall in a bear market.
-
Safety and quality have zero to do with short-term price volatility
Fundamentals are all that determine safety and quality, and my recommendations.
-
over 30+ years, 97% of stock returns are a function of pure fundamentals, not luck
-
in the short-term, luck is 33X more powerful than fundamentals
-
in the long-term, fundamentals are 33X as powerful as luck
While I can’t predict the market in the short-term, here’s what I can tell you about PBA:
-
PBA is one of the world’s safest, most dependable, and highest quality monthly paying blue-chips on earth
-
top 20% of the world’s best companies
-
5.4% very safe yield, paid monthly
-
12.5% CAGR long-term total return potential, better than the, aristocrats, or S&P 500
-
8% historically undervalued, a potentially reasonable buy
-
9.4X cash flow
-
almost 100% consensus return potential over the next five years, 12% CAGR, 2X more than the S&P 500
-
33% better risk-adjusted expected returns of the S&P 500 over the next five years.
-
3X more consensus income than the S&P 500 over the next five years
If you’re looking for a safe high-yield monthly blue-chip consider Pembina.
If you are seeking a monthly paying inflation hedge, Pembina might be just what you’re looking for.
Are you seeking a safe way to earn both high-yield monthly income today and potentially 19X inflation-adjusted returns over the next 30 years? Then Pembina could be exactly what your portfolio needs.
In a turbulent economy and chaotic and confusing market, this energy utility represents one of the safest and best sources of monthly yield on Wall Street.
Be the first to comment