

Prostock-Studio/iStock via Getty Images
Investment summary
From the Portfolio Manager’s desk
Data-driven research is becoming increasingly important to identify opportunities within the equity spectrum. With the high-beta trade now exhausted, managers can no longer rely on equity positioning to compound capital. Tactical allocations have become essential in order to extract alpha for equity portfolios and avoid drawdown. This means analysing company fundamentals on a basis of quality, in terms of earnings, free cash flow and return on capital.
With that, the market’s punishment of Pediatrix Medical Group, Inc (NYSE:MD) across the past 12 months appears largely unjustified and therefore presents us with an alpha opportunity. The stock looks mispriced and from our previous analysis here I noted there’s a series of upside catalysts that look set to materialise in the coming 12-24 months for the company. Here I’ve noted the additional strengths that illustrate my bullish position in the risk/reward equation. Net-net I’ve decided to increase the equity risk to MD in out equity bucket and value the stock at $33 apiece. The following series of charts helps illustrate these fundamental tailwinds.
Pediatrix earnings quality
As seen in Exhibit 1, the company has continuously grown the top-bottom line on a sequential basis off a low point in FY19, subsequently reversing a heavy contraction period [seen in my previous analysis, see: Exhibit 2]. Operating income has lifted to $55 million (“mm”) in Q2 FY22, up from $40.5mm the previous period, whereas free cash flow (“FCF”) extended up by 560bps since the December 2021 quarter to $75mm.
These growth patterns have been reflected in MD’s bottom-line fundamentals, as seen below. Quarterly earnings have lifted to $0.36 per share and $0.99 on a TTM basis, having lifted up from negative $0.63 in TTM EPS from Q2 FY21. Meanwhile the company has maintained a steady but cyclical FCF conversion, pulling in an average 12-14% FCF margin in 3 out of the last 4 quarters.
Net-net, MD has averaged a c.500bps FCF conversion as a percentage of turnover since Q3 FY20, and so Q2 FY22’s 15.43% FCF margin was above average for the company as well. However, of particular standout is the 3.75% geometric growth in EPS per quarter off the low point in Q4 FY19 – this is commendable in my estimate, and adds a heavy tilt to the risk/reward calculus as I believe it is this kind of earnings quality that will stand out in the coming 12-36 months in equities.
Exhibit 1. The sequential recovery in earnings [that are of good quality i.e. backed by CFFO, free cash flow] exhibits strength in MD’s bottom-line fundamentals.
- I believe these are qualities that will generate alpha in equities into the coming 2-3 years.
- Earnings [and therefore valuation] backed by cash flow and FCF conversion at 15% of turnover in Q2 FY22.
Note: All figures in $mm except in per share. All calculations made from GAAP earnings with no reconciliations. (Data: HB Insights, MD SEC Filings)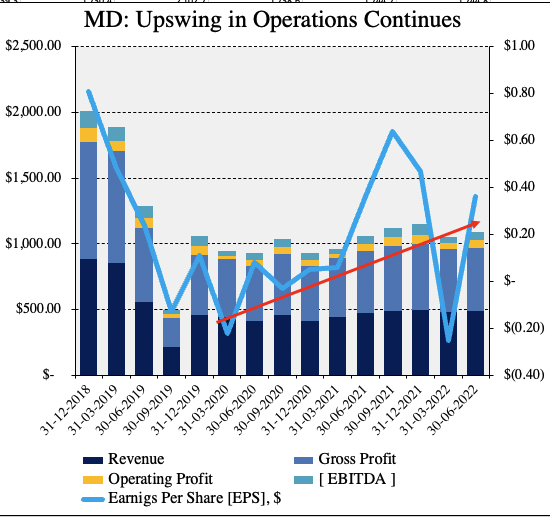
In fact, FCF conversion is a standout in the investment debate by my estimation. As seen in Exhibit 2, MD’s FCF remains steady in a cyclical fashion, and aligns with movements in the company’s capital expenditure[s] (“CapEx”) cycle. The company has averaged $4.03mm in quarterly CapEx spend since Q2 FY20 [note, CapEx in this instance is calculated net of asset dispositions], and allocated a cumulative net $57.13mm in net quarterly CapEx since Q4 FY18 inclusive. Meanwhile, the company has realized $90.7mm in cumulative quarterly FCF and $187mm in CFFO across the same time. Both numbers exhibit a healthy uptick in realized FCF yields across the same time.
Exhibit 2. CapEx cycle well reflected in CFFO and FCF trends with cumulative quarterly FCF surpassing $90mm since FY18
Note: All figures in $mm or [%]. Free cash flow calculated as [ NOPAT – Investments ]. Capital Expenditures [CapEx] calculated net of asset dispositions, and therefore may reflect negative value on net terms. Average CapEx calculated as average of last 2 quarters. FCF yield calculated as a function of enterprise value. (Data: HB Insights, MD SEC filings)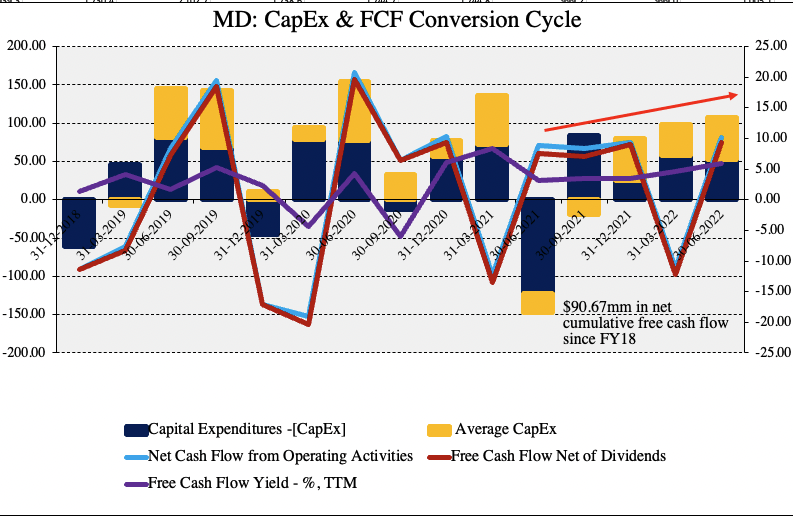
Return on capital equally as supportive
Whilst the above trends in FCF and cash from operations exhibit strength on a long-term trend basis, results have been lumpy from period to period. I’m satisfied with this if the expenditures [CapEx through to FCF] are realized back to the company as a return on investment. Here I benchmark return on invested capital (“ROIC”), return on assets (“ROA”) and asset turnover as a time series to examine MD’s propensity to generate cash. Specifically I wanted to see how much NOPAT the company generated from the previous period’s invested capital, extending from there.
As seen in Exhibit 3, across the growth period outlined above [FY19-date] MD’s return on investments have curled up substantially and now rests at ~12% on a TTM basis. Growth trends here suggest MD is winding up its return on ongoing investments, however, similar growth patterns are observed in the return on its existing investments/assets. ROA and asset turnover have both stretched up during this time and are back above pre-pandemic highs. However, I’d also note that of the company’s c.$2.37 Billion in total assets and $845mm in book value of equity, MD records $1.53 Billion in goodwill from acquisitions [a non-cash, non-amortizable ‘asset’], representing 64.6%/181.3% of assets/shareholder equity respectively.
Exhibit 3. Return on ongoing and existing investments continuing to stretch up on a sequential basis [quarterly and TTM basis].
Note: All figures in $mm or [%]. All calculations made using GAAP earnings with no reconciliations. (Data: HB Insights, MD SEC Filings)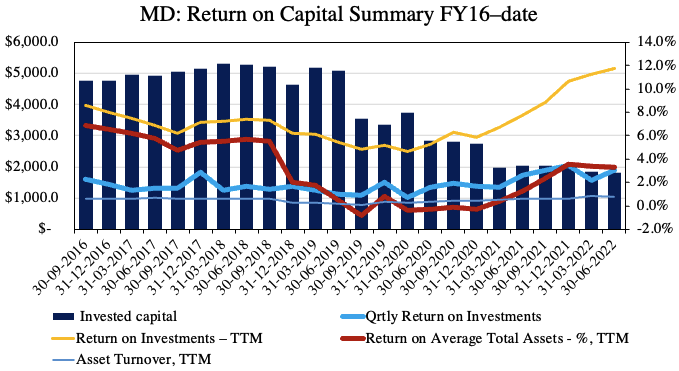
A point noted above is that the company’s FCF conversion has been lumpy on a sequential basis since at least FY16. As seen below, both the distribution and absolute value of MD’s FCF has tightened substantially across this time, plateauing on average at ~$50-$60mm since FY20. This includes a few negative periods as well. However, with the contraction in available free cash there’s been the corresponding uptick in return on capital for the company. This is a favourable characteristic that aligns with our US equity strategy, seeking out long-term cash compounders with loads of idiosyncratic risk premia to buy into. MD exhibits this in my estimation.
Exhibit 4. FCF distribution contracting [with negative prints] but this is being realized back in return on invested capital.
Data: HB Insights, MD SEC filings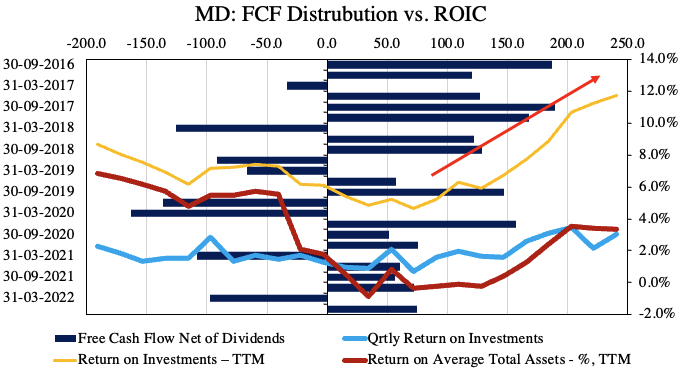
Again, this kind of fundamental momentum isn’t being reflected in the MD share price in my estimate, creating the alpha opportunity. The question turns to whether the market will reward MD for the same.
Valuation and conclusion
So far the two standouts are the growth trends in MD’s earnings and return on investments. Shares are also trading at an attractive to GICS Industry peers across key multiples used in this analysis, as seen in Exhibit 5. Trading at 13.5x trailing earnings and 1.6x book value are especially attractive relative to the peer group, and to self-averages. In particular, the company’s 13.14% trailing return on equity (“ROE”) is a standout given the growth in earnings over the last 3 years. At 1.6x book value, the investor ROE is 8.1%, and represents reasonable value in my estimation – firstly, it’s above the SPX’s current 5.3% earnings yield, and the equity duration is 8.8 years vs. the SPX’s 13.6 years. In my estimation, this represents attractive value.
Exhibit 5. Multiples and comps.
Data: HB Insights, Refinitiv Datastream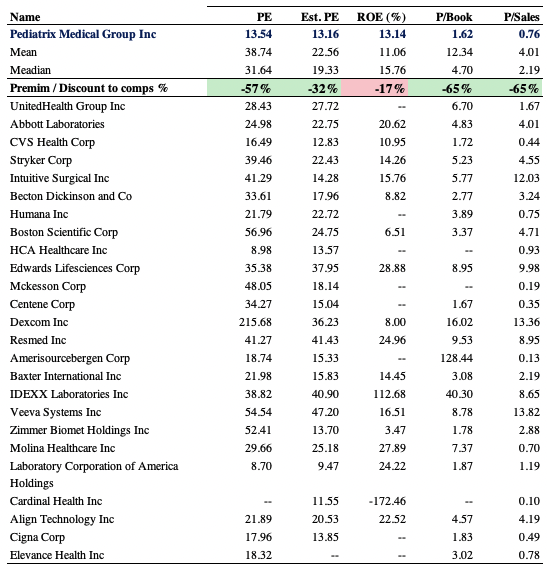
From deeper analysis of the numbers I believe MD has the economic pillars to re-rate to the upside. I’d previously valued MD at $33 on a blend of inputs and I stand by this based on the company’s growth trends at the bottom line to date. This prices MD at ~17x forward earnings, above the consensus 13x forward P/E. Nevertheless, I believe the market consensus has unfairly discounted the company’s earnings and ROI growth and that MD’s dislocation in fundamentals to stock price represents an alpha opportunity. Net-net, I rate MD a buy on a $33 valuation.
Be the first to comment