

JamesBrey/iStock via Getty Images
I’m Not A PermaBull But I’m Bullish Now
The PIMCO family of closed-end funds gets a lot of attention on Seeking Alpha due to their high dividend yield and good long-term performance, despite high fees. The last year has been a tough one for these funds as they each posted a negative total return in the -6% to -8% area even after including dividends.
Seeking Alpha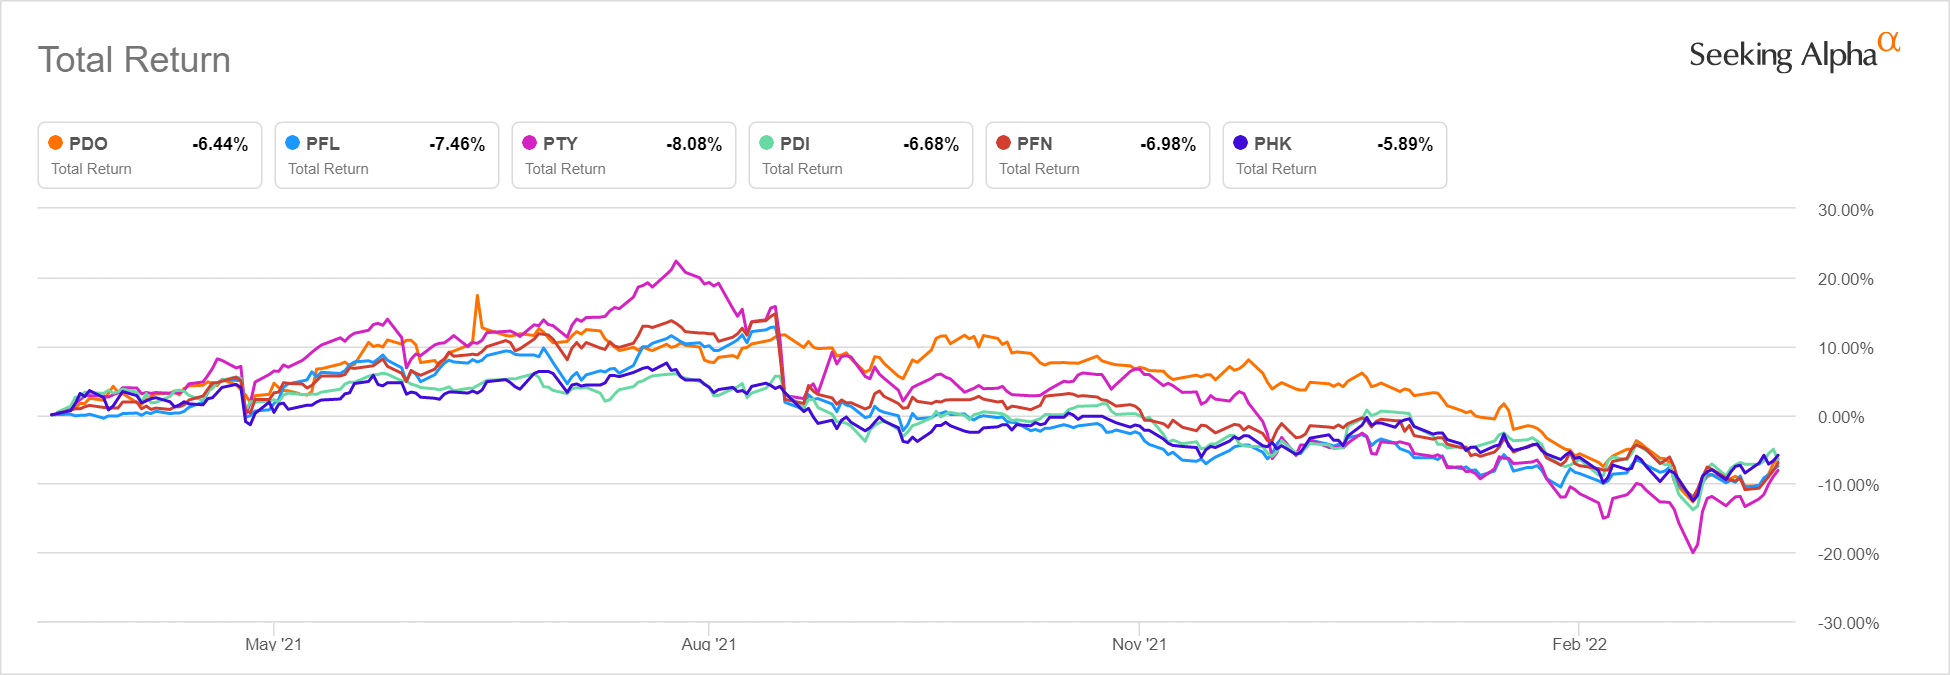
Bullish writers recommended some of these funds all the way down since last summer in the face of impending interest rate tightening and declining investor sentiment. Fund premiums to NAV declined considerably. One, the PIMCO Dynamic Income Opportunities Fund (NYSE:PDO) went all the way into discount territory.
It’s been exactly one year since I went cautious on these investments. Specifically, I put a Sell rating on the PIMCO Income Strategy Fund (PFL) in April 2021 which I restated in September 2021 even after the drop following a dividend cut. I was less bearish on PDO in those articles but it only did 1 percentage point better.
As I pointed out more recently however, once the first Fed Funds rate increase happens, a lot of negativity is already priced in and the closed end funds typically hit a bottom. For example, in the last rate hiking cycle which ran from 2016-2018, the PIMCO Dynamic Income Fund (PDI) bottomed shortly after the start of the cycle and outperformed unleveraged and lower risk funds even as the Fed kept raising the Funds rate. I use PDI as a proxy because PDO did not start trading until January 2021.
Seeking Alpha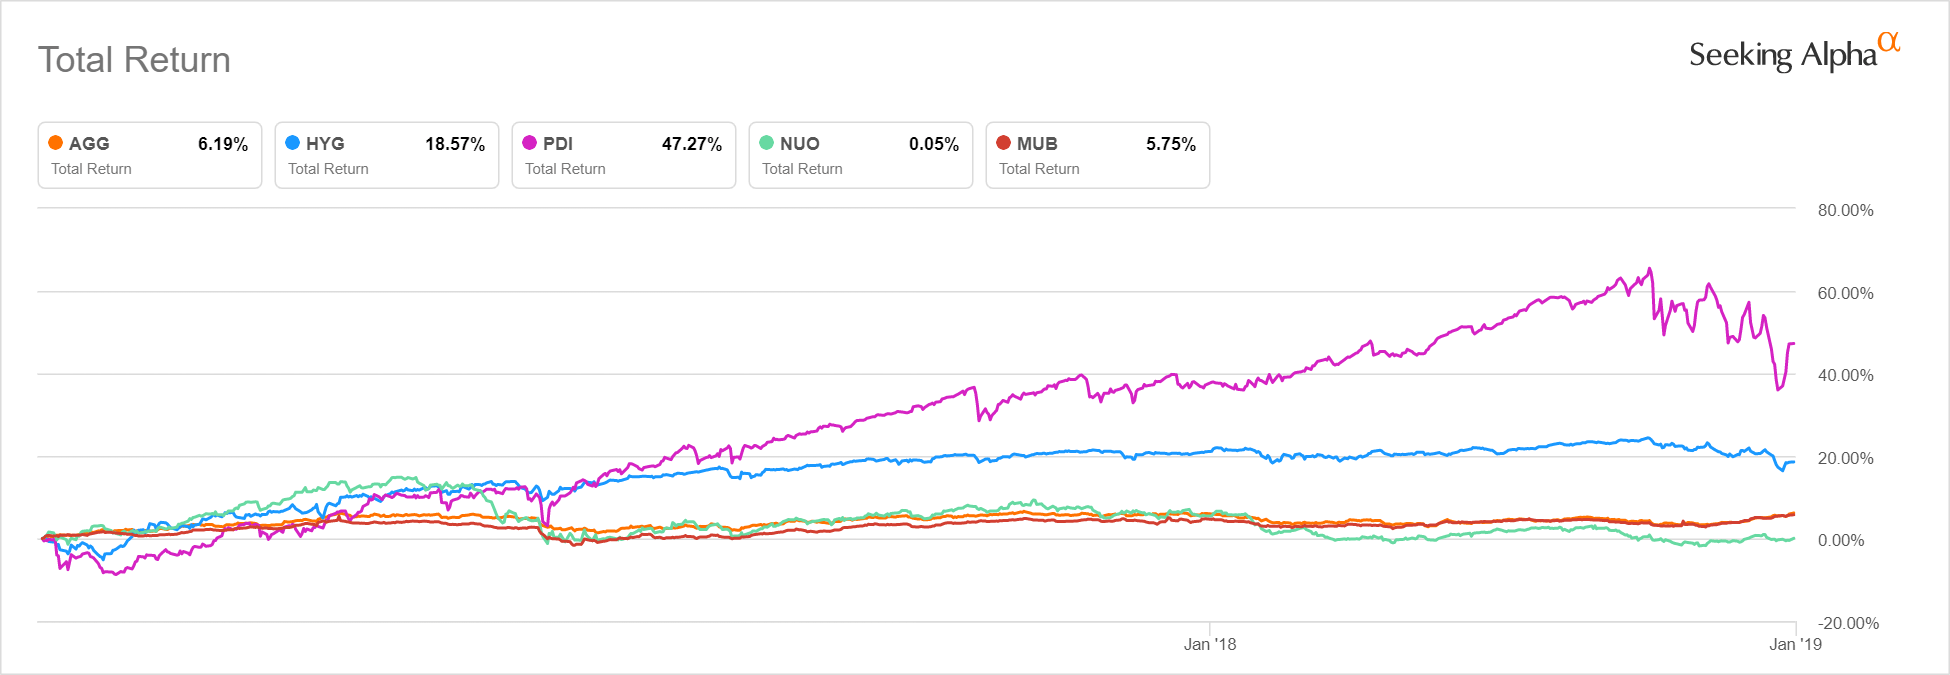
This happened because other interest rates typically run up ahead of the first Fed Funds rate hike, but also because sentiment bottoms around the time of the first increase. In the last cycle, PDI’s discount to NAV bottomed in late 2015 and flipped to a premium which increased through the tightening cycle. Premiums declined again over the past year in anticipation of rate increases.
Author Created (Data Source: PIMCO)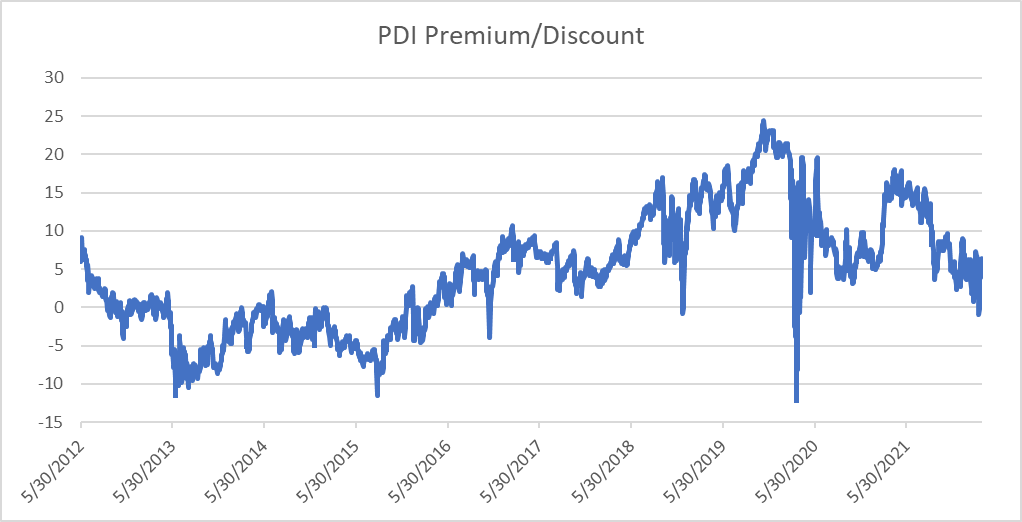
After being cautious for the past year, the timing now looks right to increase positions in the PIMCO funds, and PDO is the best value.
Why PDO?
Investors only concerned with maximizing income might overlook PDO because its $0.1184 monthly payout works out to 8.3%. This is at the low end of the PIMCO taxable CEF’s. For those who reinvest dividends however, we see from the first chart above there was little difference in total returns in the past year although PDO was among the least bad.
The stated yield is deceptive though, because PIMCO set it conservatively when the fund was rolled out in January 2021. As a result, the fund built up undistributed net investment income over the first year of operations, paying out an additional $0.49 in December. That takes the trailing yield up to 11.2%. Since the special dividend payment, PDO managed to accumulate another $0.25 of UNII through February, the highest in the PIMCO family.
Another advantage of PDO is its maturity profile. As of 2/28, the fund had over 34% of its holdings in the 0-1 year maturity range. In an increasing rate environment, this allows management to quickly replace maturing investments with higher-yielding ones. The fund’s effective duration was low at 3.37 years which should also make it less susceptible to increasing rates.
PIMCO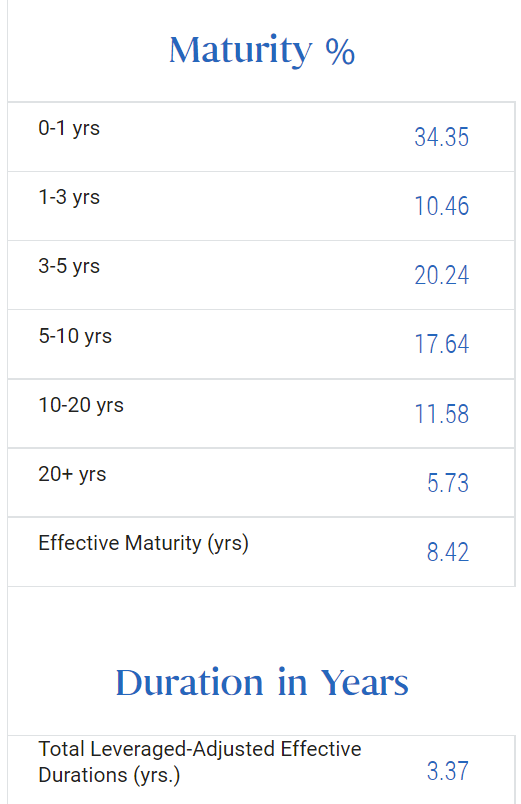
For comparison, PTY had 15.66% of the portfolio maturing within one year and PFL had only 8.56%.
PDO is also trading 5.4% below Net Asset Value. This is the second-best discount of the PIMCO family with only the newly issued fund (PAXS) cheaper at -6.2%. The more seasoned PIMCO funds all still trade at a premium to NAV. For example, PDI is at a premium of 4.9%, PFL is at 5.8%, and PTY is still at 17.7%.
What About Leverage?
This is the point where the permabulls would leave you with a stock photograph of a model nuzzling a piggy bank or doing the “Thinker” pose atop a pile of cash. In a more balanced analysis, we do need to address the concern of leverage. At 45.4% leverage, PDO is a little below PTY and PDI, but more leveraged than PFL and PFN in the 34%-35% area. A little math will show however, that this leverage is manageable, even with increasing short term interest rates raising the cost. The numbers are not exact, but close enough to illustrate the point.
The fund website has a spreadsheet of all the holdings as of 12/31/2021. For each holding, they list the coupon in Column C, the face value in Column G, and the current asset value in Column I which feeds into the calculation of NAV. Also if we add up the percentages of NAV in Column K, we see that investments total about 183% while the reverse repos and swaps used for leverage make up about -83%. (83/183 equals the 45.4% reported leverage ratio of the fund.) If we do a weighted average of the coupon times the rate divided by the current value for all investments, we see that the unlevered investments produced a yield of around 5.3%. If we do the same calculation with the list of reverse repos used for leverage, we see the cost was around 0.5%. From the interest rate on investments and the cost of leverage, we see the fund was earning a levered 9.3% on NAV. Since PDO was paying a dividend yield of only 7.3% at the time, the dividend was 126.8% covered. This calculation is in line with the UNII report.
| 12/31/2021 | weighting | inc. yield | Dividend | NAV | Market | |
| investments | 183% | 5.30% | ||||
| repos/swaps | -83% | 0.50% | ||||
| 100% | 9.3% | $ 1.4208 | $19.40 | $19.56 | ||
| div. yield | 7.3% | 7.3% | ||||
| leverage | 45.4% | coverage | 126.8% |
Moving to current conditions, the fund is at a similar leverage ratio, but the NAV has fallen from $19.40 at year-end to $18.08 on 4/1/22. We don’t know exactly what the current investments are, but as a simplifying assumption, let’s say they are the same as on 12/31/21. (This should be a worst case, since we hope management has traded into higher-yielding investments, at least for those holdings that matured in the last quarter.) In that case, the yield on investments should have increased by a similar amount to the drop in NAV, meaning the fund’s investments would now be yielding 5.69%. If the average reverse repo rate has increased to 2.5% from 0.5%, that implies the fund is earning a levered 8.3% on NAV. Since the dividend payout has not changed, coverage has dropped to 106%.
| 4/1/2022 | weighting | inc. yield | Dividend | NAV | Market | |
| investments | 183% | 5.69% | ||||
| repos/swaps | -83% | 2.50% | ||||
| 100% | 8.3% | $ 1.4208 | $18.08 | $17.11 | ||
| div. yield | 7.9% | 8.3% | ||||
| leverage | 45.4% | coverage |
106.0% |
While coverage has declined, it is still comfortably over 100%. Reverse repo rates would need to exceed 3.0% before the coverage calculated by this model drops below 100%. Also, don’t forget that the fund still has $0.25 of UNII with 10 months to go until December. Theoretically, coverage could drop to around 75% and the fund could cover the existing dividend by drawing on UNII. In that case, even higher cost of leverage could be accommodated. In reality, UNII can fluctuate up and down month to month because of currency exchange rate movements and other issues. Nevertheless, PIMCO appears to have set the PDO dividend at a safe rate that can withstand higher leverage costs.
Conclusion
After a tough year for leveraged high yielding CEF’s, they could be near a bottom based on historical performance during Fed Funds tightening cycles. PDO looks especially attractive due to its discount to NAV and ability to cover the dividend. After trimming my overall CEF position a year ago and further selling a portion of my PDO in January, I recently added back the shares from the January sale at a 15% lower price.
Be the first to comment