

RHJ/iStock via Getty Images
Introduction
Vancouver-based Pan American Silver Corp. (NASDAQ:PAAS) released its fourth-quarter and full-year 2021 results on February 23, 2022.
Note: This article is an update of my article published on February 3, 2022, in which I have analyzed the gold production for the fourth quarter and full-year 2021. This new article is a complete review of the fourth quarter and full-year 2021 results, including gold production and balance sheet.
PAAS Highlights 2021 Presentation (Pan American Silver)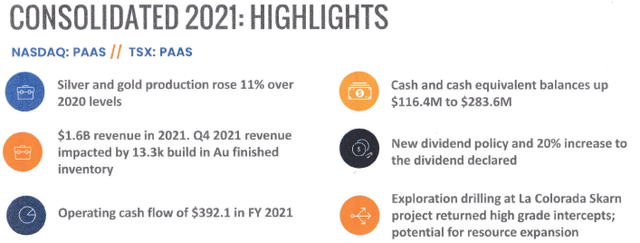
1 – 4Q21 and full-year result snapshot
PAAS reported a lower-than-expected fourth-quarter 2021 adjusted earnings per share of $0.19 compared with adjusted earnings per share of $0.43 in the year-ago quarter. The company reported earnings per share of $0.07 in the fourth quarter.
Pan American Silver’s revenues were down 1.9% year-over-year to $422.17 million in 4Q21. Michael Steinmann, President and Chief Executive Officer, said in the press release:
Q4 2021 marked a clear improvement in production and Silver Segment costs over the first three quarters of the year, contributing to cash flow from operations in the quarter of $118.1 million,
Furthermore, the 2022 guidance is backed-end loaded to H2 2022, and he said:
Our guidance for 2022 assumes the COVID-19 impact will diminish over the course of the year, while incorporating the effect of lower workforce deployment levels in January and February due to the Omicron variant. We are evaluating strategic alternatives for Morococha and have excluded the mine from our 2022 guidance while placing the operation on care and maintenance.
Before starting my analysis, let me explain that Pan American Silver is more a gold miner than a silver miner after acquiring Tahoe in 2019. This situation will remain valid until the eventual restart of the Escobal mine year.
Revenues from gold represented 60% of the total revenues in 2021. However, the total mineral reserves for silver represent 48%, whereas gold is 29%.
Thus, while following the silver price to determine your trading strategy for PAAS, it is crucial to factor in the gold price in your strategy.
2 – Investment thesis
I consider PAAS an excellent long-term investment in the gold and silver segment. But, the stock has been a disappointment for the past six months and has underperformed significantly.
My guess is that PAAS tends to trade in relation to silver, despite what I said earlier. The next catalyst should be the restart of the Escobal mine that I expect next year.
Thus, it is essential to trade short-term LIFO as a significant part (about 50%) of your total position. The stock is very volatile, and trading the “waves” can significantly provide an excellent profit and reduce the risks.
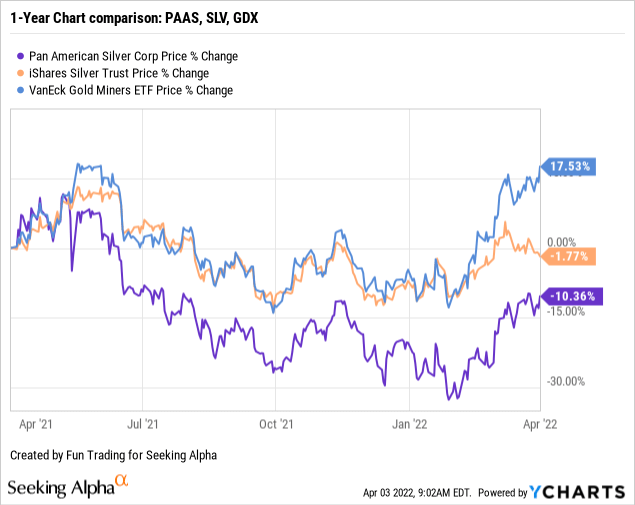
3 – Stock performance: PAAS is still underperforming
PAAS suffered a steep selloff the past few months and is now down 10% on a one-year basis. PAAS is underperforming both iShares Silver Trust (SLV) and the VanEck Vectors Gold Miners (GDX).
CEO Michael Steinmann said in the conference call:
Revenue in 2021 totaled $1.6 billion. In addition to relatively strong metal prices, production recovered from 2020 levels when all but our Timmins operations in Canada faced temporary government-mandated suspensions related to COVID-19. The market improvement in production late in Q4, 2021 led to an increase in finished product inventories by approximately $22 million, which were not booked in revenue for the quarter.
PAAS – Balance Sheet And Production In 4Q21 – The Raw Numbers
| Pan American Silver | 4Q20 | 1Q21 | 2Q21 | 3Q21 | 4Q21 |
| Total revenue in $ Million | 430.46 | 368.10 | 382.13 | 460.35 | 422.17 |
| Net income in $ Million | 168.89 | -7.80 | 70.94 | 20.25 | 14.04 |
| EBITDA $ Million | 239.86 | 106.55 | 170.16 | 159.11 | 120.10 |
| EPS diluted in $/share | 0.80 | -0.04 | 0.34 | 0.10 | 0.07 |
| Operating cash flow in $ Million | 170.57 | 29.85 | 87.14 | 157.02 | 118.10 |
| CapEx in $ Million | 53.64 | 47.97 | 63.17 | 62.19 | 70.15 |
| Free cash flow in $ Million | 116.94 | -18.12 | 23.97 | 94.83 | 47.95 |
| Total cash $ Million | 279.06 | 206.41 | 240.37 | 315.45 | 335.27 |
| LT debt in $ Million | 0 | 0 | 17.0 | 12.75 | 11.90 |
| Dividend per share in $ | 0.07 | 0.07 | 0.10 | 0.10 | 0.12 |
| Shares outstanding (diluted) in Million | 210.38 | 210.26 | 210.30 | 210.42 | 210.45 |
| Gold/Silver Production | 4Q20 | 1Q21 | 2Q21 | 3Q21 | 4Q21 |
| Gold production K Oz | 152.9 | 137.6 | 142.3 | 142.6 | 156.7 |
| Silver production M oz | 4.872 | 4.583 | 4.484 | 4.831 | 5.276 |
| AISC $/Oz by-product Silver | 10.37 | 16.99 | 16.36 | 16.30 | 13.57 |
| Gold price realized $/Oz | 1,874 | 1,788 | 1,809 | 1,782 | 1,792 |
| Silver price realized $/Oz | 24.72 | 26.41 | 26.88 | 24.16 | 23.33 |
Data Source: Company filings
Part 1 – Silver And Gold Production Details For The Fourth Quarter Of 2021
1 – Total Gold/Silver production
1.1 – Quarterly production was 156.7K Au Oz and 5,276K Ag Oz
Note: Preliminary production results were previously reported on January 19, 2022.
PAAS: Chart quarterly gold and silver production history (Fun Trading)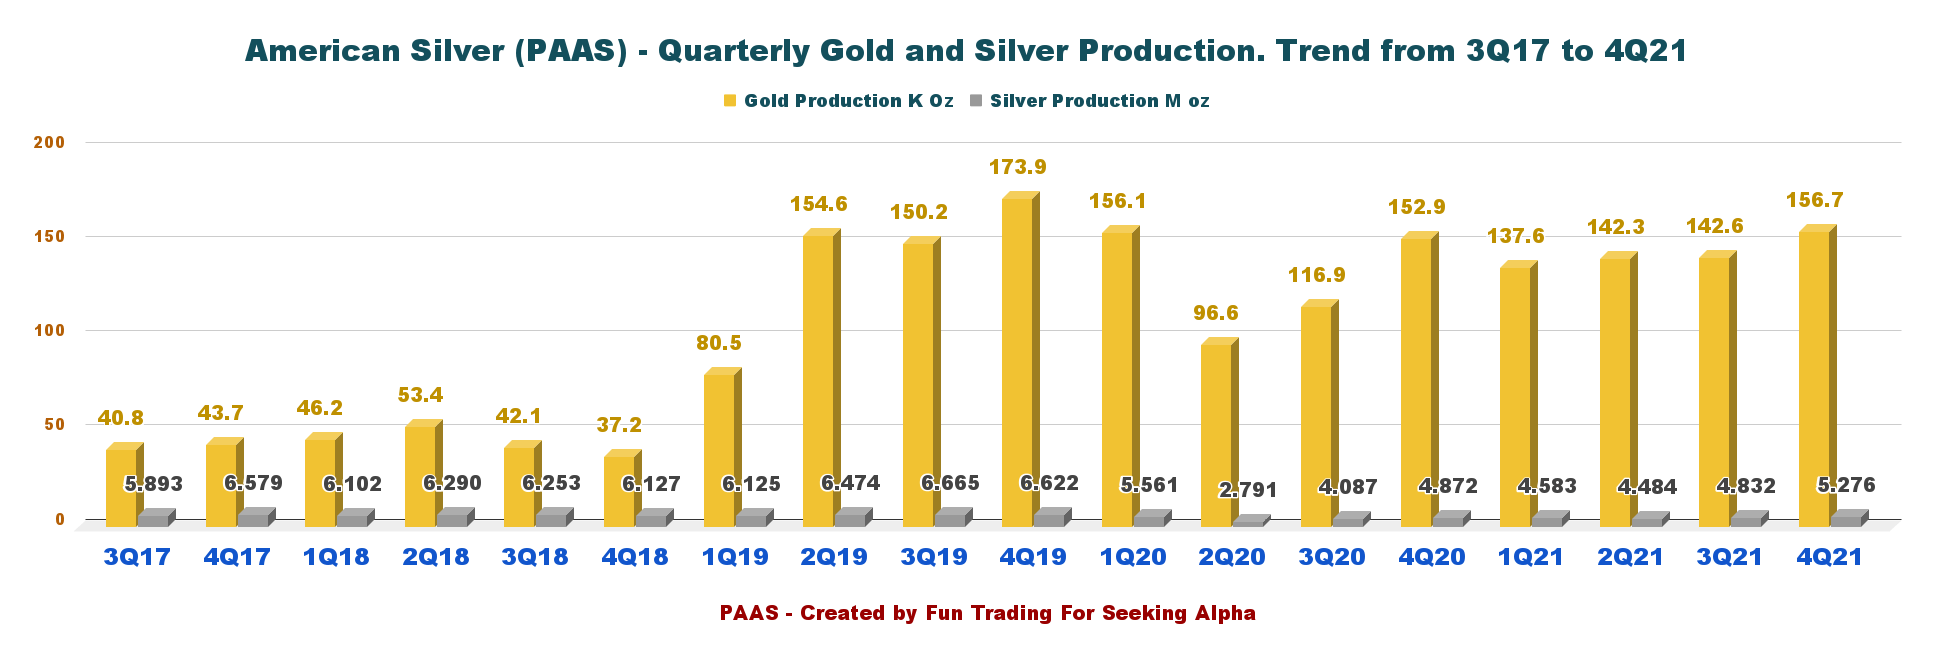
PAAS’s gold and silver production for the 4Q21 and full-year 2021 were within the revised guidance range.
1.2 – Details per mine below
PAAS: Chart production gold and silver per mine in 4Q21 (Fun Trading)
Morococha mine has been placed on care and maintenance:
we will be placing the Morococha operation on care and maintenance as we evaluate alternative opportunities, including monetization, joint venture operation of the asset, or accelerating exploration of prospective areas that could enhance the attractiveness of allocating capital to build a new processing facility.
1.3 – The company produced zinc, lead, and copper, as indicated below
PAAS: Chart co-products in 4Q21 (Fun Trading)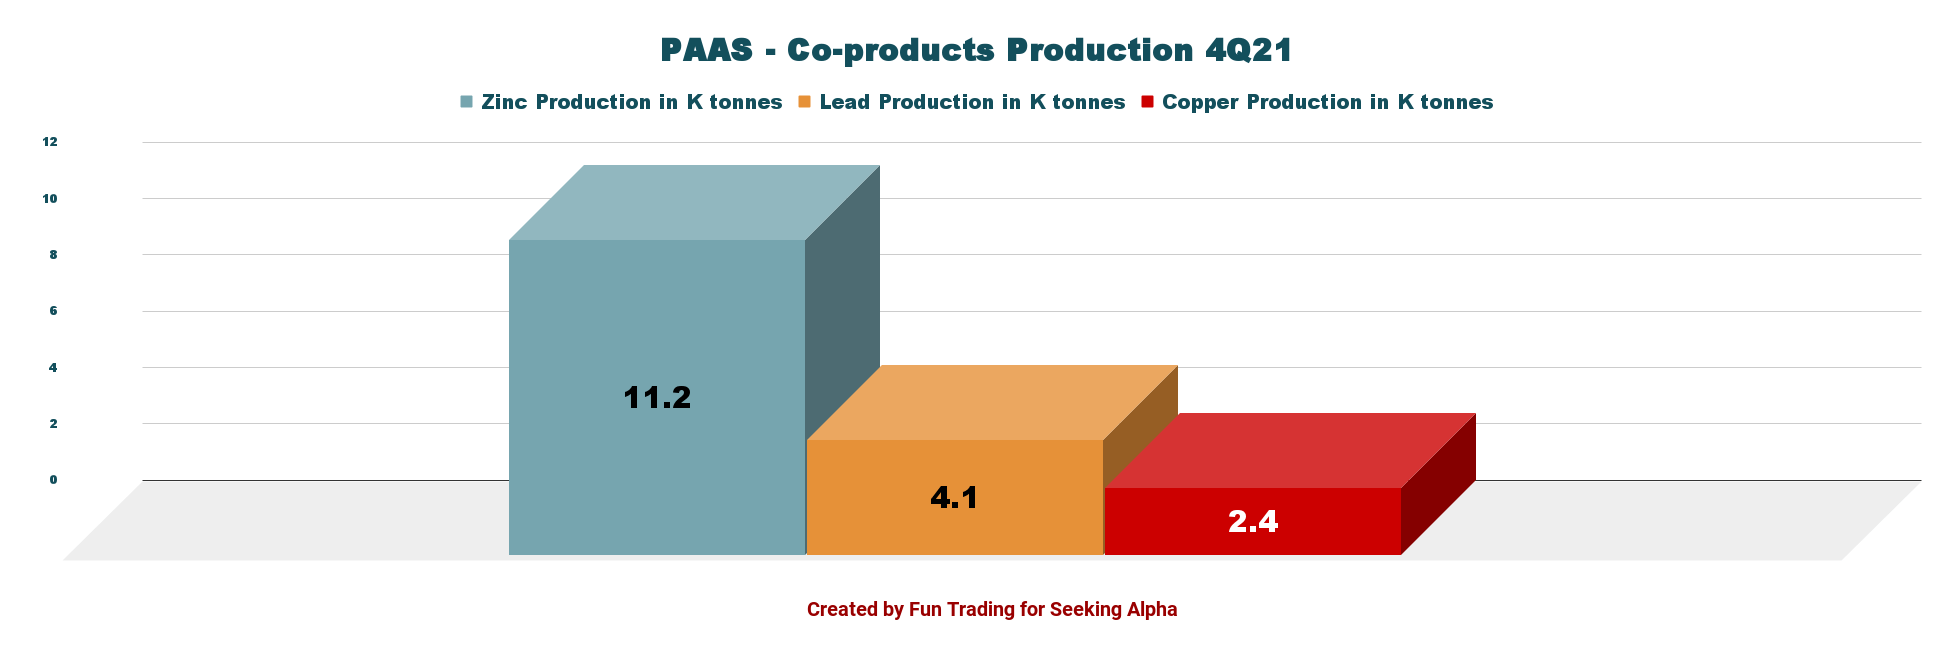
Silver Segment Cash Costs and All-in Sustaining Costs (“AISC”) per silver ounce was $13.57. Gold AISC was $1,176 per ounce.
PAAS: Chart comparison AISC and Gold price (Fun Trading)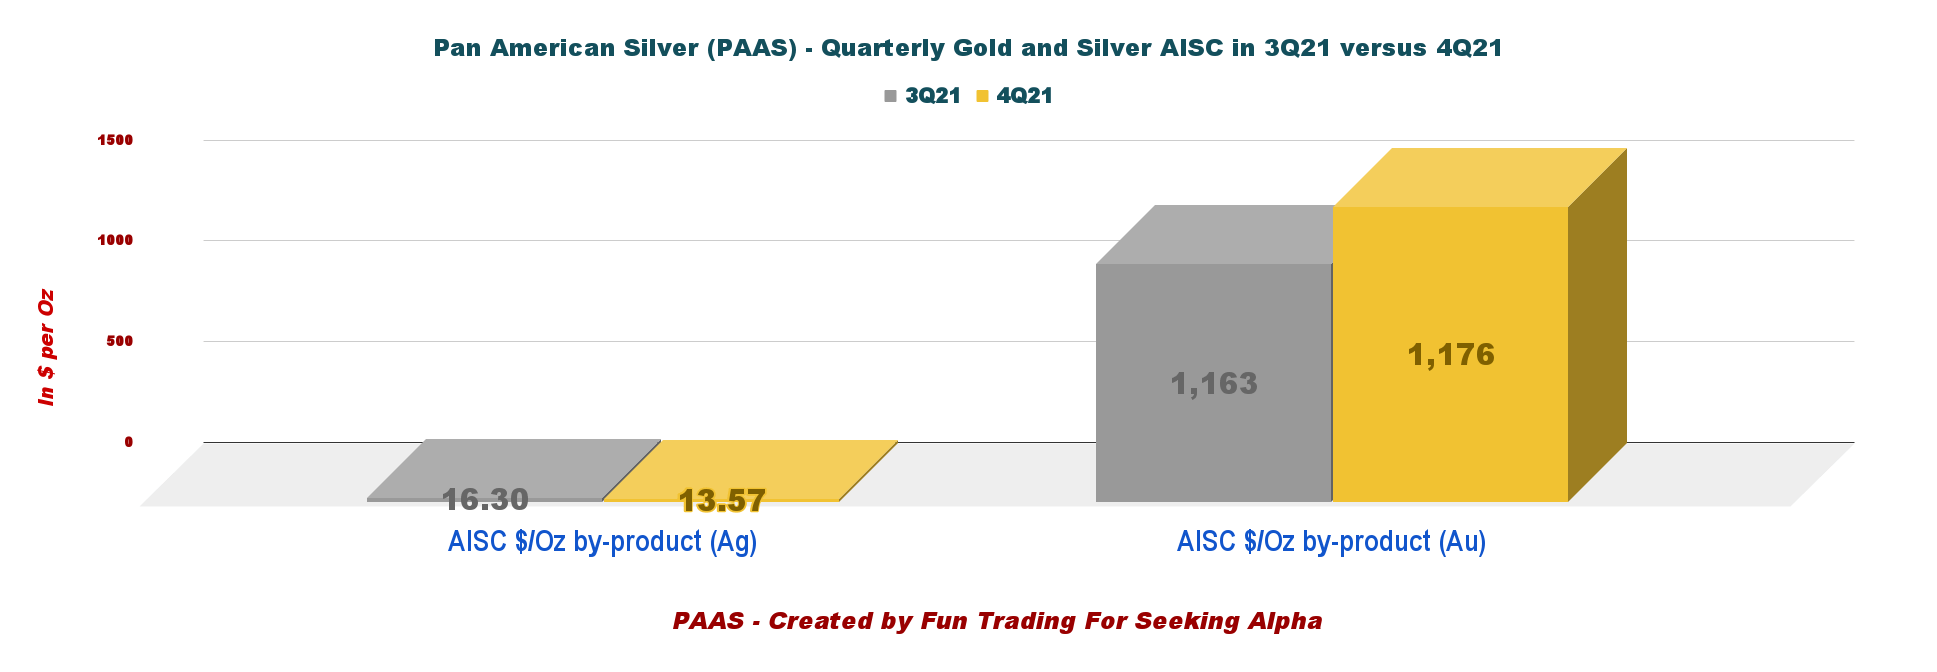
1.4 – Escobal mine encouraging news: The Contingent Value Right (CVR) trading under PAASF has gained traction lately
Patience is required here for shareholders who own the contingent value right (“CVR”), trading under PAASF in the OTC. The stock closed at $0.83.
On March 31, 2022, we learned from Bnamericas:
Guatemalan authorities expect to complete a court-ordered consultation at Pan American Silver’s Escobal mine within months, paving the way for a restart at the suspended operation. Following the successful conclusion of a similar consultation with indigenous communities at Solway Investment Group’s Fénix nickel mine earlier this year, the energy and mines ministry (MEM) expects to conclude four further processes this year, including at Escobal, where the consultation is advancing satisfactorily, minister Alberto Pimentel was quoted as saying by government newsletter Central American Diary.
Assuming that what has been written above is true, the Escobal mine could finally restart in 2023 or earlier. It will take about a year or two, but adding some PAASF below $0.79 may be a good opportunity, but you must tame your optimism. A lot can still go wrong.
Below is the TA Chart:
PAASF: TA Chart (Fun Trading)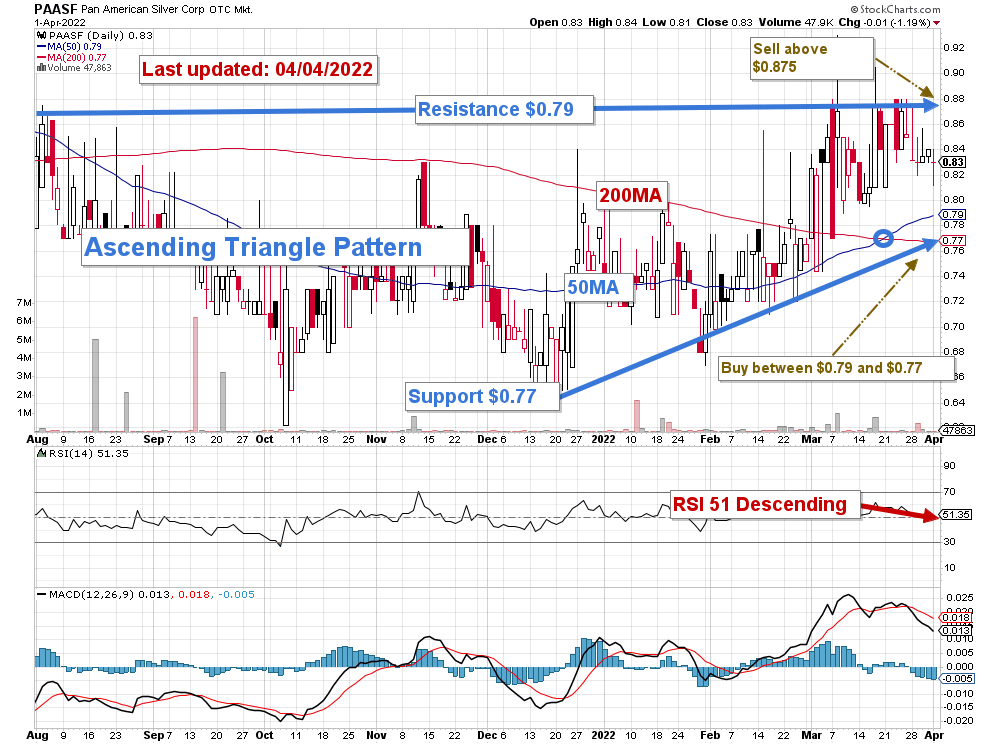
2 – 2022 guidance
The company expects 19.0 Moz-20.5 Moz for silver and 550K-605K Oz for gold. For base metals, see the table above.
Silver segment cash costs are anticipated to be $10.7-$12.20 per Ag ounce, and AISC for silver is $14.50-$16.00.
PAAS: 2022 guidance presentation (Pan American Silver)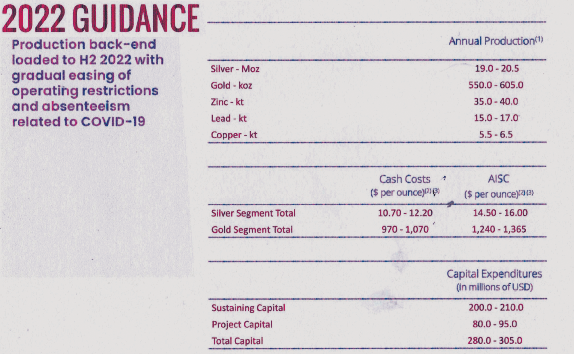
Part 2 – Pan American Silver: Financial Analysis
1 – Total revenue was $422.17 million in 4Q21
PAAS: Quarterly revenues history (Fun Trading)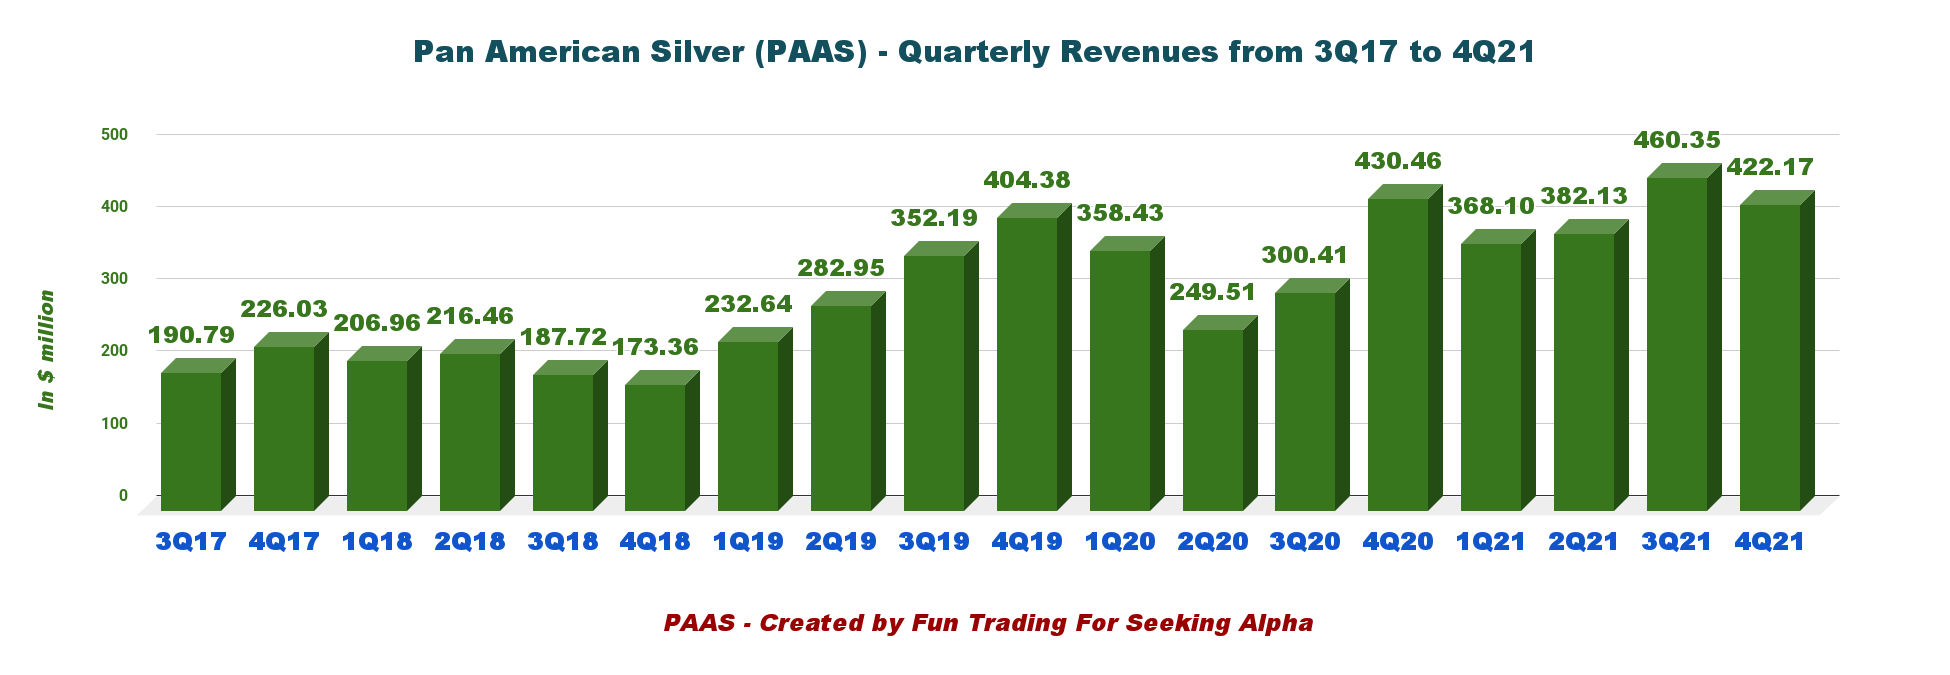
The Canadian company reported a fourth-quarter income of $14.04 million ($0.07 earnings per diluted share).
Revenues were $422.17 million in 4Q21, down 1.9% from the same quarter last year, and $1.6 billion for FY 2021. Unfortunately, revenues in 4Q21 were impacted by the timing of sales, with a 13.3K ounce build in gold-finished goods inventory.
The adjusted income was $39.94 million or $0.19 basic adjusted earnings per share compared to $89.89 million or $0.43 per share last year.
2 – Free cash flow estimated was $47.95 million in 4Q21
PAAS: Quarterly free cash flow history (Fun Trading)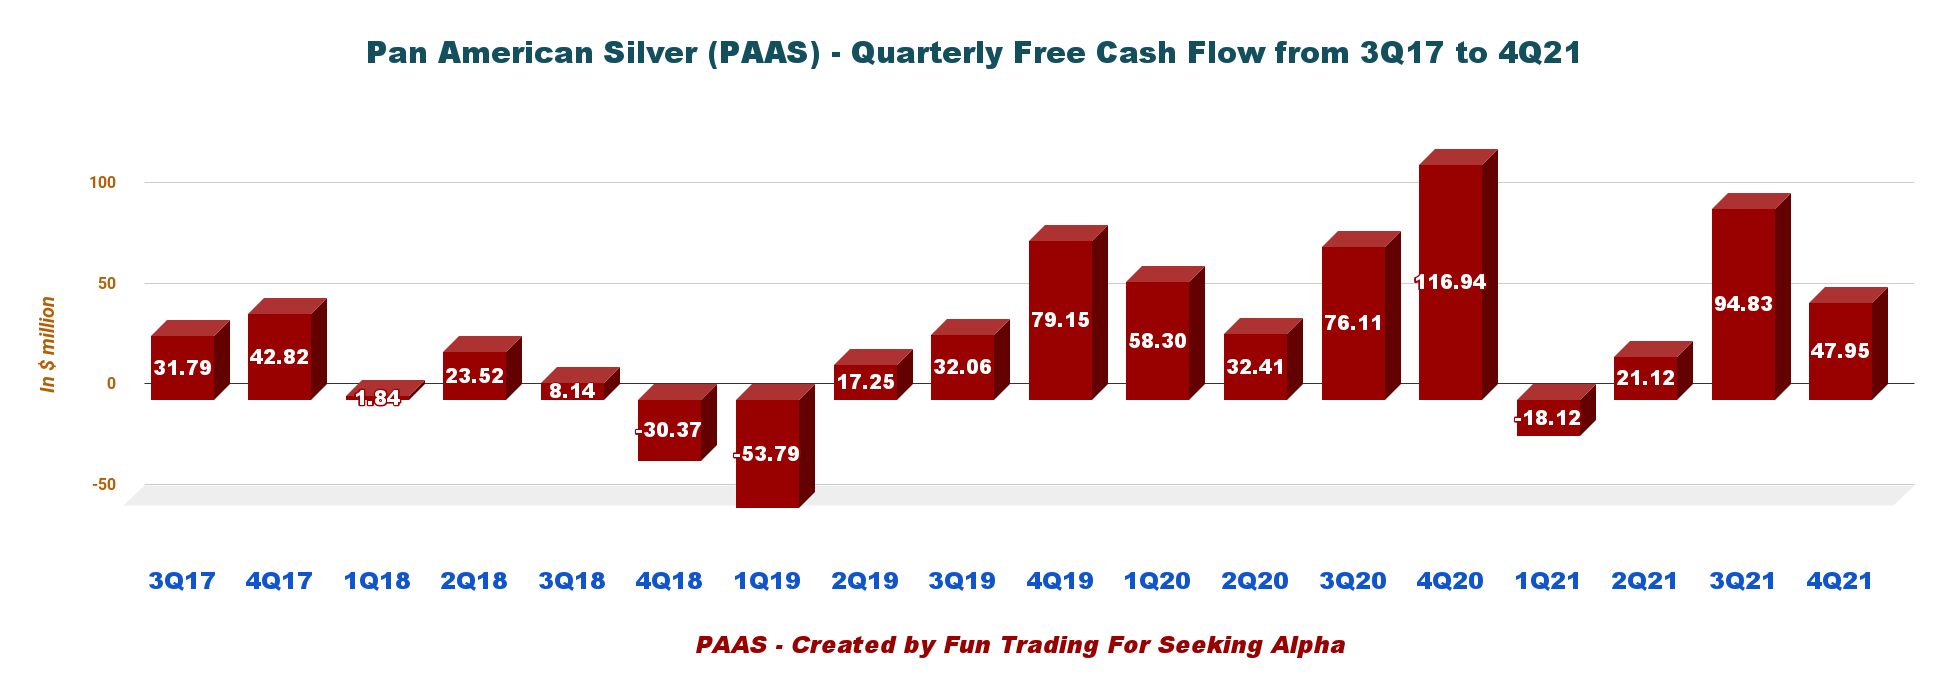
Note: Generic free cash flow is the cash flow from operation minus CapEx.
Trailing 12-month free cash flow is $148.63 million, with $47.95 million in the fourth quarter of 2021.
The Board of Directors has approved a 20% increase in the cash dividend to $0.12 per common share in 4Q21.
3 – PAAS is net debt-free, and the total cash is up to $335.27 million in 4Q21. LT debt was $11.90 million.
PAAS: Chart quarterly cash versus debt history (Fun Trading)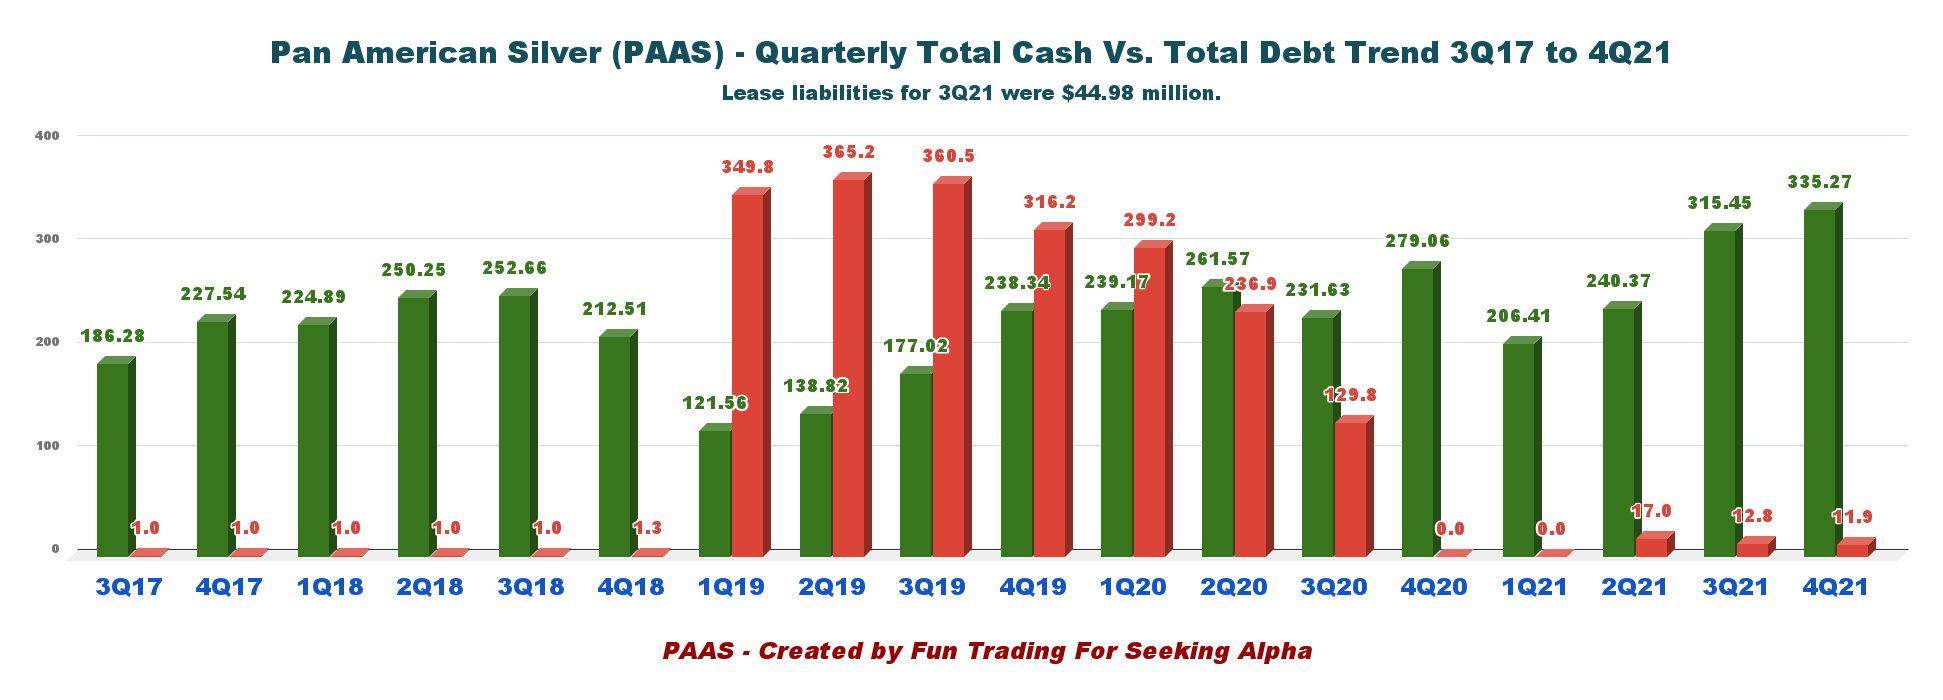
As of December 31, 2021, the company had cash and short-term investment balances of $335.27 million.
PAAS has $500.0 million available under its revolving credit facility. Limited LT debt of $11.90 million and $42.5 million is related to leasing liabilities and construction loans.
PAAS: Liquidity 4Q21 presentation (Pan American Silver)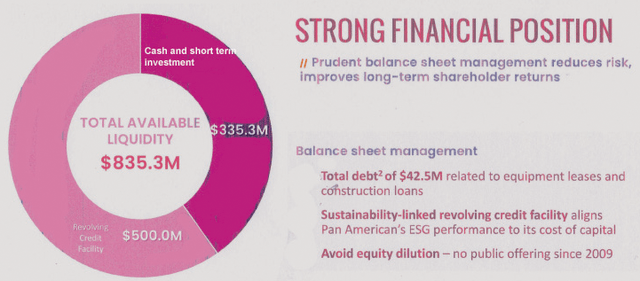
Part 3 – Technical Analysis And Commentary
PAAS: TA Chart (Fun Trading)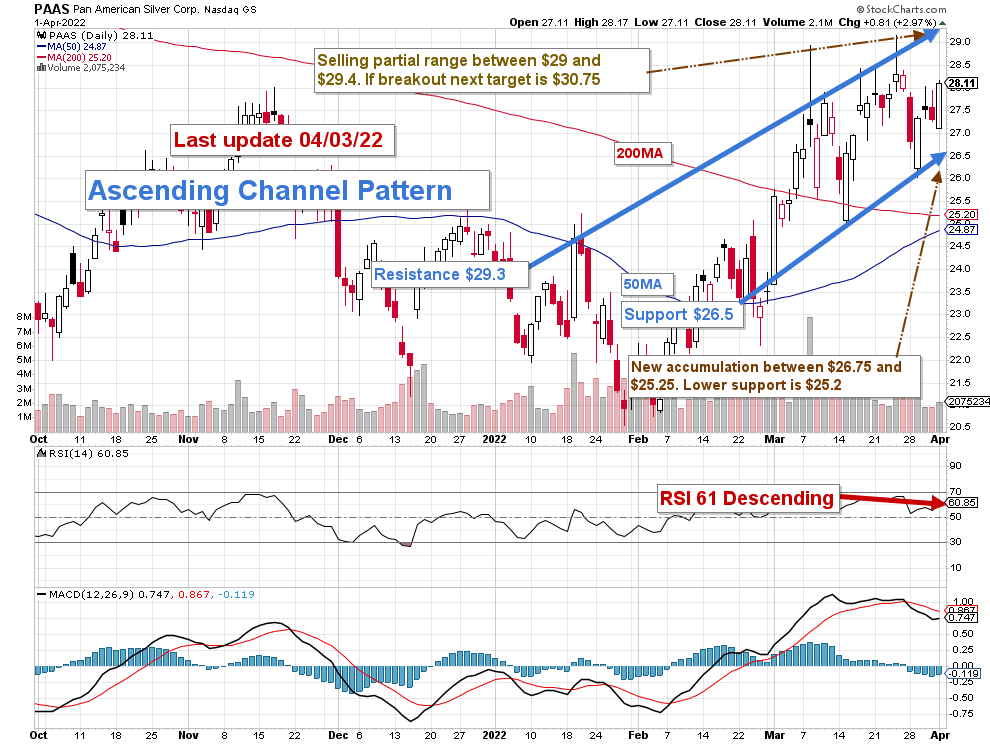
Note: The chart is adjusted for the dividend.
PAAS forms an ascending channel pattern with resistance at $29.3 and support at $26.5. The trading strategy is to trade LIFO about 30%-40% of your position and keep a core long-term position for a target of $35.
I recommend accumulating PAAS at or below $26.75 and selling about 20% of your position between $29 and $29.4. If the gold price stays bullish above $1,950 per ounce, the next target is $30.75, assuming silver follows. Conversely, if the gold price turns bearish due to the Fed’s hawkish action against inflation, then I think PAAS could drop to $25.20.
Watch gold and silver prices like a hawk.
Warning: The TA chart must be updated frequently to be relevant. It is what I am doing in my stock tracker. The chart above has a possible validity of about a week. Remember, the TA chart is a tool only to help you adopt the right strategy. It is not a way to foresee the future. No one and nothing can.
Note: If you find value in this article and would like to encourage such continued efforts, please click the “Like” button below as a vote of support. Thanks!
Be the first to comment