

mathieukor
Introduction
Vancouver-based Pan American Silver Corp. (NASDAQ:PAAS) released its third-quarter 2022 results on November 9, 2022.
Note: I have been covering PAAS regularly quarterly since June 2019. This article is an update of my preceding article, published on August 13, 2022.
1 – 3Q22 results snapshot
PAAS reported a loss per share of $0.34 in the third quarter of 2022, or $71.53 million, missing analysts’ expectations, compared to an income of $0.10 a year ago.
Pan American Silver’s revenues were down 26.4% year-over-year to $338.89 million in 3Q22.
The guidance for gold production has been reaffirmed. However, production for silver is now expected to be between 18.0 to 18.5 Moz in 2022. The revision in estimated 2022 silver production is mainly due to lower output at Dolores and mine sequencing at La Colorada.
PAAS 3Q22 Takeaway (PAAS Presentation)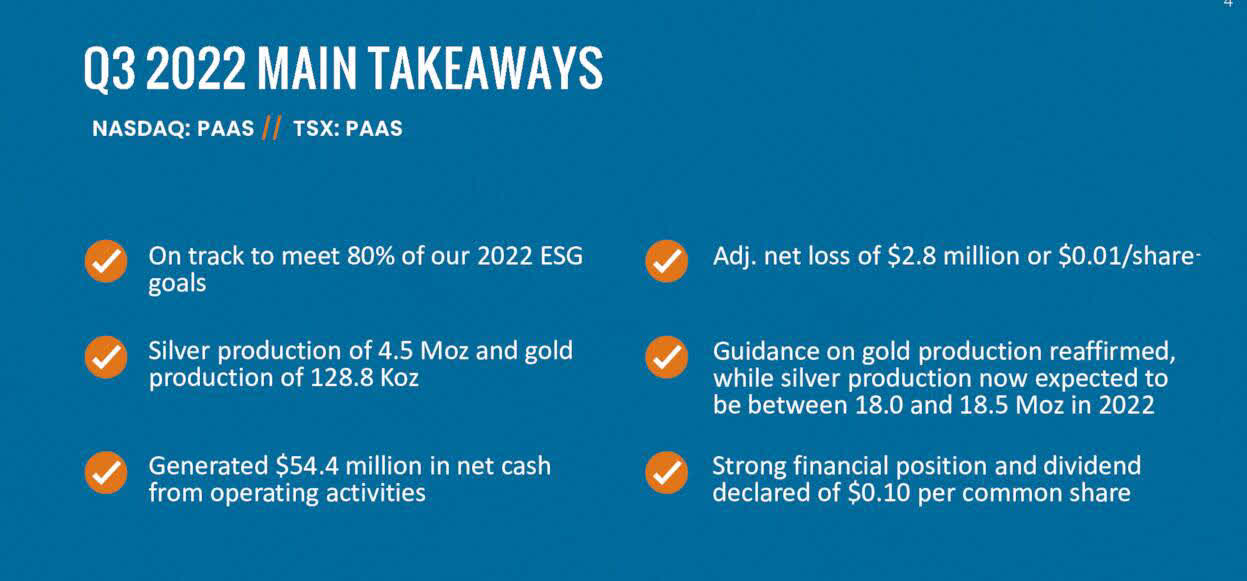
Michael Steinmann, President and Chief Executive Officer, said in the conference call:
The underlying performance of our gold segment operations was in line with our expectations, although production came in below our quarterly guidance range because of an in-heap inventory buildup of 28,900 ounces of gold naturally at Shahuindo and La Arena.
2 – Investment Thesis
I consider PAAS a long-term investment in the gold and silver segment. However, the overall performance of the stock since April has been quite depressing, and I now wonder about the quality of its producing assets, which experience recurring technical problems.
Furthermore, the company is about to get bigger. I think it is essential to wait a few months after the transaction is completed before considering an investment in the newco.
PAAS has a solid balance sheet, with net cash of $187.17 million and substantial growth potential with the Escobal mine in Guatemala and the skarn project at La Colorada in Mexico.
2023 will see some drastic changes with the potential of the Yamana Gold merger
On November 8, 2022, Pan American Silver Corp. and Agnico Eagle Mines Ltd. (AEM) entered into an arrangement agreement with Yamana Gold Inc (AUY).
Pan American will acquire all of the issued and outstanding common shares of Yamana, and Yamana will sell certain subsidiaries and partnerships which hold Yamana’s interests in its Canadian assets to Agnico Eagle, including the Canadian Malartic mine.
Pan American will retain all of Yamana’s mines and properties in Latin America and any remaining assets and liabilities (including cash and debt). Completion of the arrangement remains subject to the receipt of all necessary regulatory, court, and shareholder approvals in connection with the transaction (which must be approved by 66.7% of shareholders’ approval).
After the merger, silver production is expected to increase by 63% and gold production by 104%.
PAAS Assets to be acquired from AUY (PAAS Presentation)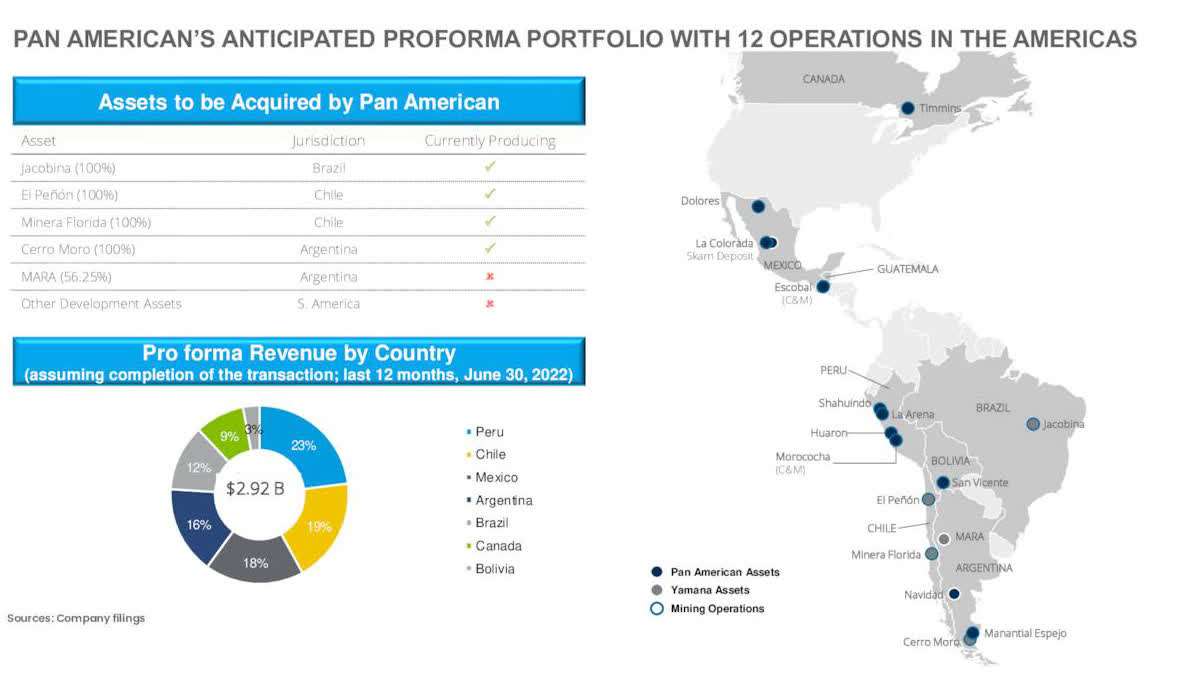
Because of a highly volatile environment in the gold and silver sector, your investment in PAAS requires short-term trading using the LIFO method to turn it profitable and less risky.
The solution is to trade PAAS short-term LIFO using at least 60% of your entire position while keeping a core long-term position for an eventual much higher target.
This two-level strategy is recommended in my marketplace, “The Gold And Oil Corner,” and I believe it is the most rewarding way to profit.
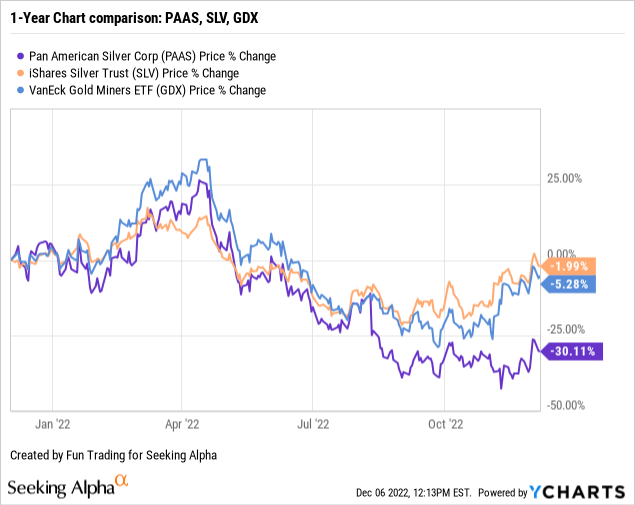
3 – Stock Performance
PAAS suffered a steep selloff since June and is now down 30% on a one-year basis. PAAS has underperformed both iShares Silver Trust (SLV) and the VanEck Vectors Gold Miners (GDX).
PAAS – Balance Sheet And Production In 3Q22 – The Raw Numbers
| Pan American Silver | 3Q21 | 4Q21 | 1Q22 | 2Q22 | 3Q22 |
| Total revenue in $ Million | 460.35 | 422.17 | 439.89 | 340.47 | 338.89 |
| Net income in $ Million | 20.25 | 14.04 | 76.52 | -173.98 | -71.53 |
| EBITDA $ Million | 159.11 | 120.10 | 173.69 | -91.42 | 9.82 |
| EPS diluted in $/share | 0.10 | 0.07 | 0.36 | -0.83 | -0.34 |
| Operating cash flow in $ Million | 157.02 | 118.10 | 68.76 | 20.84 | 54.42 |
| CapEx in $ Million | 62.19 | 70.15 | 61.45 | 71.80 | 69.07 |
| Free cash flow in $ Million | 94.83 | 47.95 | 7.30 | -50.97* | -14.66 |
| Total cash $ Million | 315.45 | 335.27 | 326.29 | 241.26 | 187.17 |
| Total debt in $ Million | 44.98 | 45.86 | 47.05 | 63.22 | 68.47 |
| Dividend per share in $ | 0.10 | 0.12 | 0.12 | 0.11 | 0.11 |
| Shares outstanding (diluted) in Million | 210.42 | 210.45 | 210.55 | 210.51 | 210.53 |
| Gold/Silver Production | 3Q21 | 4Q21 | 1Q22 | 2Q22 | 3Q22 |
| Gold production K Oz | 142.6 | 156.7 | 131.0 | 128.3 | 128.8 |
| Silver production M oz | 4.831 | 5.276 | 4.619 | 4.537 | 4.537 |
| AISC $/Oz by-product Silver | 16.30 | 13.57 | 13.41 | 17.30 | 17.97 |
| Gold price realized $/Oz | 1,782 | 1,792 | 1,880 | 1,850 | 1,705 |
| Silver price realized $/Oz | 24.16 | 23.33 | 24.03 | 22.03 | 18.72 |
Data Source: Company filings
* Estimated by Fun Trading
** Total debt is calculated as the total current and non-current portions of long-term debt, finance lease liabilities, and loans payable.
Part 1 – Silver And Gold Production Details For The Third Quarter Of 2022
1 – Total Gold/Silver production
1.1 – Quarterly production was 128.8K Au Oz and 4,537K Ag Oz
PAAS Quarterly production gold and silver history (Fun Trading)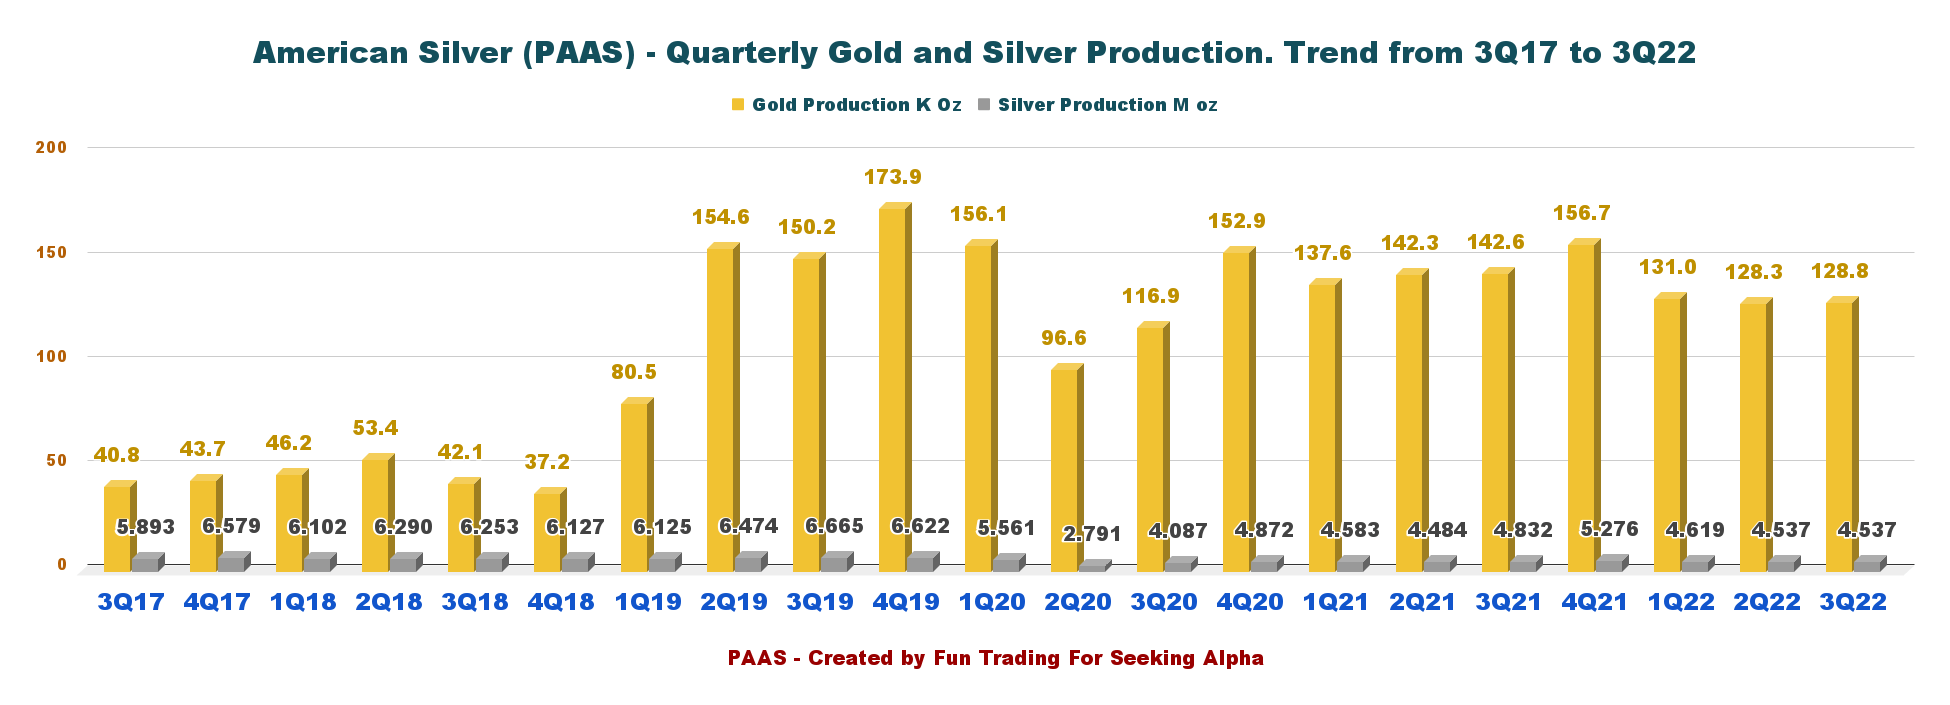
1.2 – Details per mine below
PAAS Production gold and silver per mine 3Q22 (Fun Trading)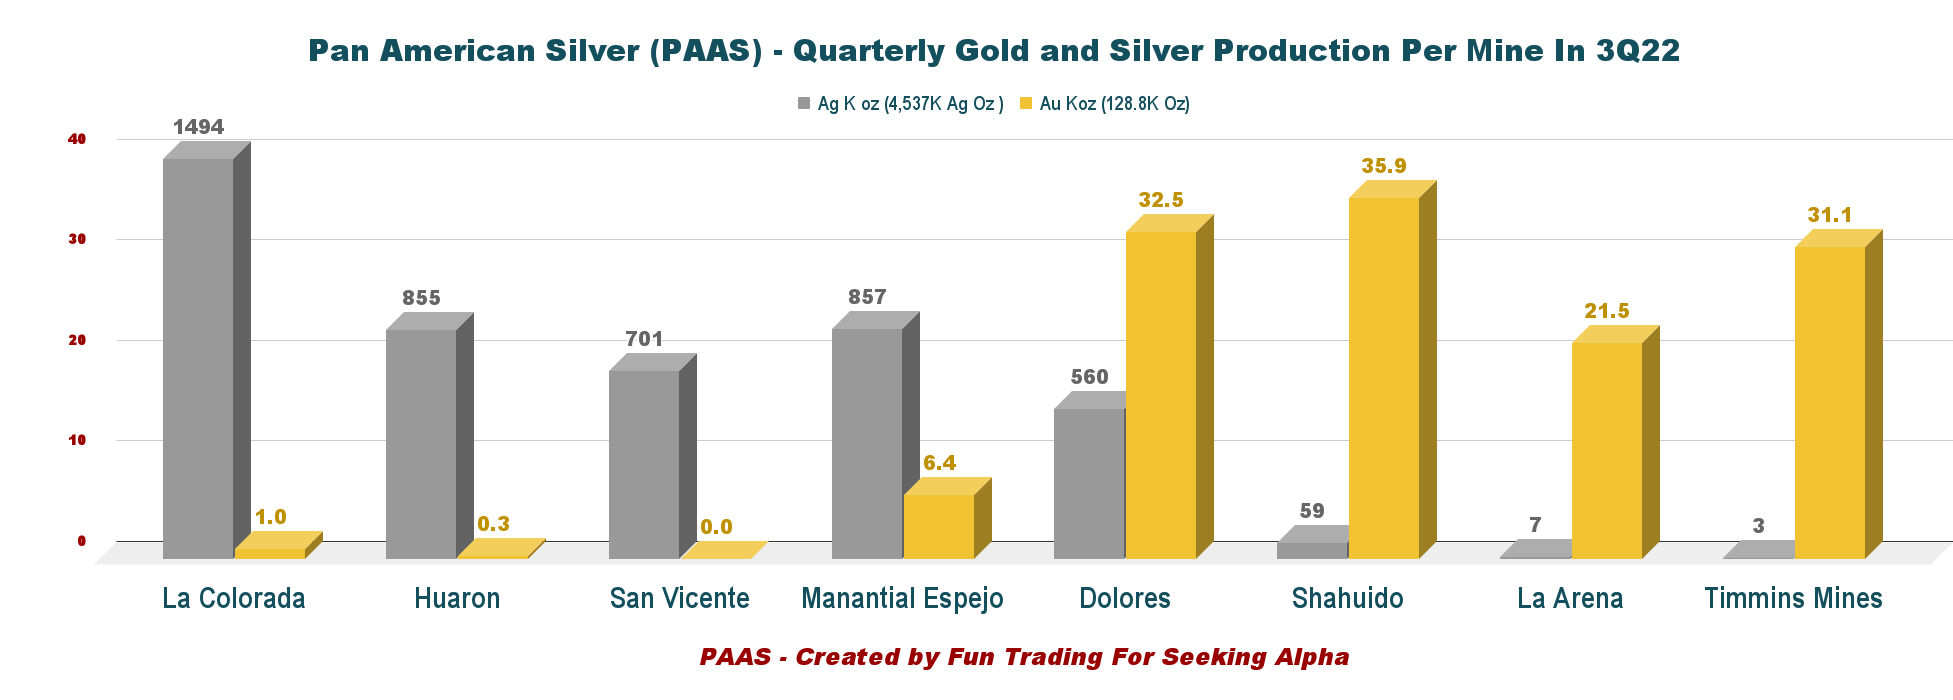
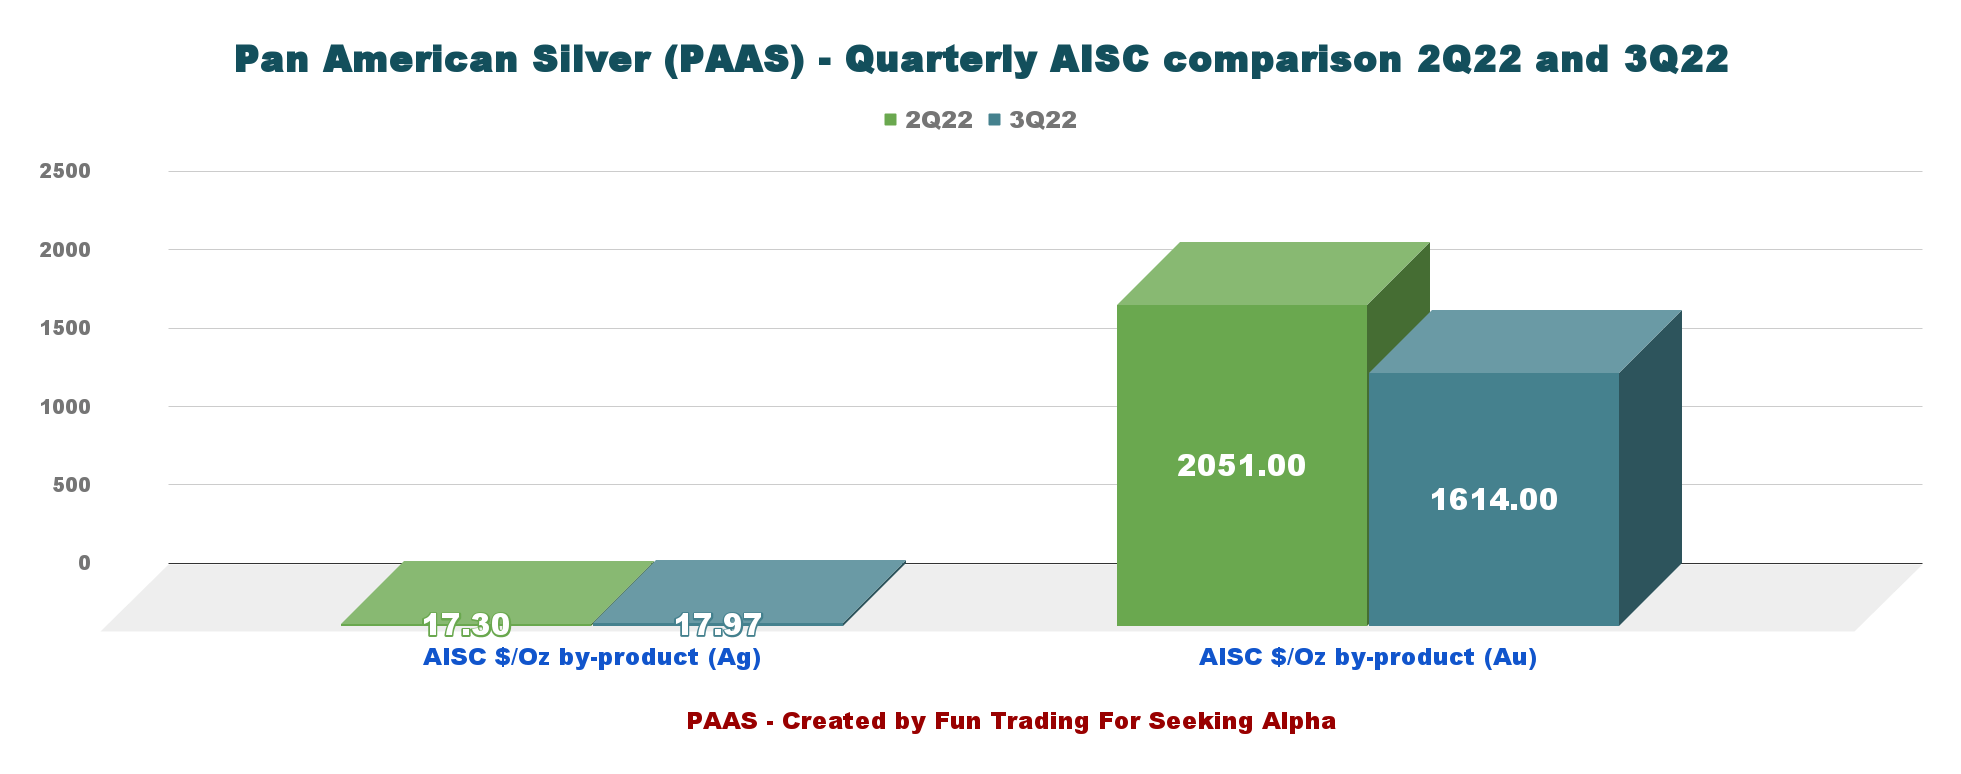
1.3 – The company produced zinc, lead, and copper, as indicated below
PAAS 3Q22 co-products production (Fun Trading) PAAS Quarterly AISC 2Q22 versus 3Q22 (Fun Trading)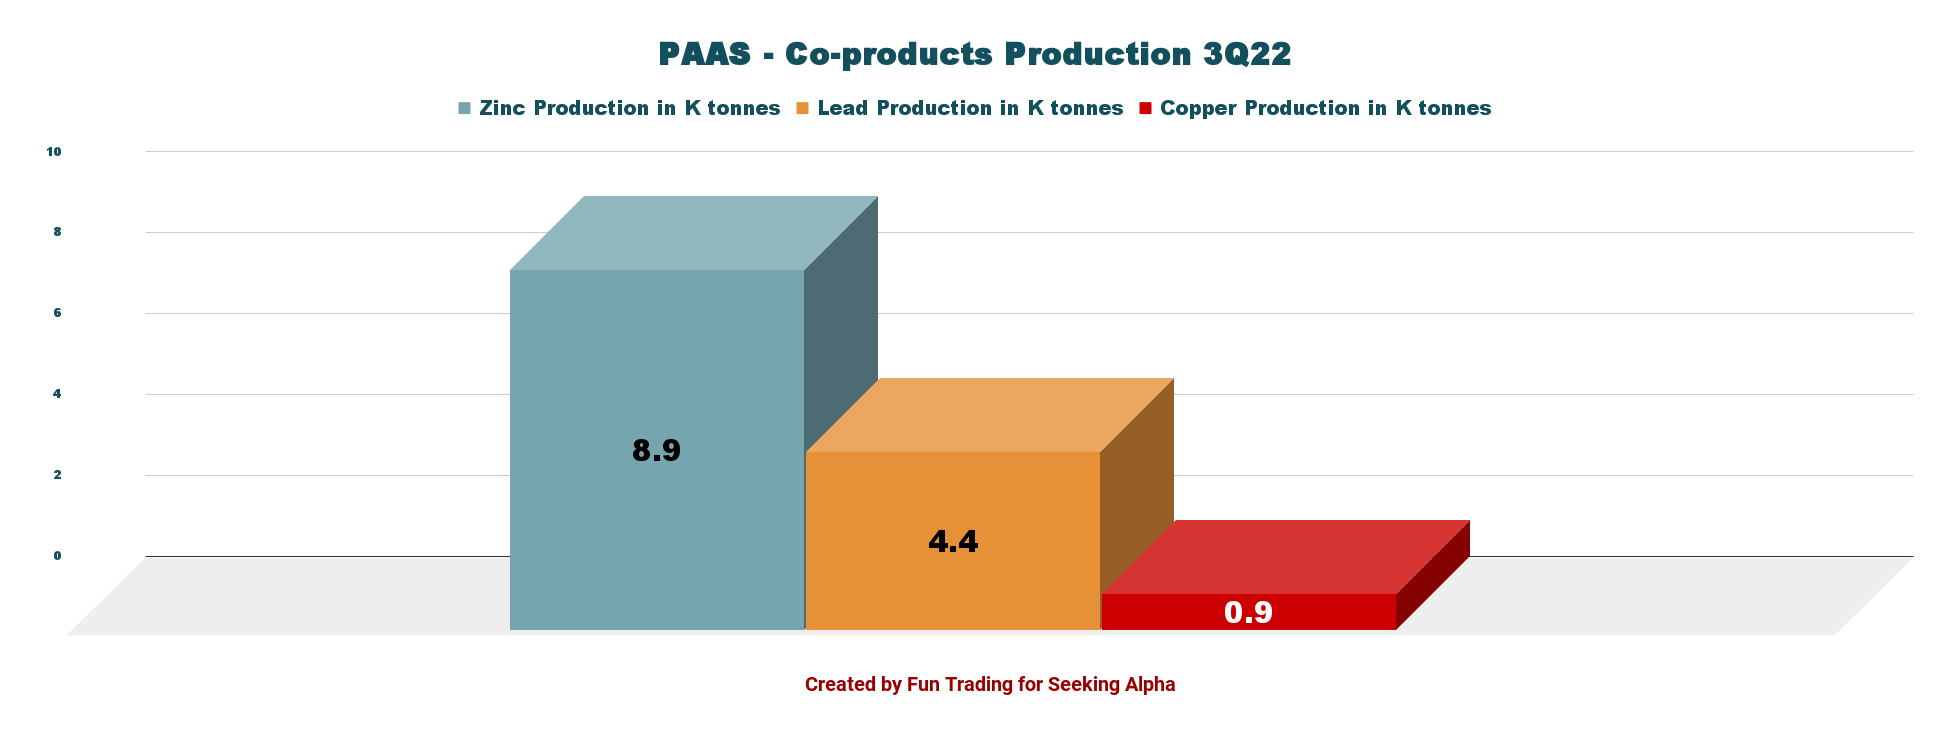
1.4 – The Contingent Value Right (CVR) trading under PAASF.
The contingent value right is attached to the Escobal mine’s uncertain re-opening. Progress is slow but looks somewhat positive.
According to Earthwork, which is not impartial and supports the Xinka people unconditionally. It indicates that “Xinka leaders have made clear that February 2023 is the tentative date for the completion of the consultation process.”
Below is the TA Chart:
PAASF TA Chart short-term (Fun Trading StockCharts)
2 – Updated 2022 Guidance
The company reaffirmed its 2022 operating outlook for gold production but reduced its guidance for silver due to lower output at Dolores and mine sequencing at La Colorada.
The company expects 18.0 Moz-18.5 Moz for silver and 550K-605K Oz for gold.
Silver segment cash costs are anticipated to be $10.7-$12.20 per Ag ounce, and AISC for silver is $14.50-$16.00. For the gold segment, AISC was unchanged between $1,450 and $1,550 per ounce.
PAAS 2022 Guidance (PAAS Presentation)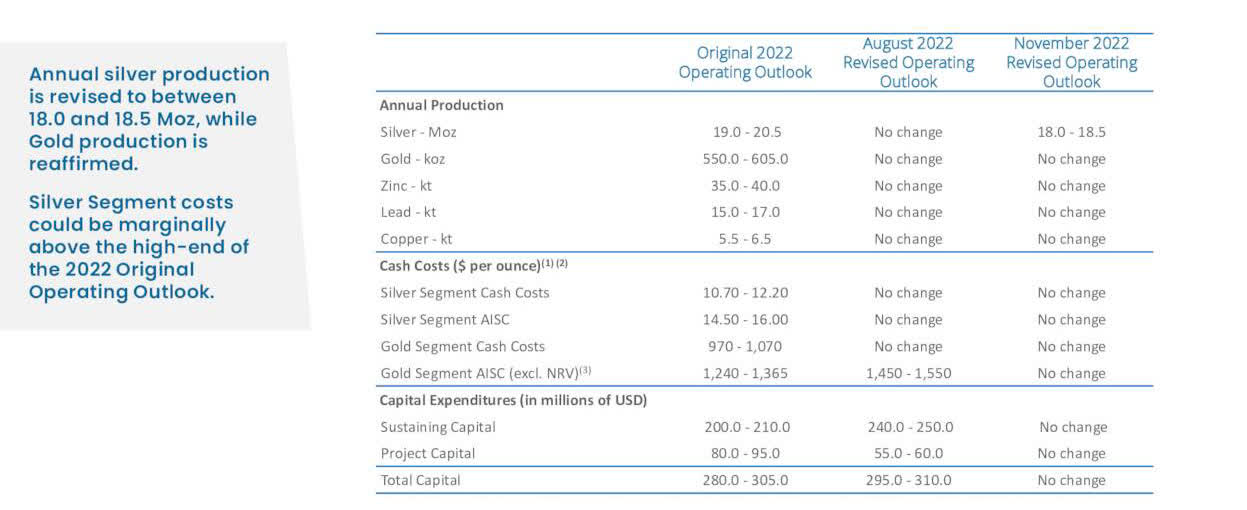
Part 2 – Pan American Silver: Financial Analysis
1 – Total revenue was $338.89 million in 3Q22
PAAS Quarterly revenues history (Fun Trading)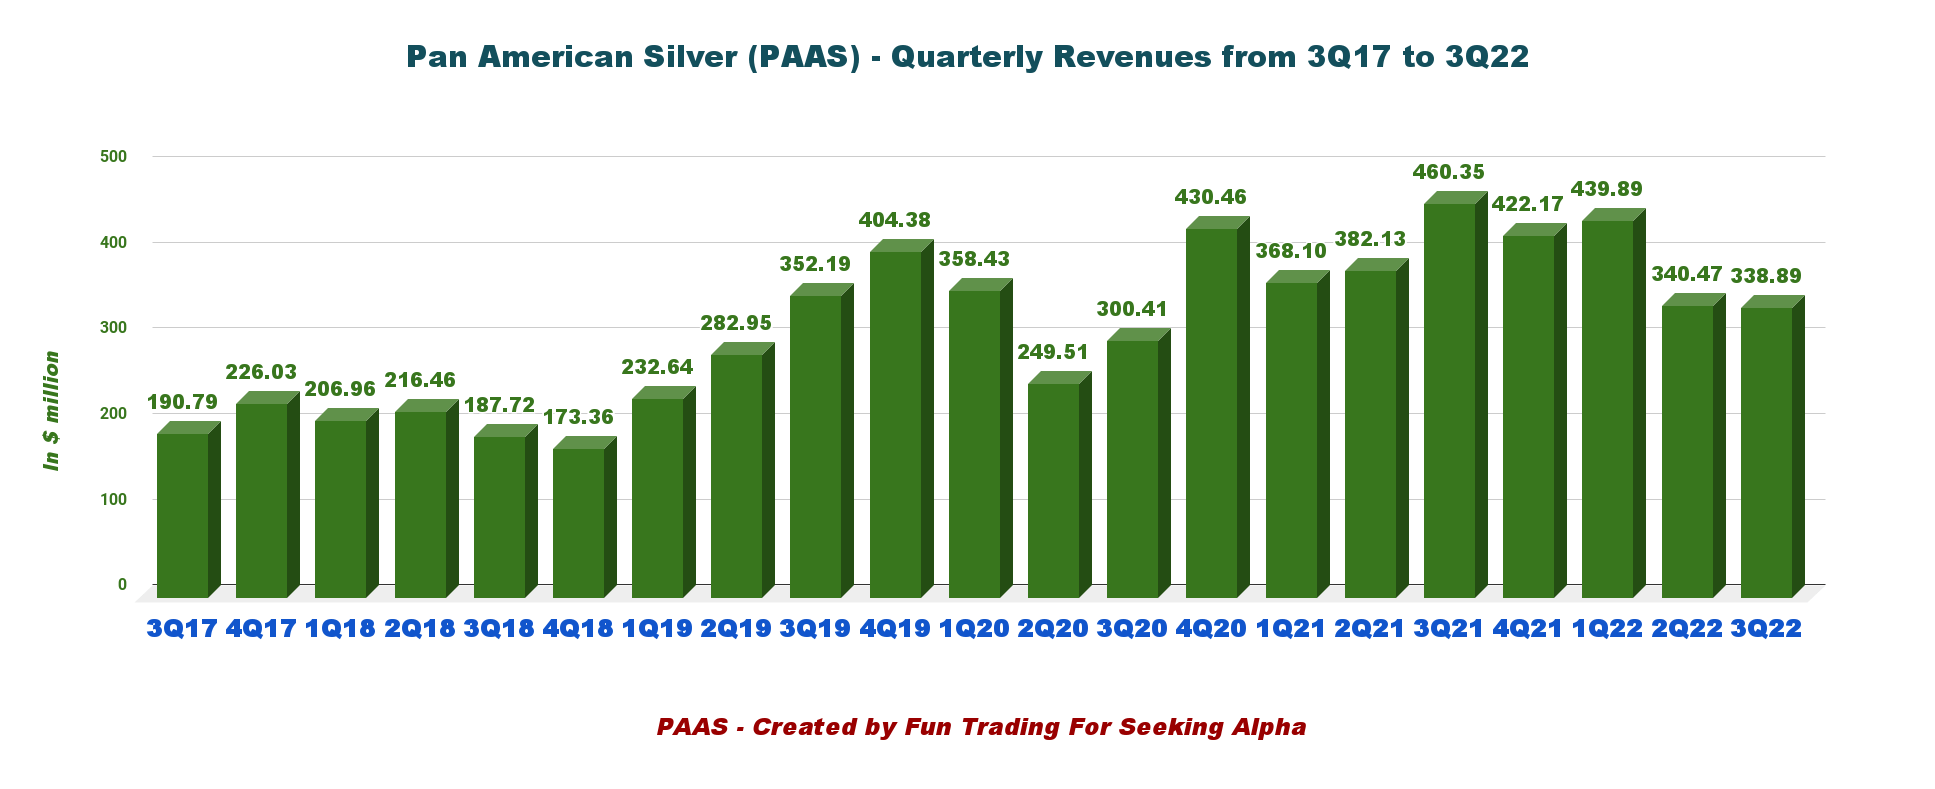
The Canadian company reported a third-quarter loss of $71.53 million ($0.34 earnings per diluted share). This compares to a net income of $20.25 million or $0.10 per share.
Revenues were $338.89 million in 3Q22, down 26.4% from last year’s same quarter. The adjusted loss was $2.8 million or $0.00 basic adjusted earnings per share, compared to an income of $37.8 million or $0.18 per share last year.
2 – Free cash flow was a loss estimated at $14.66 million in 3Q22
PAAS Quarterly Free cash flow history (Fun Trading) Note: Generic free cash flow is the cash flow from operation minus CapEx.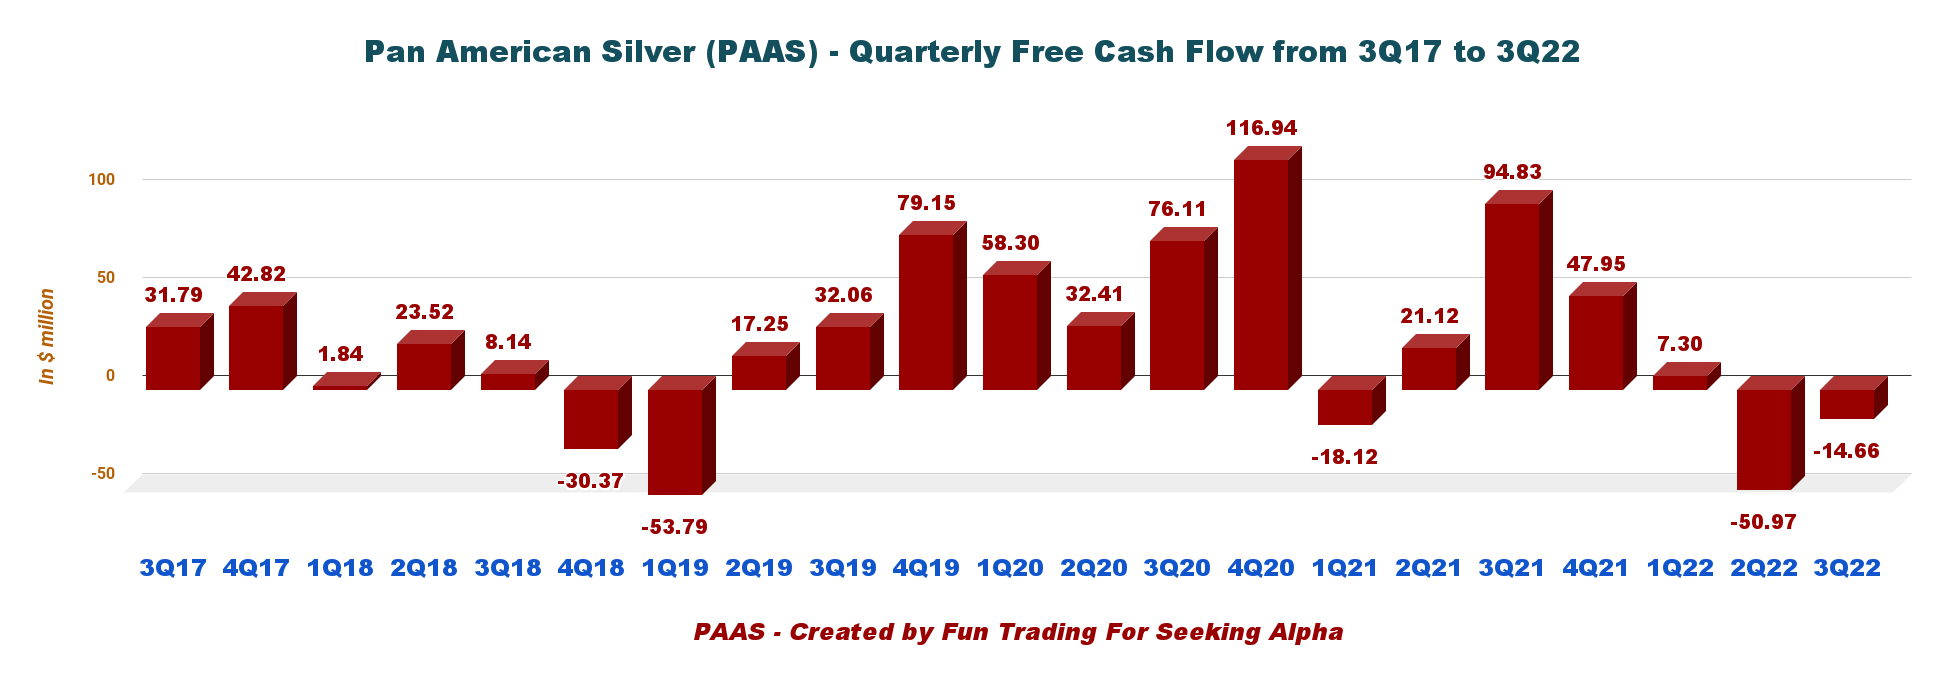
Trailing 12-month free cash flow is a loss of $10.38 million, with a loss estimated at $14.66 million in the third quarter of 2022.
The Board of Directors has approved a cash dividend of $0.11 per common share in 3Q22.
The company uses 27% of its free cash flow to pay a dividend and another 8% for a share buyback program.
This quarter the dividend was kept at $0.11 per share. See the repartition.
PAAS Free cash flow allocation (PAAS Presentation)
3 – PAAS is net debt-free. Total cash is $187.17 million in 3Q22. Good profile.
PAAS Quarterly Cash versus Debt history (Fun Trading)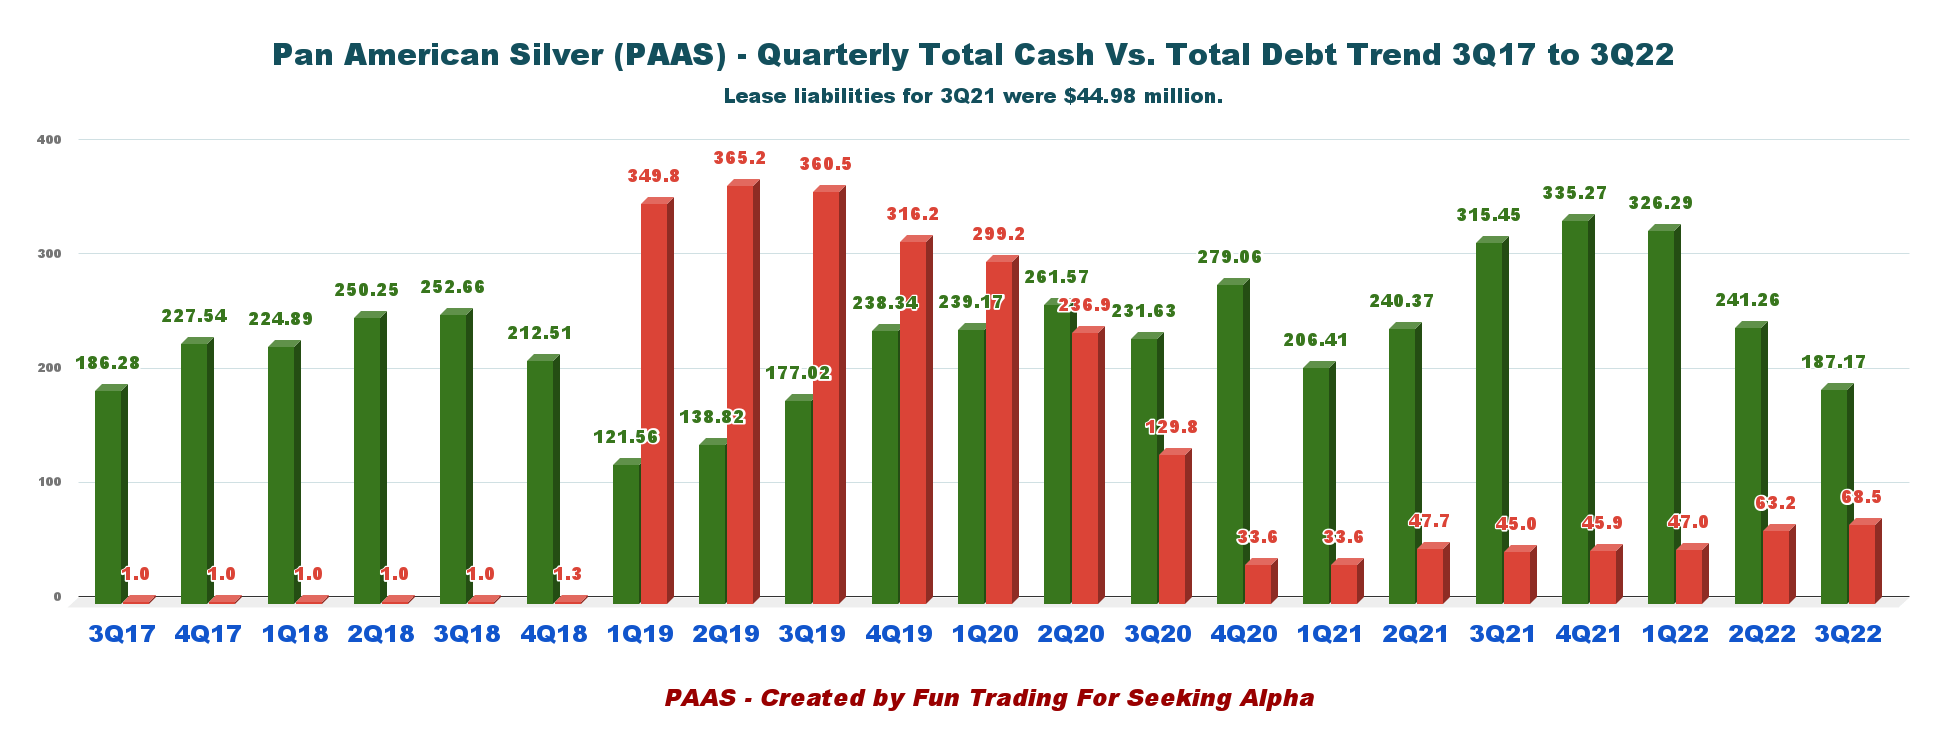
As of September 30, 2022, the company had cash and short-term investment balances of $187.17 million. The total debt, including equipment leases, is $68.47 million. Available liquidity is $653.1 million.
PAAS has $500.0 million available under its revolving credit facility.
PAAS Balance sheet 3Q22 (PAAS Presentation)
After the merger: PAAS assumes Yamana’s obligations concerning its August 2021 senior notes with an outstanding balance of $500 million and interest rate of 2.63% due in August 2031 and the December 2017 senior notes with a great balance of $282.9 million and interest rate of 4.625% due in December 2027. Total debt, including lease liabilities, will be $851 million.
PAAS Pro-forma balance sheet (PAAS Presentation)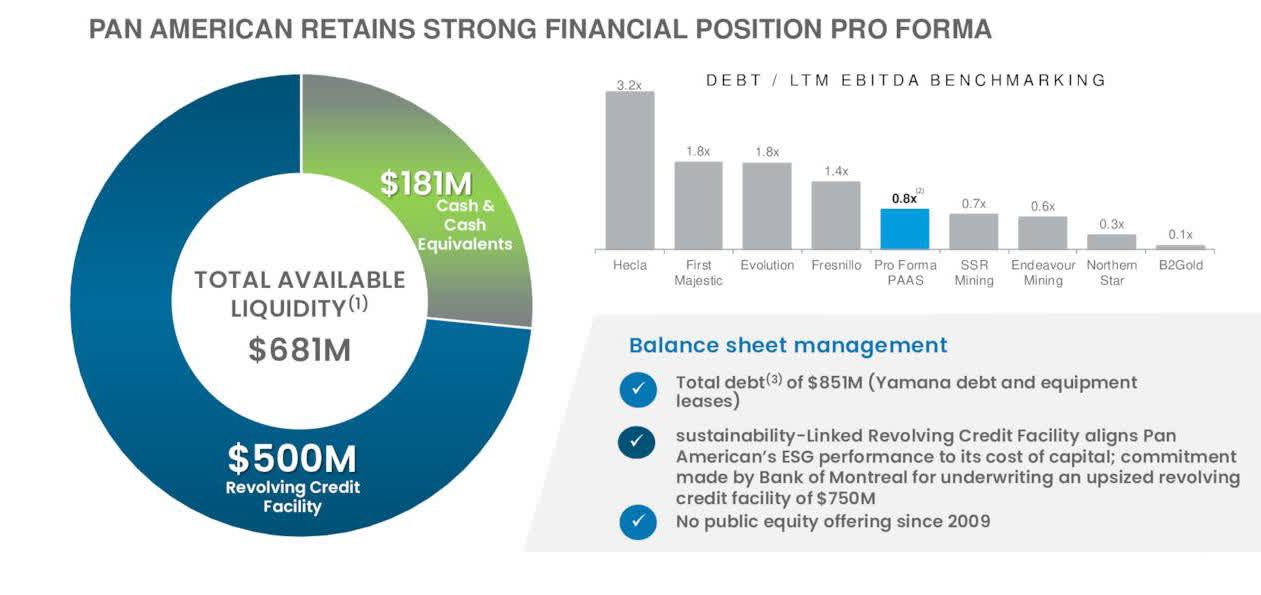
Part 3 – Technical Analysis And Commentary
PAAS TA Chart short-term (Fun Trading StockCharts)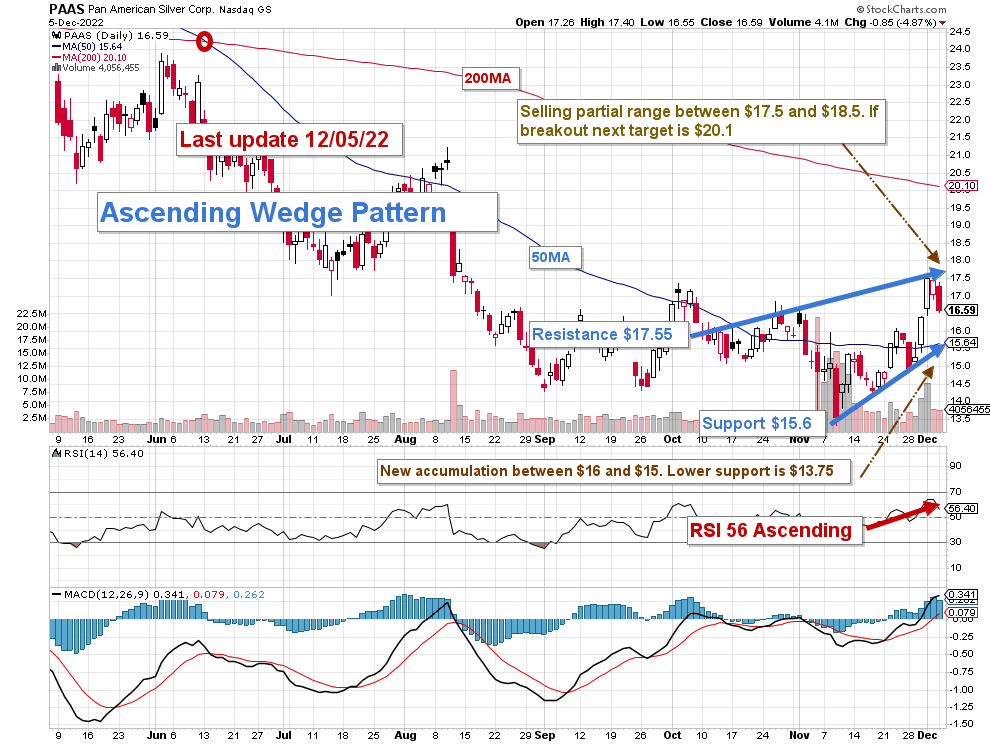
Note: The chart is adjusted for the dividend.
PAAS forms an ascending wedge pattern with resistance at $17.55 and support at $15.6.
An ascending wedge is a technical indicator, suggesting a reversal pattern frequently seen in bear markets. This pattern shows up in charts when the price moves upward with pivot highs and lows converging toward a single point known as the apex. When it is accompanied by declining volume, it can signal a trend reversal and a continuation of the bear market.
The strategy is to trade about 60% of your position LIFO and keep a core long-term for $30 and above.
I recommend accumulating PAAS at or between $15 and $16 or selling about 60% of your position, starting at $17.5 and gradually selling to $20.1.
If the gold price turns bullish in the next few weeks, PAAS could eventually reach $20.1. It will depend mainly on the FED’s decision on December 14.
Conversely, If the gold price turns bearish and falls below $1,700 per ounce, the next lower support is $13.75. The next FED decision on December 14, 2022, will be important.
Watch gold and silver prices like a hawk.
Warning: The TA chart must be updated frequently to be relevant. It is what I am doing in my stock tracker. The chart above has a possible validity of about a week. Remember, the TA chart is a tool only to help you adopt the right strategy. It is not a way to foresee the future. No one and nothing can.
Author’s note: If you find value in this article and would like to encourage such continued efforts, please click the “Like” button below as a vote of support. Thanks.
Be the first to comment