

Mailson Pignata/iStock via Getty Images
Investment Summary
From the Portfolio Manager’s Desk
With half the year now behind us visibility is now clearer on expected returns across asset classes for the remainder or FY22. The ‘resources’ trade (oil, gas, metals, etc.) is showing signs of exhaustion which starts to raise questions on the aggressiveness of central bank tightening policies. The RBA hiked its cash rate by 50bps to 1.35% overnight, in unison with moves in the US and EU. Meanwhile, UST yields have pulled back with the 10-year retracing from highs of ~3% to offer a YTM of 2.82%. The long-end remains above 3%, with the 20yr offering the most upside in respect to income at a 3.31% YTM.
Exhibit 1. Oil and Copper prices weakening suggesting wind back in industrial activity,
It also suggests a weakening of cost pressures to manufacturers and producers, key to inflation trends
Data: Updata. Image: HB Insights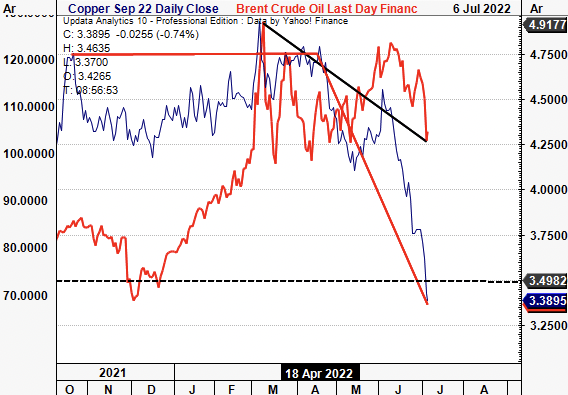
With oil and copper both entering sharp consolidation in June the page now turns to inflation expectations. Still, a higher rates regime is here to stay and this has direct implications to equities. The high beta and growth trade is still beaten down and many profitable growth names trade at respectively discounted multiples. Short-growth has also turned out to be an effective equity hedge that remains in the money to date. Holders of the SARK ETF and 1x inverse ETFs to the SPX have narrowed drawdown and held exposure to volatility-premia in doing so, whilst adding a source of liquid, tactical alpha.
Exhibit 2. Short growth has proven to be a liquid diversifier, and equity hedge that remains ITM in FY22
S&P 500 weakening whilst giving short-bias strategies the opportunity for tactical alpha in equity portfolios as well
Data: Updata. Image: HB Insights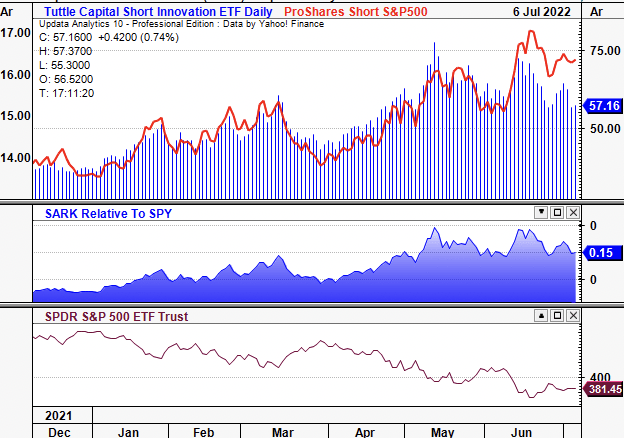
Still, losses in highly-correlated risk assets have compounded due to the market’s weighting to tech and growth as a factor in 2020/21′. The factor rotation out of growth has seen heavy inflows into low-beta, value and ‘quality’-based strategies as the most reasonable hedge to equity drawdowns.
Adding further complications is the recent uptrend in stock/bond correlations. Investors with pure stock-bond exposure have incurred heavy losses in 2022. This is partly due to the rate of change in losses spurred on by covariances heading to 1. This appears to have settled and looks to return back to normalized levels however. The long-end has caught a bid lately and looks to have bounced from lows in the near-term. That, and correlations have narrowed leading to a bifurcation in long-dated treasuries to the SPX.
Exhibit 3. Long end of Treasuries catching a bid in late June, correlations narrowing
Could build the case for long-dated bonds if the near-term continues to worsen
Data: Updata. Image: HB Insights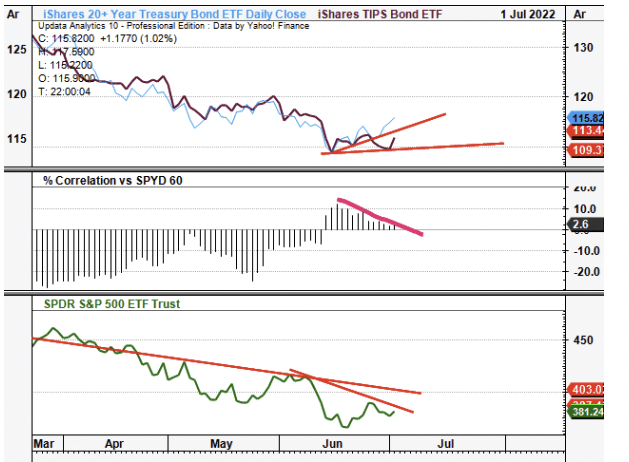
Alas, low-beta, high quality strategies continue to outperform in 2022 and offer uncorrelated equity returns for investors to position into their portfolios. The following two charts were taken from a previous analysis but illustrates this point perfectly. Trend following strategies, particularly managed futures have fed strategic and tactical alpha to balanced portfolios in 2022 (Exhibit 4). The ‘sector’ is strengthening relative to the SPX and broke out to the upside in early 2022. Inclusion of alternative asset classes as such have proven to smooth equity portfolio returns in 2022 as well, seen later.
Exhibit 4. Alternatives have outperformed in FY22
Again offering investors strategic and tactical alpha as a liquid diversification enhancer to smooth portfolio returns
Data: Updata. Image: HB Insights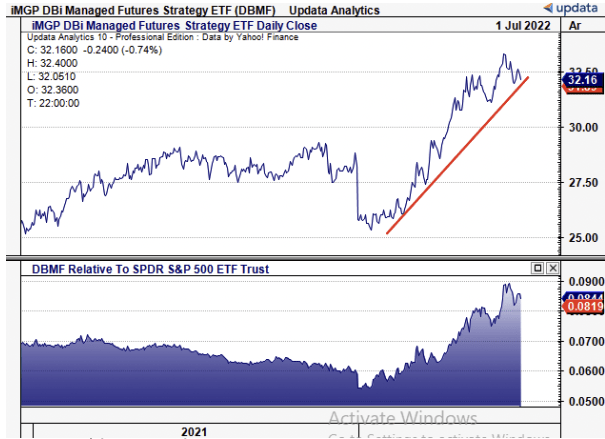
This point is extremely relevant to our thesis on Outset Medical, Inc. (NASDAQ:OM). The stock has displayed many of the undesirable characteristics we’re looking to avoid in the forward looking regime. Indeed, the macro-thematic has turned to that of inflation, central bank tightening, supply chains, energy crises and geopolitical conflicts. Hence, profitability and return on capital are paramount in the arsenal to defend against these threats. Here we demonstrate there are better alternatives to OM in the haemodyalisis space and medical technology (“medtech”) sector in general. It’s thin gross-net margins mean little cash is fed below the bottom line. Not to mention a series of operating losses. We aren’t taking a directional view on the market, hence rate neutral on its valuation.
Exhibit 5. Low-beta strategies continuing to outperform – OM displaying far too high correlation statistics.
There’s been a factor rotation out of high-beta/growth type names into low-beta alternatives, compressing the OM share price in 2022.
Data: Updata. Image: HB Insights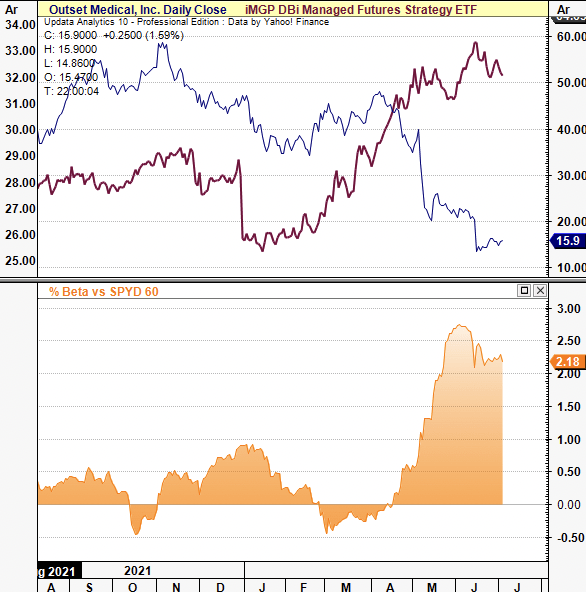
Investment Thesis Summary
OM doesn’t present with the economic pillars to absorb the macroeconomic headwinds outlined above. Nor does it comply with the current premia investors are set to reward beyond FY22. A series of operating losses, widening sales/FCF mix and recent regulatory overhang have us bearish on the stock price in the near-term.
OM 12-month price action
Data: Updata. Image: HB Insights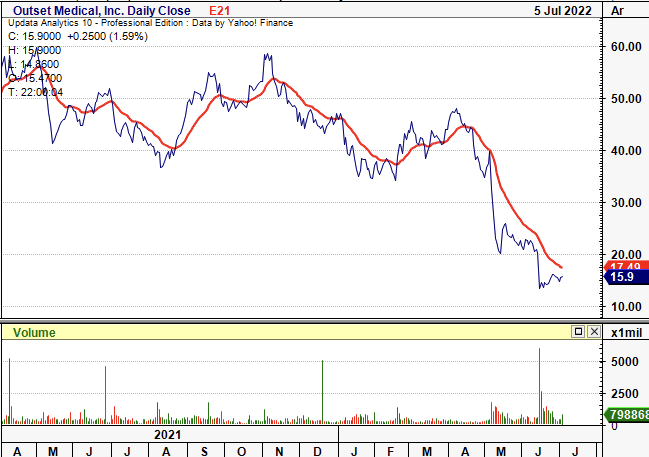
Moreover, as investors sentiment shifts back to fundamentals, OM’s thin gross margins leave it languishing relative to peers. Without taking a directional view on the market, we rate it neutral on a $13.20 price target.
Tablo shipments halted
Without re-printing the news, OM halted shipments of its Tablo dialysis system last month. It cited no safety issues with Tablo, only that it was awaiting the FDA’s clearance of a 501(k). It had submitted the application regarding changes to Tablo’s original clearance.
The OM share price will likely continue to soften on this as the market also prices in the systematic risks outlined above. The FDA overhang remains a meaningful headwind to share price appreciation, by estimation. Look at companies like Fenec Pharmaceuticals, where the regulatory overhang with its PEDMARK label completely obliterated the stock price. That’s something worth thinking about.
It’s all in the margins, working capital
It doesn’t take too deep of a dive into OM’s financials to see there’s abundant red flags. Going by our search of long-term cash compounders, OM fails the litmus test of profitability. It’s printed a series of gross losses up until FY21 where it turned a 7.4% profit on revenue of $102 million. This has lifted sequentially for the company to print gross margin of 14.5% in Q1 FY22.
Nevertheless, these are incredibly thin margins to work with and automatically lead to a series of operating losses over the 5-year period to date. Moreover, it has bulked retained gross margin up from $1.05 million in Q4 FY21 to $4.44 million last quarter. The spread on revenues to gross margin leaves nothing tangible for shareholders below OPEX, meaning OM will continue to print losses at the bottom line. Operating and earnings leverage are severely lacking on this basis as well.
Exhibit 6. With such minuscule profit at the top there’s little-to-no chance of quality earnings reaching the bottom line, or at FCF.
Investors barely have anything tangible other than sales with OM based on this presentation.
Data & Image: OM Filings; HB Insights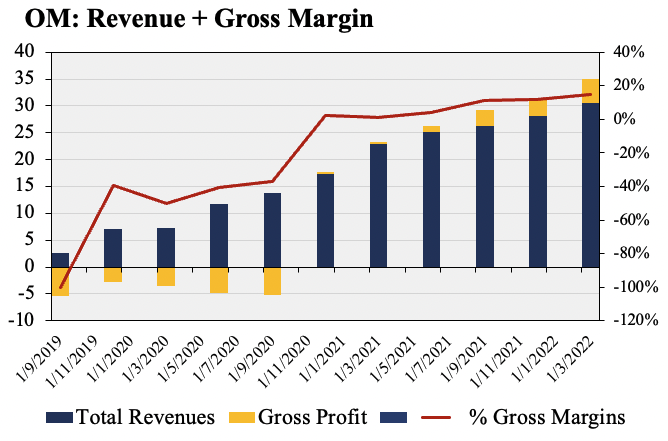
Investors are rewarding bottom line fundamentals in 2022 amid the rotation out of high-beta and growth names. Consequently, there’s an immediate road block to data-driven investors whom are searching for evidence of profitability. As shown in Exhibit 7, whilst management remains true to its words on growing gross margin, operating income has continued to sink further into the red with no justifiable pull-through to sales, in our estimate.
Exhibit 7. Whilst GM’s have widened, OM has printed ongoing operating losses for 3-years (quarterly).
Data & Image: OM Filings; HB Insights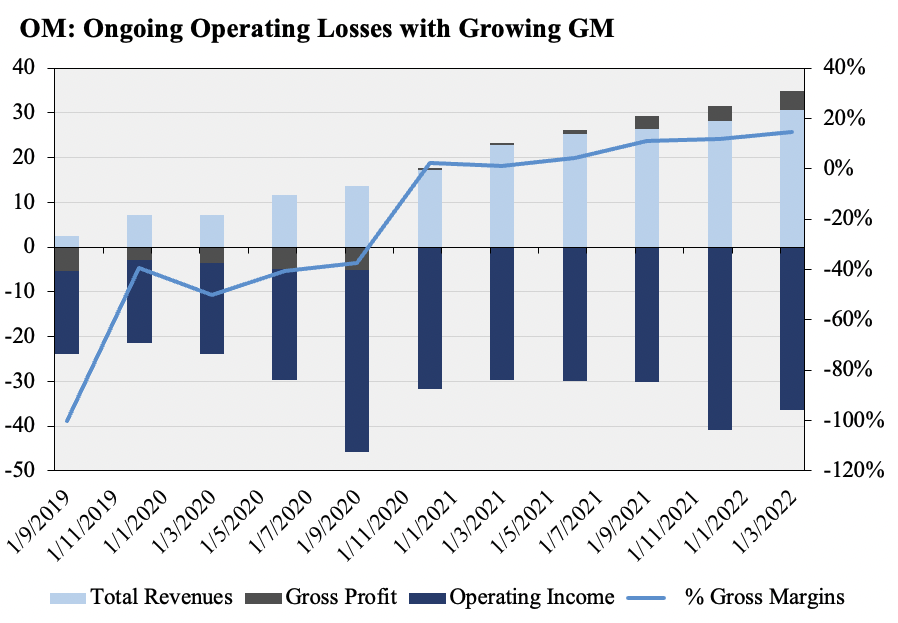
Consequently the investment debate immediately weakens as we can’t find tangible evidence OM will provide the cash-flow characteristics we’d deem suitable to allocate towards. FCF is in the red and came in at -$39 million last quarter, whilst earnings have weakened and missed consensus estimates on the last two occasions. The market isn’t paying for unprofitable, beaten down names, nor will it likely pay a premium into the future for the same. Cash is king in the current climate. In the 5-years to date, CFO has remained negative and worsened to $130 million on a T12M basis. Investors have realized a negative earnings yield on this and EPS of -$2.97 in FY21, -$0.78 in Q1 FY22. We’ve forecasted OM to continue this trend and reckon it will print EPS of -$0.69 in Q4 this year, and -$2.92 in FY22.
Exhibit 8. Investors are agnostic to top-line growth and aren’t rewarding this kind of P&L any longer
Data & Image: OM Filings; HB Insights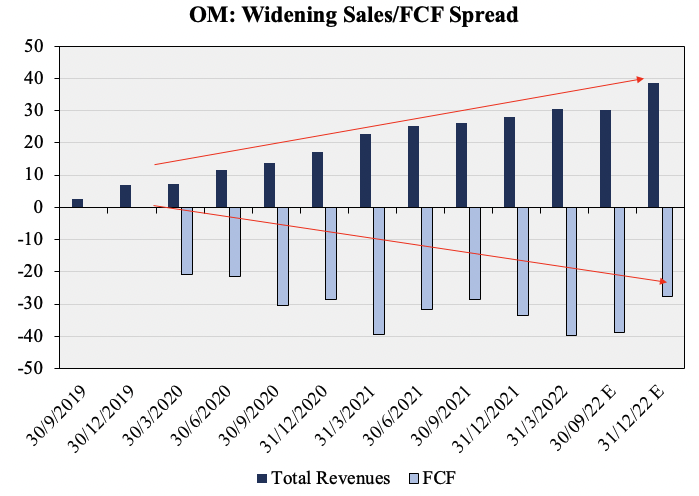
The question then becomes how does OM overcome its shortcomings in turning profitability on revenue, let alone on OPEX and post-tax. One measure is to examine the company’s management of working capital. In an unprofitable company, this gauges its propensity to generate outsized return on capital – key in the current macro-regime.
OM disappoints again here and we’ve seen the cash conversion cycle widen from 67 days in H1 FY20 to more than 208 days in the last quarter. The bulk of this gain was driven by substantial increases in days outstanding inventory (“DSO”) and days sales outstanding (“DSO”) between the 2 periods. Noteworthy are the supply chain headwinds faced in medtech, and the backlog impacts from Covid-19. However, on its last earnings call, CEO Leslie Trigg said that there “was no COVID disruption, and really, a continuation of the theme over the last two years.”
Outset has been an example of a company and a business that’s continued to perform consistently well, not because of COVID and Q1 didn’t represent any change to that pattern. So the strength that we thought in the quarter leading to strong performance on the top-line revenue side really came again from the core Tablo value proposition in the acute around significant cost reduction.
However, the data is speaking to us and we are listening. It’s intriguing to see the dislocation in this language and what the data is showing. We see that OM has more cash tied up in working capital (far more) than it did pre-pandemic, whilst its inventory has remained stagnant for 22 days and 133 days for DSO and DOI respectively. This demonstrates a risk on working capital especially as the cost of capital is now increasing. What’s also interesting to observe is the matching of OM’s worsening operating margin (Exhibit 8) and the widening of cash conversion days over the past 2-years.
Exhibit 9. Does OM have an inventory problem? DSO & DOI both widening in FY20–date
Less inventory turnover, more cash tied up in working capital.
Data & Image: OM Filings; HB Insights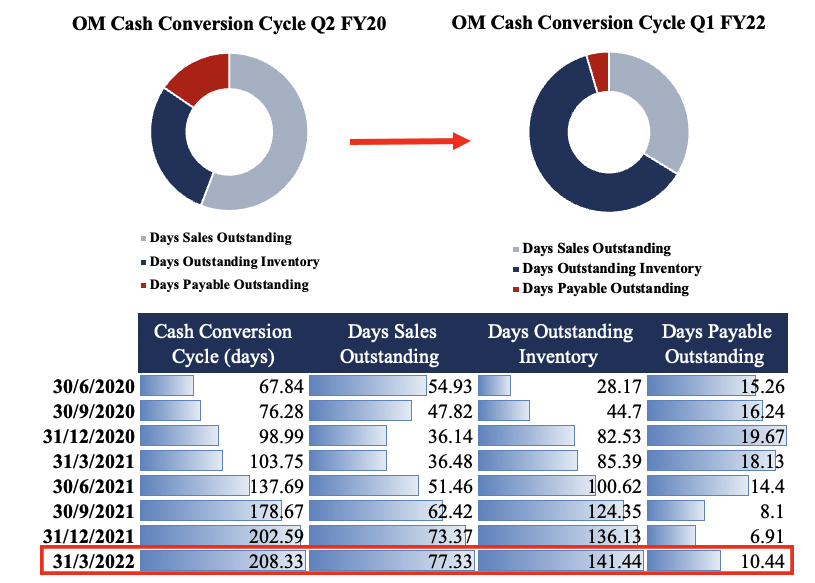
Valuation
Shares are trading at 3.5x FY22 sales at ~2.2x book value. Unfortunately, lack of profitability also leaves a lack of tangible value flow for investors as well (we define tangible value flow as cumulative FCF/share and EPS). This means valuing OM becomes more of a simulation analysis versus a statistical one. Nevertheless, we’ve priced the share at $9.60 based on 3.5x our sales estimates of $451 million. Applying the same to FY23 sales forecasts of $208 million gives a price target of $13.80. Our point and figure analysis (Exhibit 10) reveals one target at $16.50 after a heavy consolidation in price action after its last earnings.
As an equal weighted composite this prices OM at $13.20, offering no upside bias to harvest.
Exhibit 10. Targets pointing to $16.50 region
Data: Updata Analytics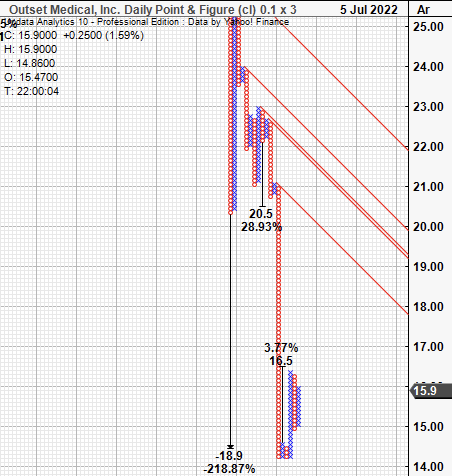
Technical Studies
Charting studies confirm what’s been found fundamentally in OM. Market sentiment is currently poor and shares are pushing lower in continuation of a longer-term downtrend. Both OBV and momentum have trended lower since May and shares are showing little-to-no price action directionally. Oscillators have worked in these kinds of candles however there’s little to no upside yet to be priced in anyway.
Exhibit 11.
Data: Updata Analytics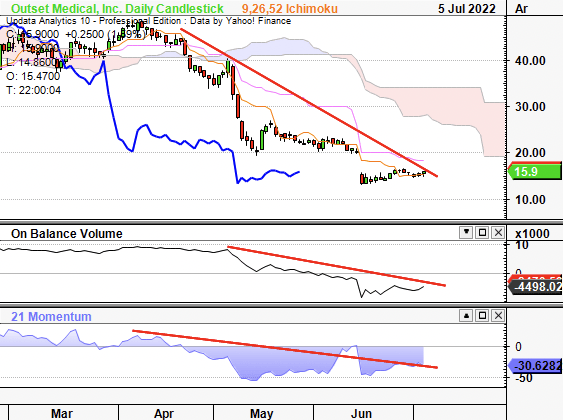
Further evidence is seen as RSI remains low and the stock trades below key moving averages
Exhibit 12.
Data: Updata Analytics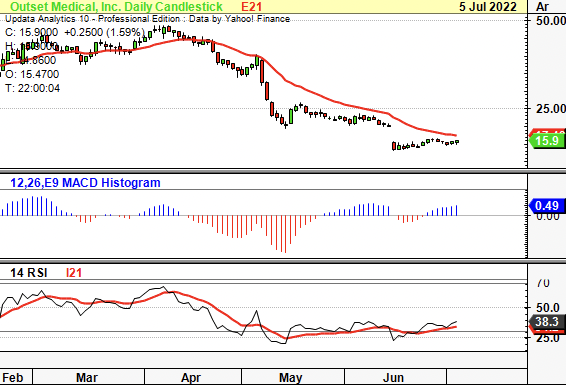
In short
It didn’t take much digging to see that OM isn’t suited to our current positioning that seeks to identify long-term cash compounders with quality earnings. OM didn’t pass the litmus test on a number of fronts, and our forecasts only point to further losses at the operating and earnings level.
With that, there’s a lack of tangible value flow to be realized by OM shareholders and recent changes in the company’s growth engine have halted the share price further. Tablo’s recall is a big deal and looks still to be fully priced in by the market. That’s not a directional play we’d like to speculate on either.
We’ve priced OM at $13.20 and are happy to stay on the sidelines with this name in favor of more profitable opportunities.
Be the first to comment