

Patrick Chu
The Opendoor (NASDAQ:OPEN) Q2 earnings release kicked off a very crazy 24 hours for both the company and the stock that was filled with disappointment, excitement, euphoria, and shock. This article will hopefully break it down and help us see where we go from here. I still consider Opendoor to be a long term winner in and I’ll fill in the reasons why as we go.
A timeline of events
Opendoor simultaneously published two press releases. The first was their earnings report, and the second was an announcement about a multi-year partnership with Zillow. The stock price reacted with extreme volatility. After closing the day at $4.70, it dropped precipitously by 7.7% to $4.34 over the next 4 minutes, assumedly being traded down by algorithms reacting to the subpar earnings (we’ll get to these in a minute), but then took a U-turn and climbed back to neutral over the next 5 minutes, presumably on the strength of the agreement with Zillow (which will also be discussed in detail below). It then tailed off again below -4% before e slowly rising throughout the evening to close after hours at +4%. Premarket the next morning was slightly volatile but started green into open. The first 20 minutes of trading were mostly flat until the company filed an 8-K pertaining to the Zillow partnership. At 9:52, the stock went vertical and peaked at a +25% gain by 10:25. The rest of the day it consolidated and traded in the $5.60-5.80 range and eventually closed at 5.72 for a +21.7% gain on the day.
Opendoor stock chart during the 24 hours after earnings were released (Webull)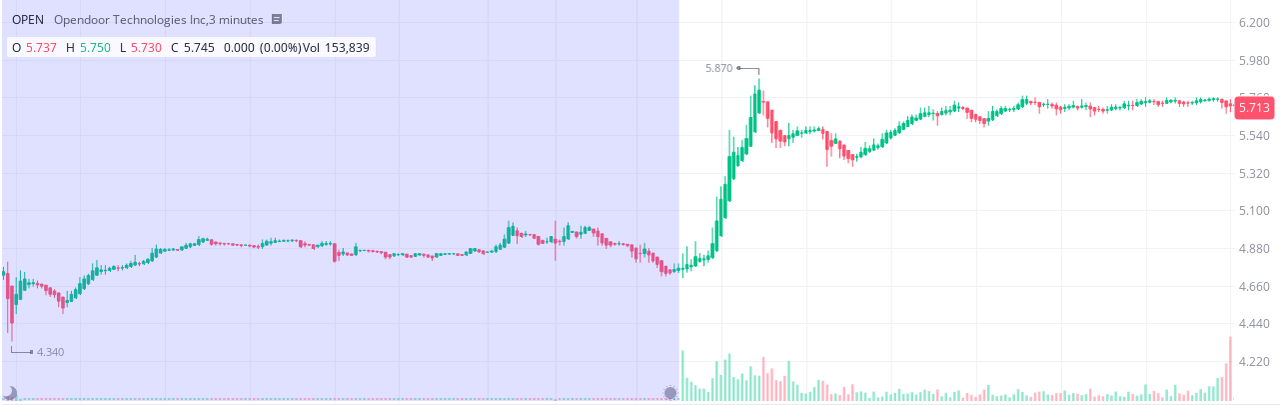
What was in the earnings report that was so bad? Why is the Zillow partnership so good? What could possibly have been in that 8-K filling that would boost the stock by 21% in spite of very poor earnings?
Q2 Earnings and Guidance
I’m going to break the results into a few categories. I’ll look at how they did selling during Q2 without write-downs, then I’ll discuss the write-downs, then move into inventories, and finally we’ll move on to forward guidance. The Q2 GAAP numbers were great before write-downs. Revenue was in line with expectations, but their margins were stellar. We knew from management that they had been increasing their spreads since last Fall, and that showed. Gross margin is the average profit they make on each house sold if you just look at the difference between what they paid for each house and what they sold it for. Adjusted gross margin (the adjustment is taking out the write-downs) was 13.2%. Adjusted contribution margin, which includes their holding costs and direct selling costs (like buyer’s agent fees), was also excellent at 10.1%. Their best quarters ever were 13.5% and 10.8% respectively, so those are huge numbers. Accordingly, despite the fact that they sold 17% less houses in Q2 than Q1, their gross profit in the quarter increased by 8.6% and their contribution profit soared by 27.1%. Their contribution profit per home sold was a whopping $40,000, a new high water mark for the company. If it weren’t for write-downs, they would have crushed Q2 EPS estimates.
The write-downs
That is where the really good news ends for quarterly results. There were two significant write-downs in the quarter. The first was $42M in “Legal contingency accrual and related expenses” having to do with the $62M settlement with the FTC for previous advertising practices between 2017 and 2019. They are taking the vast majority of that fine as a loss now, which is fine. I’m also not concerned that this will be a recurring issue, especially in light of the marketing power of the Zillow partnership.
The second write-down is $82M for fair market adjustments of their current inventory. In other words, They’ve already taken a paper loss of $82M because the inventory their currently own is already worth materially less than they paid for it. This should come as a surprise to very few who are following the real estate market, as May to June of 2022 shows the biggest month-over-month drop in sales prices ever. While the federal reserve does not break down existing home sales by month, here is the chart for median sales prices for new houses.
Median sales price for new houses in the United States for the last year (Federal Reserve Bank of St. Louis)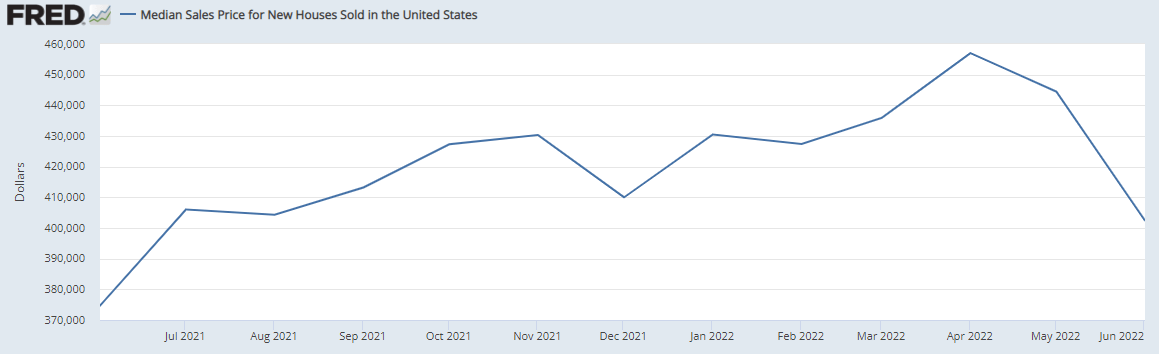
Keep in mind that this data is very lumpy and does have much wilder fluctuations than looking at the entire residential real estate markets. However, the general trend is obvious. Prices peaked in April at $457,000, dropped slightly in May to $444,500 and then plummeted to $402,400 in June. This is the second biggest monthly drop in the entire data that extends all the way back to 1963. The only bigger month-over-month drop was between September to October of 2010. Despite previously increasing spreads, Opendoor was not agile enough to adjust to this steep drop on the fly.
The inventory issues
Opendoor now has a problem. They have 17,013 houses on the books during a time when liquidity is low and buyers are much more hesitant to pull the trigger. A lot of those houses were contracted before the steep decline and they are now worth less than they were when they were purchased. Opendoor has to find a way to sell them in today’s market. Their inventory has been this high for most of the last year, so they are not sailing through uncharted waters, but liquidity was much higher and this is a completely different market they are going to have to navigate.
Opendoor homes in inventory (Author, taken from quarterly reports)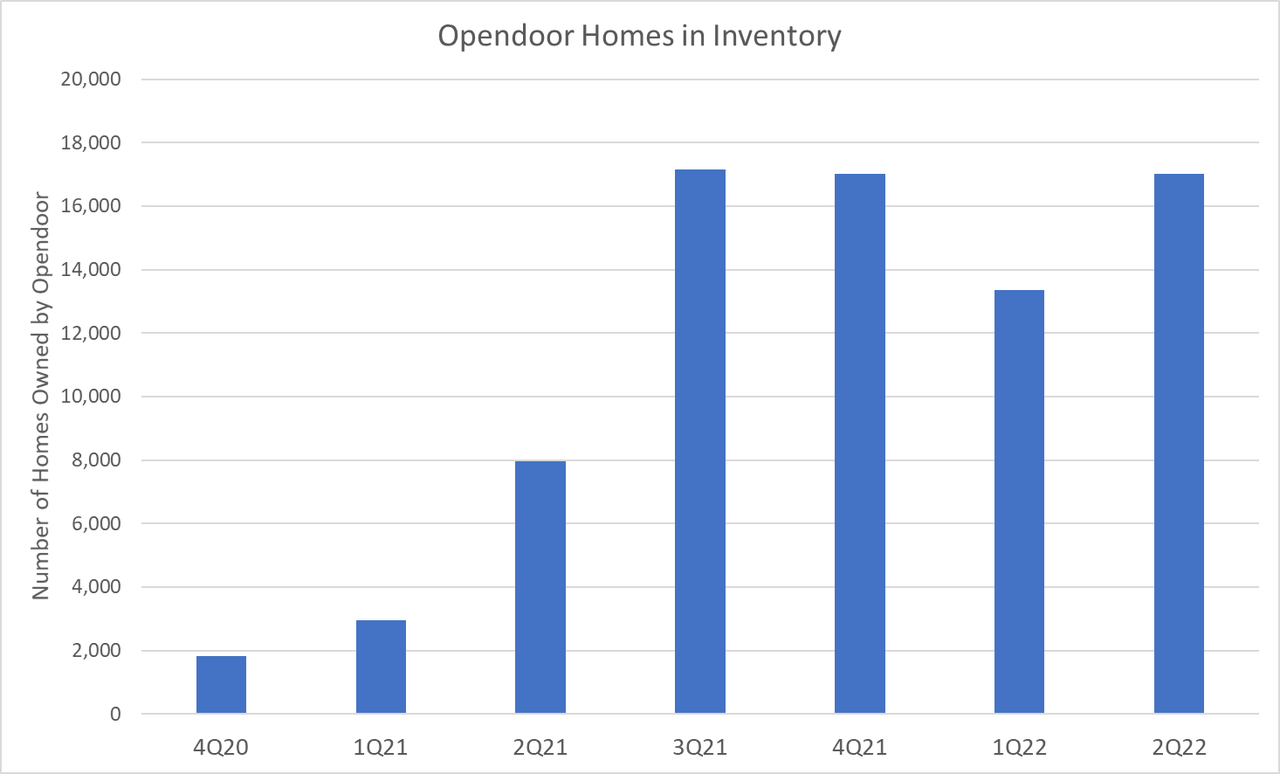
One way they could have mitigated the damage would have been to cancel contracts or reduce their purchase prices with home sellers. This right is included for Opendoor to use as an option, but they chose not to exercise it. Carrie Wheeler addressed this in the earnings call, saying, “We made the decision to close on those homes and not to reprice or cancel contracts. We believe that this is a critical brand investment that will pay dividends for years to come.”
Opendoor chose to honor their original agreements, putting their brand ahead of their short-term results. I applaud this decision. One or two quarters of losses is not worth the company’s reputation. I’m not invested because I want Q3 and Q4 numbers to look good. I’m invested because I want 2028 and 2029 numbers to look good. Prioritizing long term goals over short term results is something I want in the management team of every company I invest in.
Q3 Guidance
As much as I am ok with the way they handled the situation after the fact, that doesn’t fix the problem, which stems from them over-aggressively buying in Q2. They were too ambitious, and they will be paying for it for the entire second half of 2022. That was reflected in their Q3 guidance. They guided for $2.2B – $2.6B in revenue, which is almost half of the $4.2B in revenue they just did in Q2. It is also not enough to be able to significantly decrease the amount of houses they will have in inventory.
This hurts their business in several ways. Each day they hold those houses means their capital is tied up for longer in an existing asset rather than being able to be rolled into a new home that they can then sell. The velocity of their home sales is important, as it means they are leveraging existing capital to generate more revenue. Longer hold times also mean higher interest costs on each home, since they are bought using lines of credit. Increased holding times hits them on the top line revenue and increases their costs, hurting the bottom line. Hence their guide for -$125M to -$175M in adjusted EBITDA for Q3. After 5 straight quarters of positive adjusted EBITDA, this is a significant regression.
I might also mention here that they are also further increasing their spreads since May, so any homes they are buying now should have a very large margin of safety. However, it is absolutely hurting their conversion rates. Previously they’ve always taken pride in stating that their conversion rates are above 35%. In the Q&A session of the Q2 call, CFO Carrie Wheeler stated, “notwithstanding higher spreads, we have seen conversion outperform our expectations on a spread-adjusted basis.” That entire sentence is a load of noncommittal garbage that is meant to make investors feel nice but doesn’t actually communicate anything. My interpretation of that garbled corporate speak is that their conversion rate is down because they are sending out low-ball offers. They already have too many homes on their books and they need to make sure that anything they buy now will net them a big profit. Let’s call a spade a spade, and their current inventory situation is not good.
Was This Preventable?
One big lingering question is how preventable was this mistake? Hindsight is 20/20 and it is easy to say now that they shouldn’t have been putting all those houses under contract. One of the key reasons for the speed at which the real estate market tanked is the speed at which 30-year mortgage rates spiked in Q2 (see the chart below). Buying power is very tied to mortgage rates, and in Q2 30-year fixed mortgage rates spiked from 4.5% on April 1 all the way to 5.81% on June 23. A 400k house with a 20% down payment costs you $1,621 per month if you have a 4.5% rate on a 30-year mortgage. The exact same house at the same purchase price costs you $1,880 per month if your rate is 5.8%. That is a 16% increase in cost every month for the next 30 years. At some point, you start pricing people out of the market. An alternative way to think about it is that if you assume a 20% down payment, and your fixed monthly budget is $1,621 for a mortgage, you can only buy a $345k house instead of a $400k house.
Mortgage rates during the second quarter of 2022 (Freddie Mac)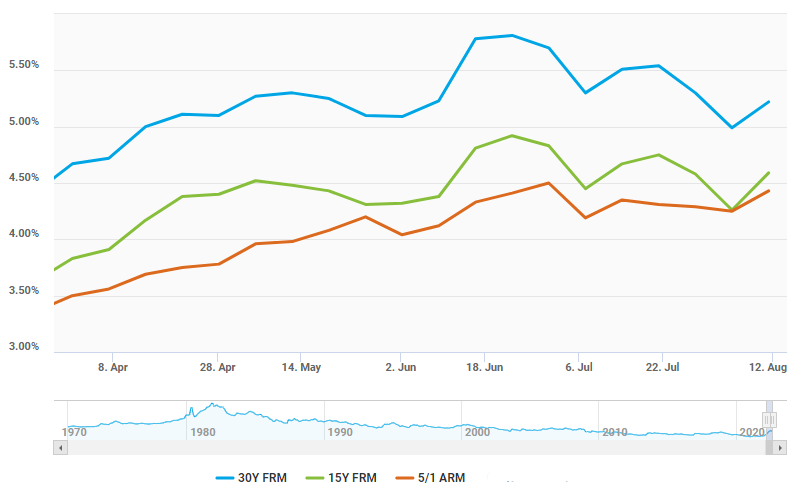
Historical Irregularity #1: 75 Basis Point Rate Hikes
The period where rates jumped from 5.1% to 5.8% in two weeks correlated exactly with the extremely hot June CPI print and the Fed’s pivot to 75 basis point hikes instead of 50 bps hikes. That was the first 75 bps hike since 1994. Here is a chart of the Nasdaq over this same time period. You’ll notice those three massive red candles in the middle that occurred at the exact same time as the huge jump in mortgage rates. The market certainly did not have those hikes priced in and it took them very off guard. That CPI print and the Fed’s reaction was a surprise to everybody. It had been almost 30 years since the last time a hike that big had occurred. I don’t fault Opendoor for not seeing it coming because nobody did.
Nasdaq stock chart during the second quarter (Tradingview)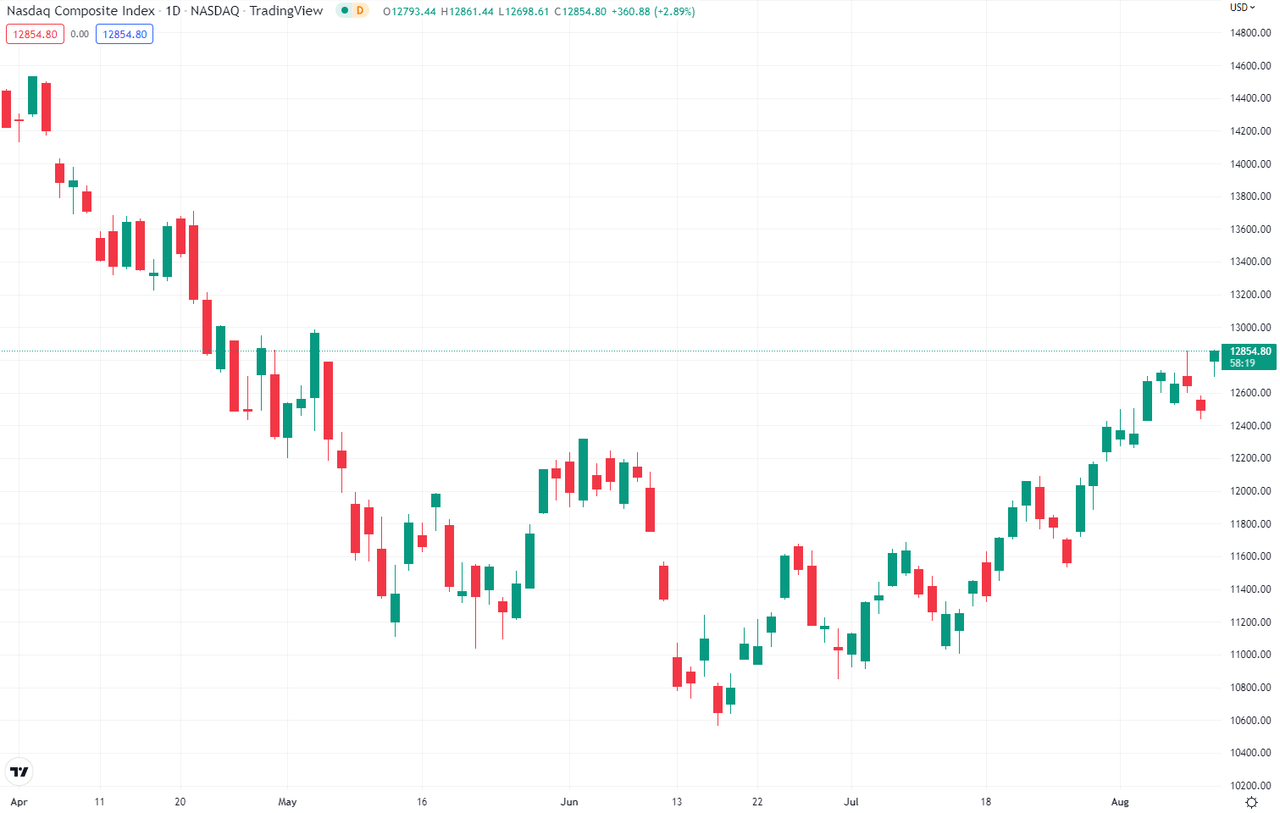
Historical Irregularity #2: The 30-Year fixed mortgage to 10-year Treasury Difference
What’s more, historically the difference between the 10-year treasury yield and the 30-year fixed mortgage rate is extremely predictable (see below, red is the 30-year fixed mortgage rate, green is the 10-year treasury yield, and the blue line is the difference). The two rates almost always move in lockstep. The first and third quartiles for the difference between the two in the last ten years of data are 1.58% and 1.83%, so it is a pretty tight range. Every once in a while it will dip slightly above or below these values, but not far in either direction, and it usually returns to equilibrium fairly quickly. The last time the difference was greater than 2.5% was 2020 when the Fed cut rates extremely quickly and increased quantitative easing, which sent the 10-year yield plummeting while mortgage rates lagged. The last time before that it went above 2.5% was 1986. So that big of a spread is extremely rare. In fact, during the entire inflationary period of the 1970s that everyone likes to compare to the current macroeconomic environment, it peaked at 2.33%. This is a once-in-40-year occurrence.
Difference between the 30-year fixed mortgage rate and the 10-year treasury yield (Federal Reserve of St. Louis)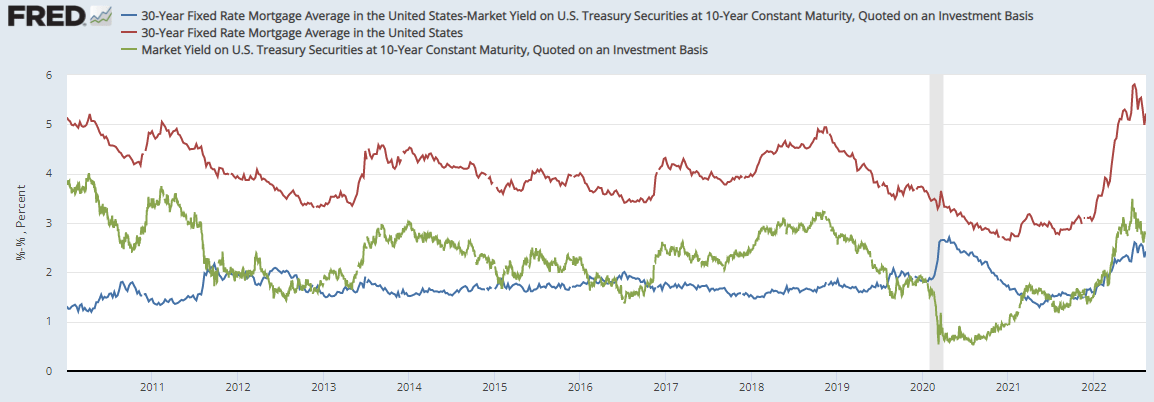
You’ll notice that it crossed that 2.5% threshold again in June. The difference peaked at 2.6%, a full 91 bps above its median value from the last 10 years. And from Opendoor’s perspective, it could not have happened at a worse time, as the 10-year yield was already spiking. The huge difference coincided with the end of Q2 and further exacerbated the shock to the real estate market. Again, it’s hard to fault management at Opendoor for something that is so rare historically.
The 75 bps rate hike is a once-in-30-year occurrence. The 30-year fixed mortgage rate to 10-year treasury yield delta going above 2.5% is a once-in-40-year occurrence. The odds that just one of these things would happen when they were making offers in May was low. The fact that either one happened at all is abnormal. That both occurred simultaneously is an anomaly among anomalies. It’s like finding a needle threaded through the eye of another needle in a haystack. And it isn’t like there is historical precedence for large rate hikes correlating to an increase in this difference. In November 1994, the last time there was a 75 bps hike, the delta was near all-time lows of 1.04%. For context, if we had that same difference in June, 30-year mortgages would have been at 4.24% and the real estate market might have seen a speed bump, but it would not have come to a screeching halt on its way over a price cliff like it just did.
No, It Was Not Predictable
In the end, here is where I come down. Yes, Opendoor could have acted with more prudence when it comes to their inventory. They could have been more conservative ahead of time, but I find it hard to blame them for not predicting the confluence of two such highly unlikely events. Even more so when you consider that there is no historical correlation between the two. You can make all the meticulous and detailed plans you want, but sometimes crap happens and you get punched in the mouth. How you respond in those situations is what defines who you are, and what will define Opendoor moving forward.
What Does Q3 Hold?
We are just over a month into the third quarter, and much remains to be seen. However, thanks to the hard work being done by Datadoor, we already have a glimpse into how Opendoor is doing. Datadoor’s information so far has proven significantly more accurate than analyst estimates. Their earnings estimates for revenue, gross margin, contribution margin, and other key variables typically fall within 3%. It is very reliable. Here is what they show for Q3 gross margins so far.
Opendoor’s Estimated Weekly Gross Margins (Datadoor.io)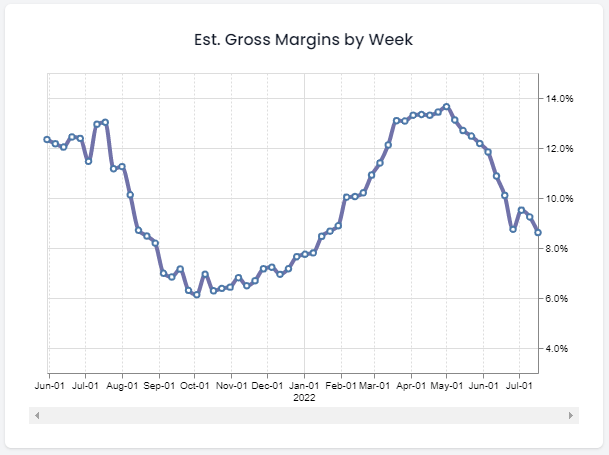
Gross margins have fallen, and the trend is still downward, but the tales that are woven of Opendoor losing tens of thousands of dollars on each home of their entire inventory are not substantiated by the aggregate data. It will be interesting to see where it goes from here. If the 30-year mortgage rate and 10-year treasury yield come back into equilibrium, things could certainly normalize. This week’s CPI print gave hints that inflation might have peaked, which would be good for mortgage rates and Opendoor, but there are still a lot of unknowns to navigate in the residential real estate market. If Opendoor learns from this, they will come out stronger on the other side.
The Zillow Partnership – If you can’t beat em, join em
Much fanfare was made when Zillow (Z) announced they were entering the iBuying game in 2018. Just as much fanfare, if not more, was made when they exited the iBuying business in 2021. Both Zillow’s entrance and Zillow’s exit were hailed as the death knell for Opendoor. In 2018, Zillow had the data and the capital to unseat Opendoor as the king of iBuying. In 2021 their failure was proof that iBuying just didn’t work.
Neither of those things is true. Zillow has vast experience in real estate, but their core operation is advertising. It’s the same sector, but a completely different business. Their culture wasn’t built for the low-margin iBuying space where cost savings in every step and hyper efficiency in execution have to be built into the fiber of the company’s DNA. Nobody knows both the pitfalls and the potential of iBuying quite as intimately as Zillow (with the exception of Opendoor, of course).
Yahoo Finance
Zillow, to their credit, realized they weren’t cut out for this. They also know that if somebody can cut through all the red tape and friction in the residential real estate system that they stand to make a ton of profit. If you can’t beat em, join em, and so Zillow has joined forces with Opendoor. Concurrent with the earnings release, Opendoor and Zillow announced a multi-year partnership. This partnership will allow sellers on the Zillow platform to seamlessly request an Opendoor offer.
This is a symbiotic relationship blooming from the ashes of a previous war zone. Zillow does what they do best – advertise and generate leads – and Opendoor now gets its product in front of 316 million monthly visits to Zillow’s website. Zillow gets a referral fee for their leads and Opendoor will be featured on a website that is the premier source for all real estate information. Monthly Zillow traffic is about 20x what Opendoor sees per month. This is a huge expansion to the top of their funnel, and means conversion rates are no longer quite as important as they used to be. When your audience is 20x bigger, even if your conversion rate drops by 10x, you still end up with double the transactions.
The 8-K – What was in it and why it matters
What really sent the stock soaring the day after earnings was the filing of an 8-K. This text comes from that report:
In connection with the Agreement, the Company issued to Zillow a warrant representing the right to purchase up to 6 million shares of the Company’s common stock, which will vest in tranches for resale services with respect to homes that qualify for a referral fee under the Agreement. The exercise price per tranche of warrant shares will equal the 30-day trailing volume weighted average price prior to the vesting date, subject to a floor of $15.00 per share and a cap of $30.00 per share.
Zillow is taking a portion of their compensation as warrants for Opendoor stock. A warrant is similar to a call option. The holder of the warrant, in this case Zillow, has the right to purchase up to 6 million shares of Opendoor stock sometime between now and July of 2027. The price they have to pay for that stock has a floor of $15/share and a ceiling of $30/share. In other words, a part of Zillow’s compensation from this agreement assumes that Opendoor stock trading above $15/share by 2027, or those warrants would all expire worthless. That is a 150% return on your investment in 5 years. The cap of $30/share also implies that they think there is significant upside above and beyond the $15 per share level.
That’s the reason the stock soared 20%+ in less than an hour. Zillow, the company who failed at iBuying, is bullish enough on Opendoor that they built into the agreement a way to gain an equity stake that is only valuable if Opendoor more than triples in value in the 5 years from the time that the agreement was made. That is a pretty big vote of confidence.
Conclusion
As of the time of writing, Opendoor has rallied 34% since the close of business before they reported earnings. This is in spite of some significant headwinds in the back half of 2022. A good amount of the reason for the steep drop off in home prices is the combination of two events that only occur once every few decades, but happened to both hit inside of the exact same month in the second quarter. As a result, the next few quarters will be rocky, but they will remain positive in gross margins and contribution margin, have plenty of cash to get through the transition, and will come out stronger on the other end. The Zillow partnership will significantly improve their outreach, and Zillow themselves are interested in owning equity in Opendoor at a cost basis almost three times its current price. I still consider this a great price for a long position in Opendoor
Be the first to comment