

CRUDE OIL, OIL PRICE NEWS & OIL FORECAST: OPEC+ SUPPLY CUT DEAL OVERSHADOWED BY LACK OF CRUDE OIL DEMAND, GLOBAL GDP GROWTH IN FREEFALL
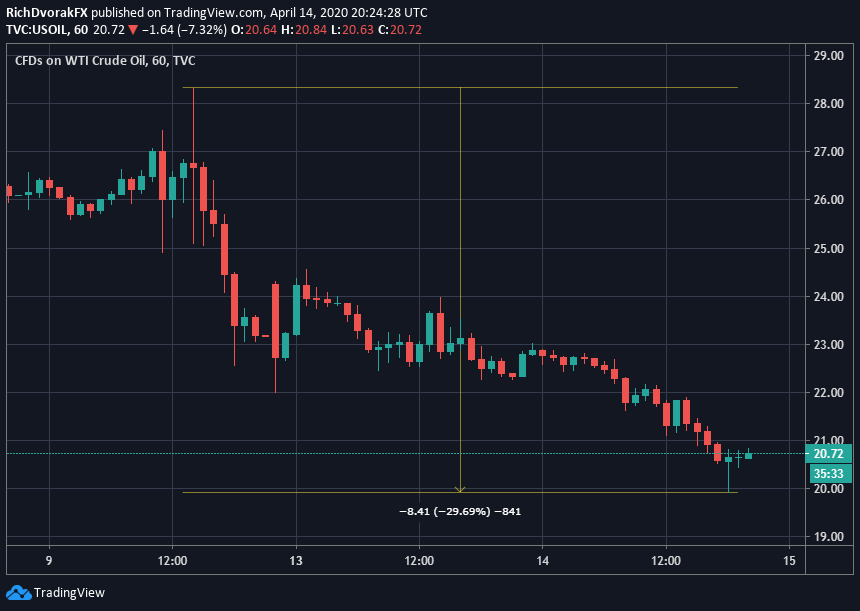
- Crude oil is probing the $20.00 price again after crashing nearly 30% over the last three trading sessions
- The OPEC+ deal supply cuts likely falls short of offsetting a collapse in crude oil demand as global GDP growth nosedives
- Commodity traders could push crude oil price action toward 18-year lows as the coronavirus recession deepens
Crude oil price action sent commodity traders on a rollercoaster ride last week amid the latest OPEC+ teleconference. The 7% gain recorded early during the April 09 trading session and start of the OPEC+ meeting, which pushed the commodity to $28.00 per barrel and more than 45% above its March 30 swing low, has since reversed sharply. Despite the cartel of petroleum producers agreeing to massive supply cuts, crude oil has notched a staggering 30% drop since last Thursday’s swing high.
CRUDE OIL PRICE CHART: 1-HOUR TIME FRAME (09 ARPRIL TO 14 APRIL 2020)
Chart created by @RichDvorakFX with TradingView
OPEC and its allies agreed to slash crude oil production by 23% during May through June but stated supply cuts are expected to scale back gradually thereon. The OPEC+ deal looks to put a bottom in crude oil prices after crashing 70% earlier this year, initially sparked by economic fallout from the coronavirus pandemic, then exacerbated by the oil price war between Saudi Arabia and Russia.

Recommended by Rich Dvorak
Learn how to analyze and react to market news in real-time
Saudi Arabia and Russia, the second and third largest crude oil producers in the world, decided end their differences agreed to scale back output to 8.5 million barrels per day. Prior to the latest OPEC+ deal, Saudi Arabia and Russia were producing over 10 million barrels per day each. As a whole, OPEC+ agreed to cut crude oil supply by a total of nearly 10 million barrels per day.
CRUDE OIL PRICE CHART: MONTHLY TIME FRAME (AUGUST 2001 TO APRIL 2020)
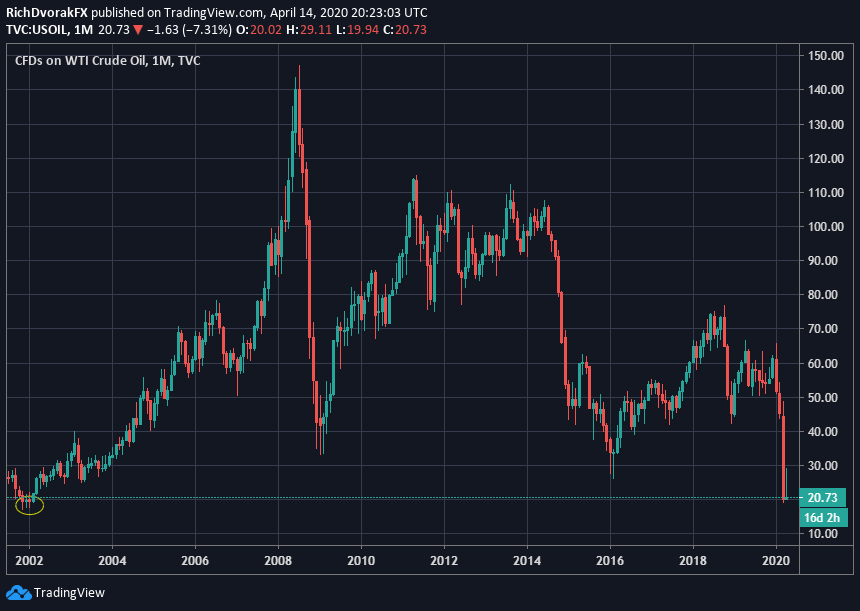
Chart created by @RichDvorakFX with TradingView
The proposed oil production cuts are expected to fall far short of the estimated collapse in crude oil demand, which has stemmed from the likely unavoidable recession and global coronavirus lockdown. The free-fall in crude oil demand mirrors the nosedive in global GDP growth projections. On that note, IMF economic outlook just detailed a gloomy -3.0% contraction in global GDP growth for 2020 as COVID-19 sparks the ‘deepest global recession since the 1930s during the great depression.’ This likely exacerbated recent bearish crude oil price action that has ensued subsequent to the OPEC+ deal.
| Change in | Longs | Shorts | OI |
| Daily | 10% | -2% | 8% |
| Weekly | 32% | -14% | 21% |
As such, there may be potential for crude oil to drop below $20, considering market supply and demand likely remain out of balance, even despite the OPEC+ deal. Also, as the economy struggles to match the consensus view of a ‘V-shape’ recovery, and unemployment spikes further, there could be another wave of risk aversion that adds to recent oil selling pressure. Correspondingly, the 2001 lows near the $17.00 price might come into focus if crude oil bears can make a push below the $20.00 handle.
— Written by Rich Dvorak, Analyst for DailyFX.com
Connect with @RichDvorakFX on Twitter for real-time market insight
Be the first to comment