

Khanchit Khirisutchalual
Thesis
Despite all the gloom over Omega Healthcare Investors, Inc. (NYSE:OHI) over the past year, OHI still posted a YTD total return of 13.8%, boosted by the robustness of its dividend yields.
We expected the triple-net lease healthcare REIT stock to pull back further in our previous article in September. However, buyers proved resilient, as it supported OHI’s September lows, given the valuation discount against its REIT peers in general.
Our analysis suggests that a significant level of pessimism has likely been priced into OHI’s valuation. Notwithstanding, the company continues to deal with operator restructuring challenges, which could impact its funds available for distribution (FAD) moving forward. However, management also highlighted that it was confident that the operating landscape had improved QoQ through October.
Therefore, we postulate that the worst in OHI’s rent collections could be over in FY22, as it laps easier comps next year. Furthermore, inflation challenges could be less significant moving ahead as inflation expectations have continued to trend downward. While still elevated, we believe the worst of the inflationary headwinds have likely been reflected, which augurs well for Omega Healthcare’s operators in the medium term.
Notwithstanding, we assess that a near-term re-rating is unlikely, given existing labor shortages, occupancy, and EBITDAR coverage headwinds. However, we also believe that the current levels are appropriate for OHI investors to layer in accordingly, capitalizing on its attractive dividend yields that remain well-covered by its FAD.
Revising from Hold to Buy.
OHI: Wall Street Likely Pulled Out Their Bear Case
Wall Street analysts remain highly concerned over the sustainability of the company’s FAD visibility moving ahead, given the declining rent coverage on a TTM basis.
Accordingly, Omega Healthcare posted TTM EBITDAR coverage (ex-federal stimulus) of 0.9x in FQ2, down from 0.92x in FQ1. Furthermore, the company reported 27 operators, representing 38.4% of its rental/debt service base, have EBITDAR coverage of less than 1x as of FQ2.
Therefore, on a TTM basis, it certainly didn’t look promising, suggesting that Omega Healthcare operators have continued to struggle. Notwithstanding, management also provided constructive commentary indicating improving operator economics moving ahead, as COO Dan Booth articulated:
Occupancy for our overall core portfolio has steadily trended up from a low of 74.6% in January to 78% as of mid-October. [Our senior housing] portfolio on a pure-play basis had its trailing 12-month EBITDAR lease coverage increased to 0.94x at the end of the second quarter as compared to the end of the first quarter, which covered at 0.93x. Based upon preliminary results, occupancy for this portfolio has recovered to 85.8% as of mid-October 2022 versus 83% in January 2022. (Omega Healthcare FQ3’22 earnings call)
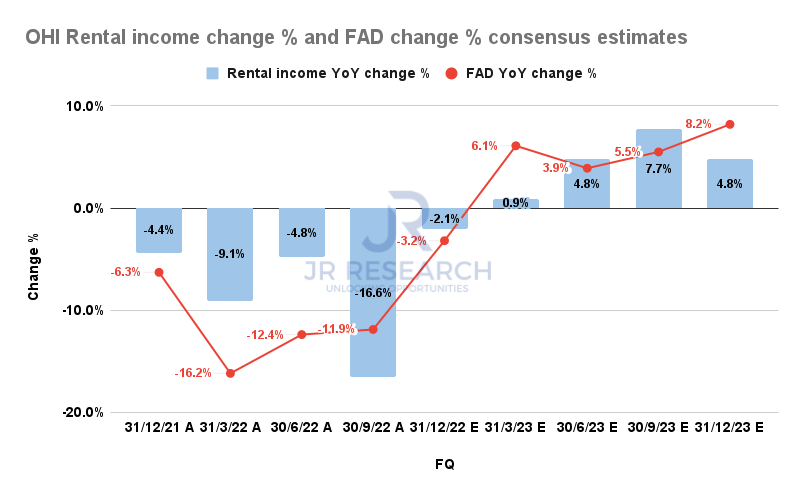
OHI Rental income change % and FAD change % consensus estimates (S&P Cap IQ)
Therefore, we postulate that the consensus estimates are credible, modeling for an improvement in its rental income performance through FY23. Notwithstanding, much depends on whether the QoQ improvement in its operators could be sustained to resume rent payments. Also, it depends on whether Omega Healthcare could re-lease its facilities expeditiously.
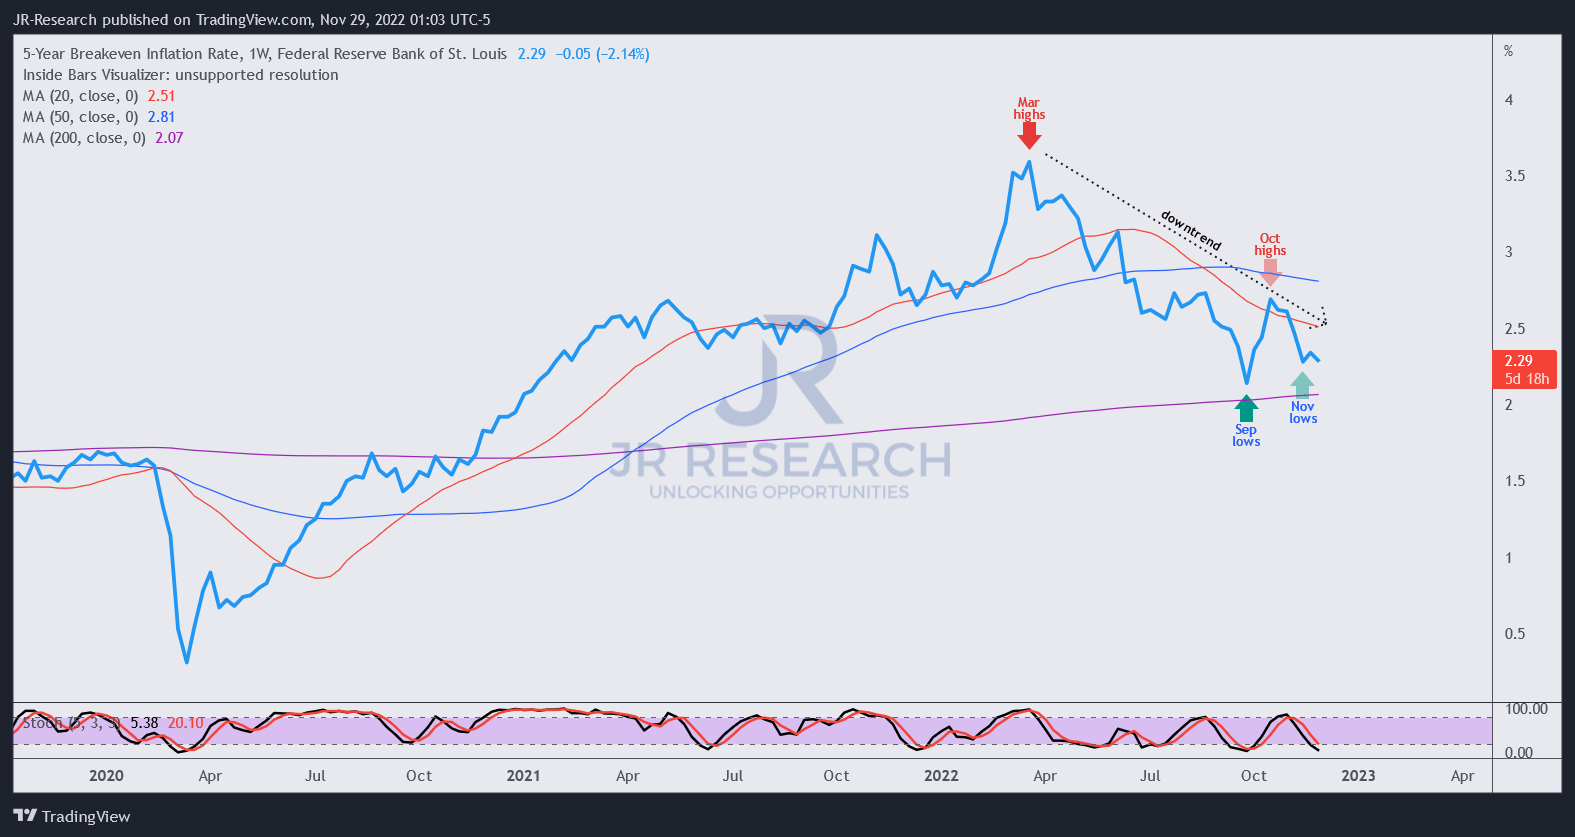
5Y Breakeven inflaton rate % (TradingView)
Furthermore, the 5Y breakeven inflation rate has been trending downward from its March highs. Therefore, medium-term inflation expectations have fallen markedly, corroborating the relative success of the Fed’s rate hikes.
As such, we believe a critical headwind that has held back the operating performance of its tenants could be less significant moving forward, providing more visibility for Omega Healthcare’s ability to collect rent.
Is OHI Stock A Buy, Sell, Or Hold?
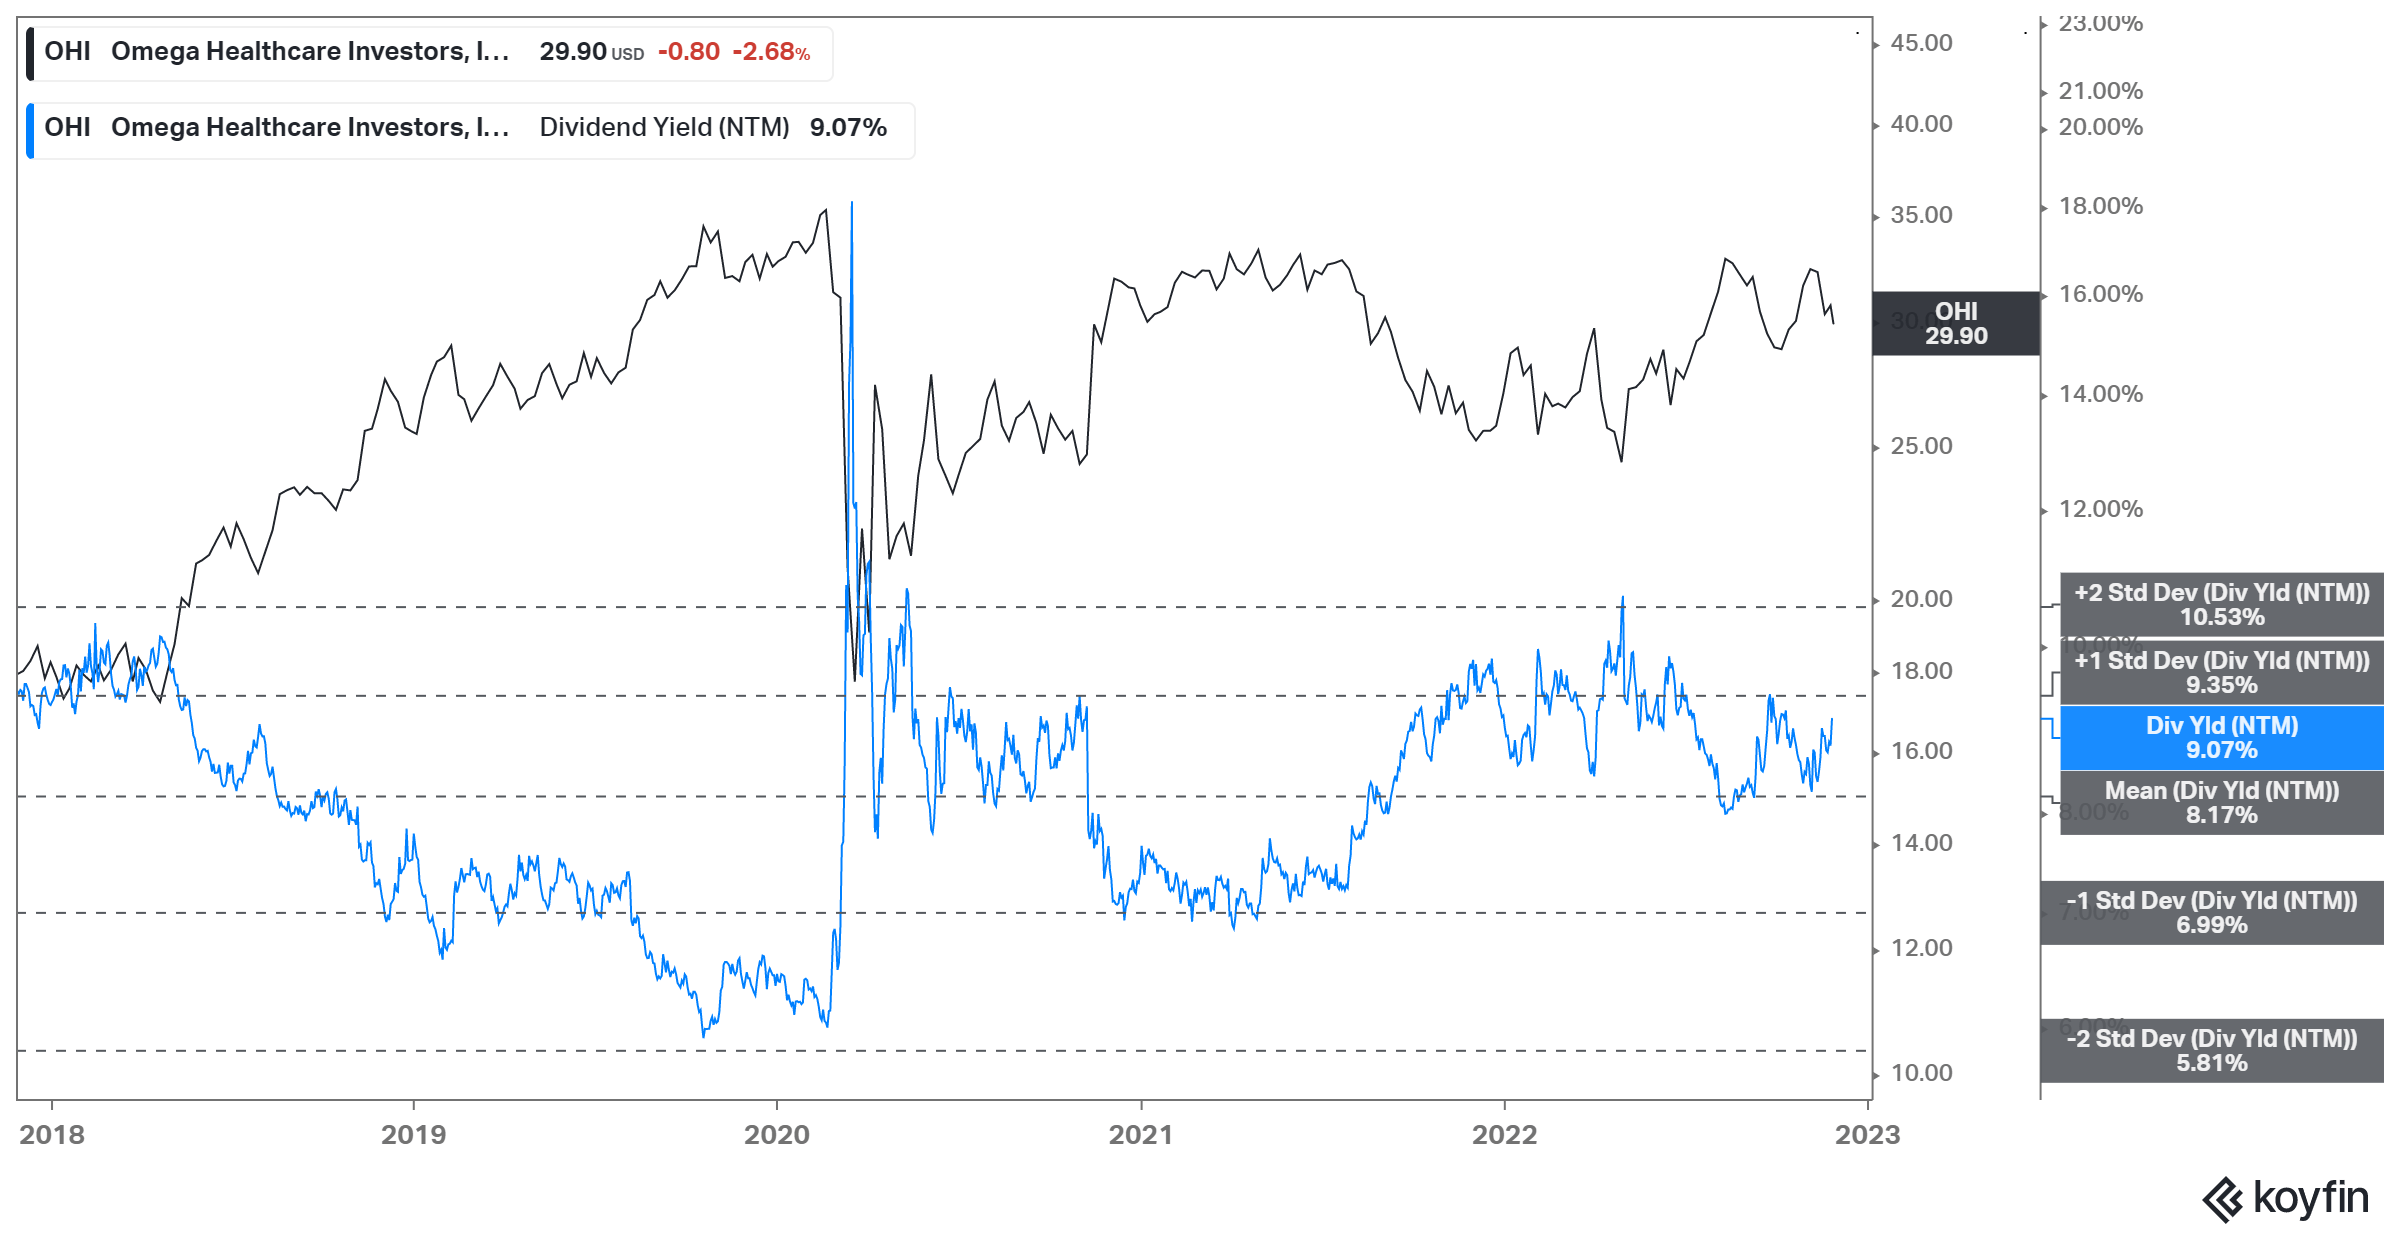
OHI NTM Dividend yields % valuation trend (koyfin)
OHI last traded at an NTM dividend yield of 9.1%, above its 10Y average of 8.2%. While not priced at distressed levels, we believe the discount has likely reflected its execution risks in the current environment.
Also, OHI’s NTM AFFO per share multiple of 10.2x remains below its 10Y average of 11.8x. It’s also below its REIT peers’ median of 14.2x (according to S&P Cap IQ data), suggesting OHI’s valuation is not aggressively configured.
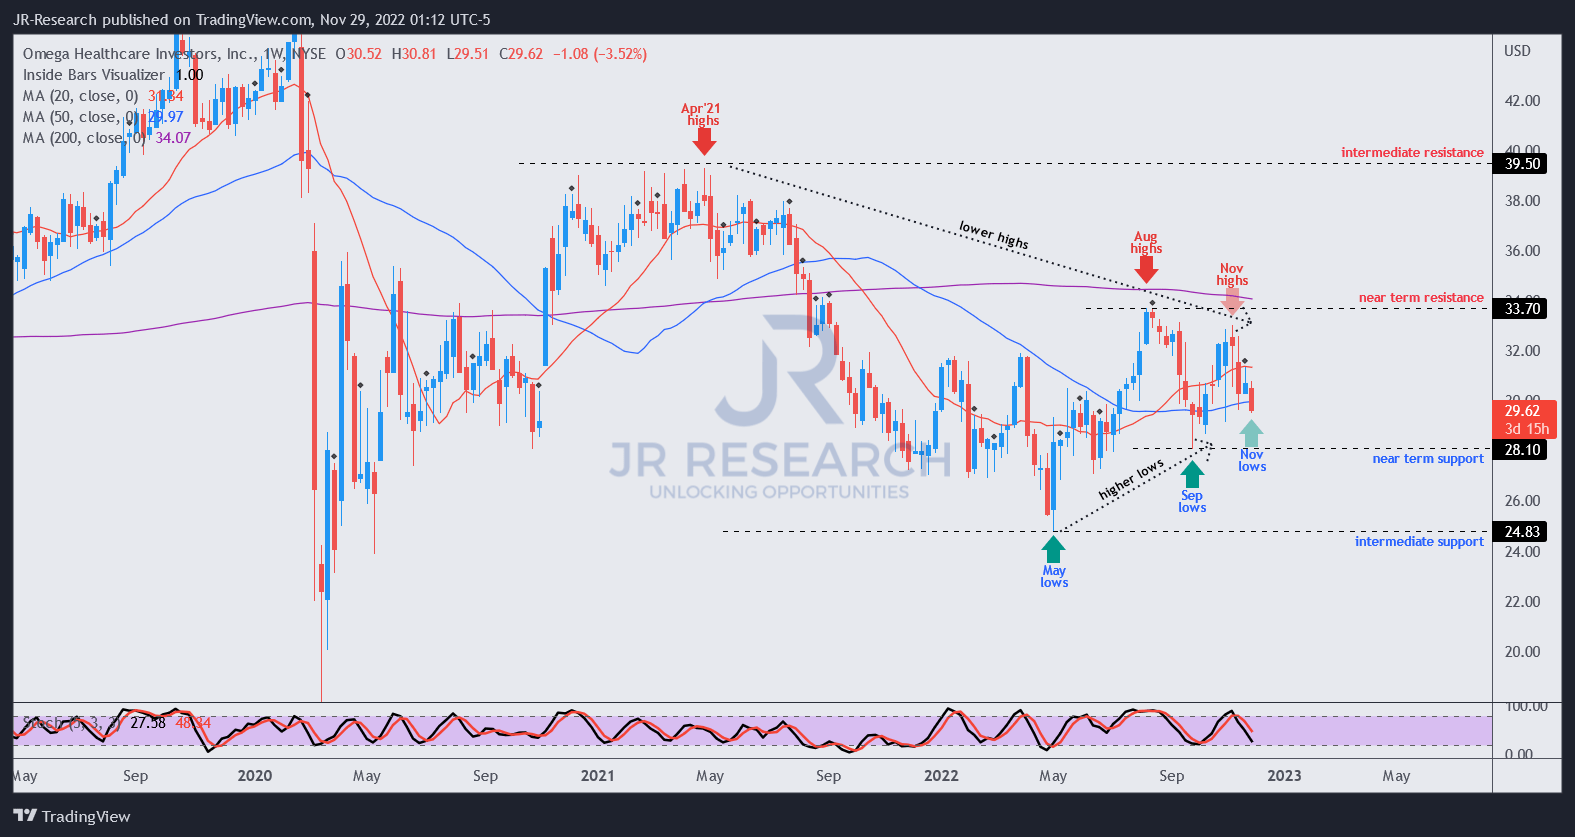
OHI price chart (weekly) (TradingView)
OHI is at a critical juncture, but its price action remains constructive.
As seen above, OHI’s September lows held robustly, as the 50-week moving average (blue line) has continued to bolster its medium-term uptrend recovery.
Notwithstanding, OHI has been forming lower highs since its August highs. Therefore, we will be keen to assess the buying momentum at its subsequent re-test.
Given the recent pullback and reasonable valuation, we believe investors can consider adding exposure at the current levels.
Revising from Hold to Buy.
Be the first to comment