

Oil Price Talking Points
The price of oil holds near the yearly high ($74.45) as US inventories contract for seven consecutive weeks, and signs of stronger demand may keep the Organization of the Petroleum Exporting Countries (OPEC) on track to gradually restore production as the group sticks to the production adjustment table from earlier this year.
Oil Price Resilience Pushes RSI Towards Overbought Territory Again
The price of oil attempts to retrace the decline from the start of the week as US inventories fall 6.718M in the week ending June 25 after tumbling 7.614M the week prior, and OPEC and its allies may continue to push production towards pre-pandemic levels as the most recent Monthly Oil Market Report (MOMR) insists that “demand for OPEC crude is forecast to stand at 27.7 mb/d, unchanged from last month’s assessment and around 5.0 mb/d higher than in 2020.”
As a result, the ongoing improvement in oil consumption may keep crude prices afloat ahead of OPEC’s Joint Ministerial Monitoring Committee (JMMC) meeting on July 1, and the group may lay out an updated production adjustment table as US output remains subdued.
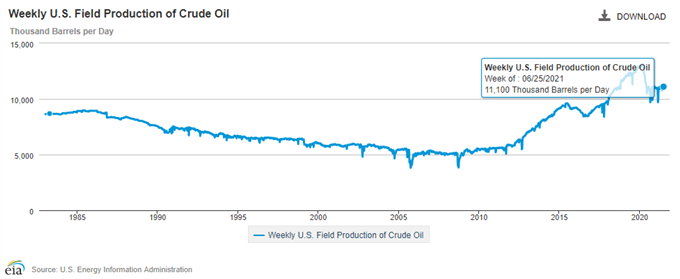
A deeper look at the fresh figures from the Energy Information Administration (EIA) shows weekly field production holding steady at 11,100K for the second week, and the stagnant recovery in US output may keep OPEC and its allies on track to gradually restore production throughout the remainder of the year as it remains below pre-COVID levels.
With that said, the price of oil may continue to exhibit a bullish trend as the recovery in global demand is met with limited supply, and another move above 70 in the Relative Strength Index (RSI) is likely to be accompanied by higher crude prices like the behavior seen earlier this year.
Oil Price Daily Chart
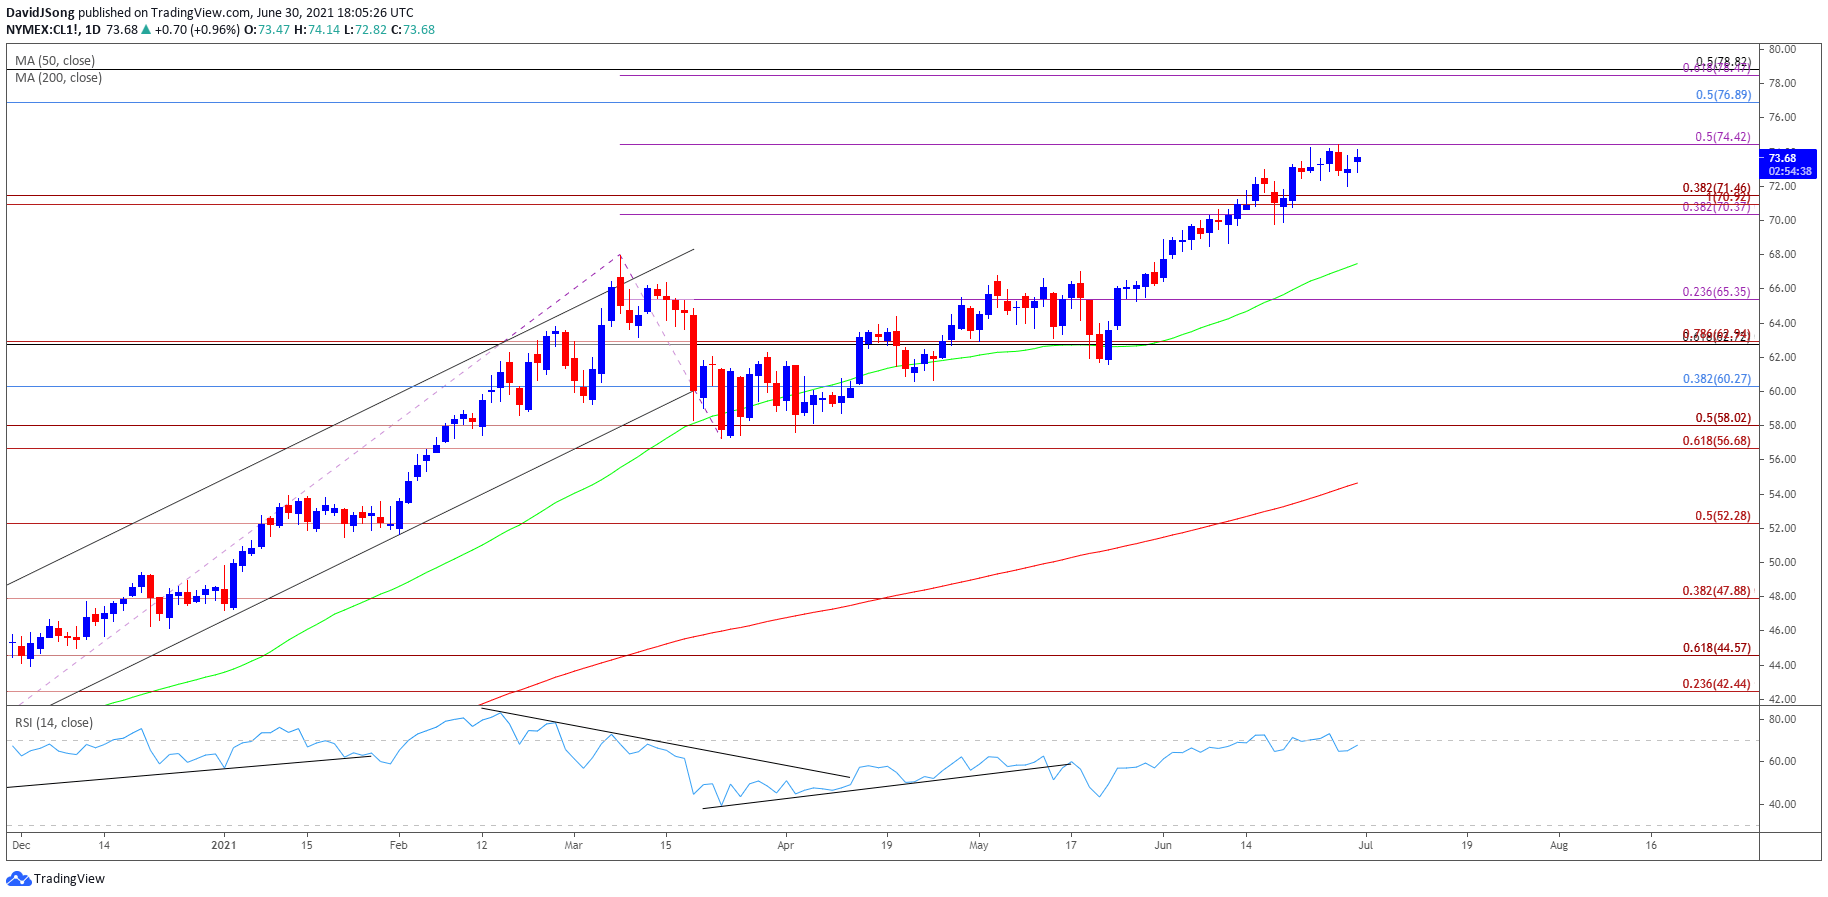
Source: Trading View
- Keep in mind, crude broke out of the range bound price action from the third quarter of 2020 as it established an upward trending channel, with the price of oil taking out the 2019 high ($66.60) as both the 50-Day SMA ($67.48) and 200-Day SMA ($54.65)established a positive slope.
- The price of oil may continue to exhibit a bullish trend as the recent rally removes the threat of a double-top formation, but the rally appears to have stalled ahead of the 2018 high ($76.90), but the string of failed attempts to break/close above the $74.40 (50% expansion) region may keep crude prices within a narrow range following the textbook sell signal in the Relative Strength Index (RSI).
- Lack of momentum to hold above the Fibonacci overlap around $70.40 (38.2% expansion) to $71.50 (38.2% expansion) may generate a larger correction in crude, with a move below the 50-Day SMA ($67.48) opening up the $65.40 (23.6% expansion) region.
- Nevertheless, another move above 70 in the RSI is likely to be accompanied by higher crude prices like the behavior seen earlier this year, but need a break/close above $74.40 (50% expansion) to bring the $76.90 (50% retracement) region on the radar, with the next area of interest coming in around $76.90 (50% retracement), which coincides with the 2018 high ($76.90).
— Written by David Song, Currency Strategist
Follow me on Twitter at @DavidJSong
Be the first to comment