

Oil Price Talking Points
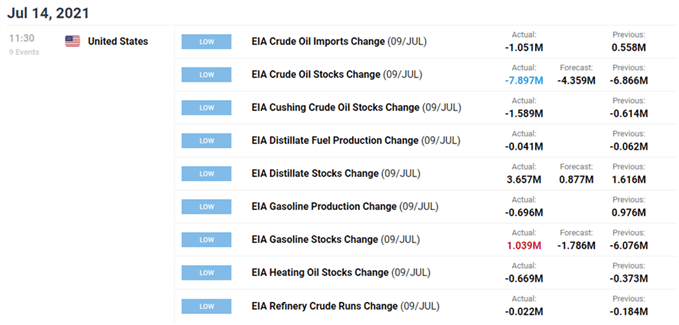
The price of oil gives back the rebound from the monthly low ($70.76) even as US inventories contract for nine straight weeks amid the ongoing deadlock within the Organization of the Petroleum Exporting Countries (OPEC).
Oil Price Rebound Unravels as OPEC+ Negotiations Still Continue
The price of oil slips to a fresh weekly low ($71.50) as the United Arab Emirates Ministry of Energy & Infrastructure retweets the Emirates News Agency that negotiations within OPEC+ are ‘still continuing,’ and the rift may continue to produce headwinds for crude as “the UAE is willing to extend the agreement further, if required, but requests that baseline production references be reviewed to ensure that they are fair to all parties as/when an extension is agreed to.”
It seems as though the UAE is in no rush to draw up a new production adjustment table as the “OPEC+ agreement is scheduled to run for another nine months until April 2022,” and it remains to be seen if the fresh US data prints will influence the group as crude inventories tumble 7.897M in the week ending July 9 after contracting 6.866M the week prior.
Signs of a stronger demand may keep OPEC and its allies on track to push production towards pre-pandemic levels as the latestMonthly Oil Market Report (MOMR)emphasizes that “world oil demand growth in 2021 is forecast at 6.0 mb/d, unchanged from last month’s assessment,” while “total oil demand is projected to average 96.6 mb/d” for 2021.”
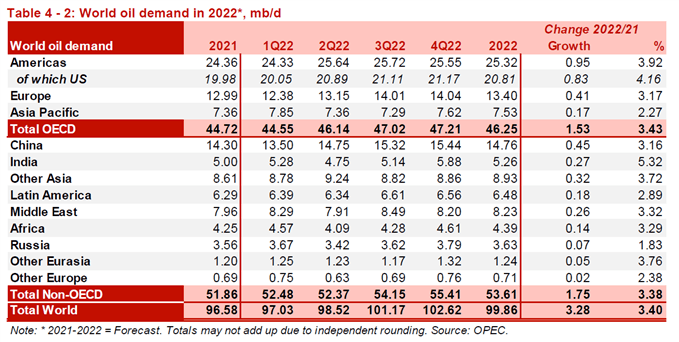
The MOMR goes onto say that “solid expectations for global economic growth are assumed to spur consumption for oil in 2022, with world oil demand forecast to grow by 3.3 mb/d y-o-y, to average 99.9 mb/d,” and evidence of stronger consumption may keep the price of oil afloat as “world oil demand in 2H22 is expected to exceed 100 mb/d.”
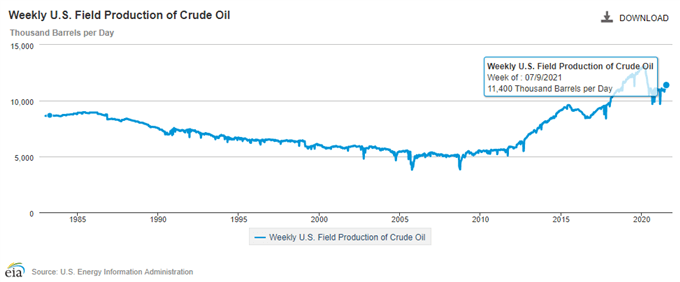
However, a deeper look at the figures from the Energy Information Administration (EIA) showed weekly field production climbing to 11,400K from 11,300K in the week ending July 2 to mark the highest reading since May 2020, and a further recovery in US output may drag on the price of oil as OPEC and its allies struggle to meet on common ground.
With that said, the price of oil may continue to track the monthly range amid indications of stronger supply, and the decline from the yearly high ($76.98) may turn into a more pronounced correction as the Relative Strength Index (RSI) appears to be establishing a downward trend after flashing a textbook sell signal earlier this month.
Oil Price Daily Chart
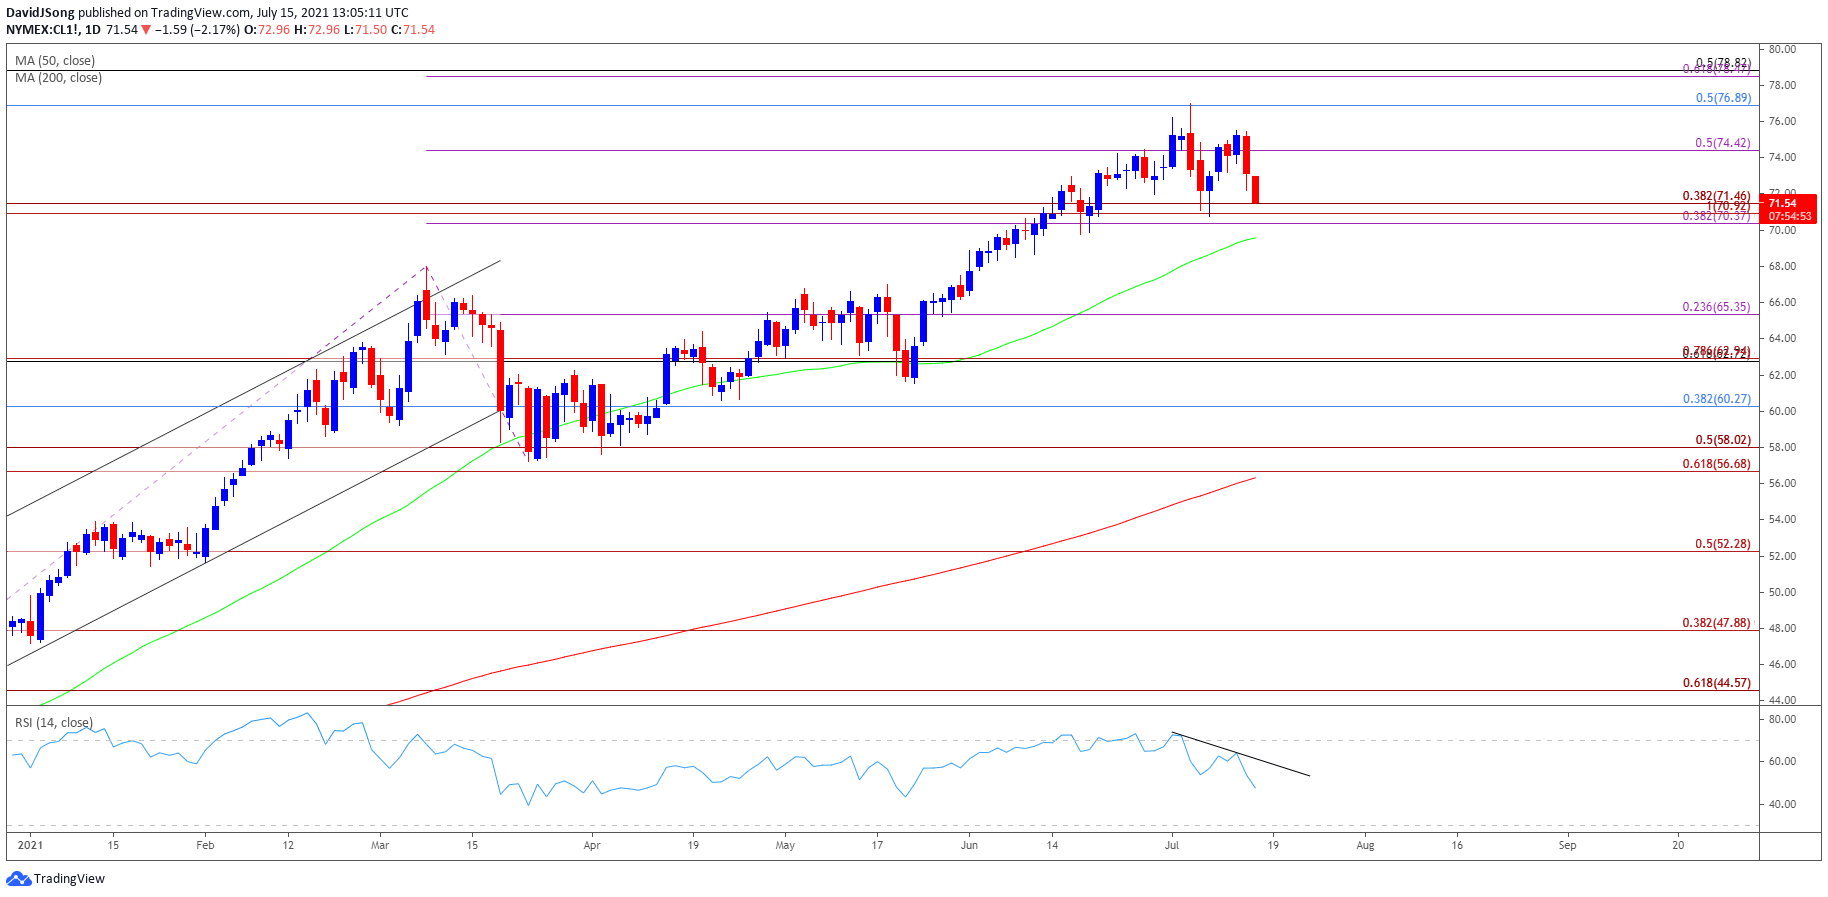
Source: Trading View
- Keep in mind, crude broke out of the range bound price action from the third quarter of 2020 as it established an upward trending channel, with the price of oil taking out the 2019 high ($66.60) as both the 50-Day SMA ($69.59) and 200-Day SMA ($56.33)established a positive slope.
- The price of oil may continue to exhibit a bullish trend as the recent rally removes the threat of a double-top formation, but crude appears to have reversed course after taking out the 2018 high ($76.90), with the Relative Strength Index (RSI) highlighting a similar dynamic as it appears to be establishing a downward trend after flashing a textbook sell signal earlier this month.
- Crude may continue to track the monthly range as the broader outlook remains constructive, but failure to hold above the Fibonacci overlap around $70.40 (38.2% expansion) to $71.50 (38.2% expansion) may generate a larger correction in the price of oil, with a move below the 50-Day SMA ($69.59) opening up the $65.40 (23.6% expansion) region.
- At the same time, lack of momentum to push below the Fibonacci overlap around $70.40 (38.2% expansion) to $71.50 (38.2% expansion) may keep the price of oil within a defined range, but a break/close above the $76.90 (50% retracement) region may open up the $78.50 (61.8% expansion) to $78.80 (50% retracement) area.
— Written by David Song, Currency Strategist
Follow me on Twitter at @DavidJSong
Be the first to comment