

Oil Price Talking Points
The price of oil extends the rebound from the weekly low ($70.76) as US inventories contract for eight consecutive weeks, but recent price action warns of a larger correction in crude as it extends the series of lower highs and lows from earlier this week.
Oil Price Rebound Emerges as US Inventories Contract for Eighth Week
The price of oil attempts to retrace the decline from the yearly high ($76.98) as US inventories fall 6.866M in the week ending July 2 after narrowing 6.718M the week prior, and the data prints may encourage the Organization of the Petroleum Exporting Countries (OPEC) to draw up a new production adjustment table as it instills an improved outlook for consumption.
As a result, looming developments from OPEC are likely to sway crude prices as Secretary General Mohammad Barkindo insists that “the date of the next meeting will be decided in due course” after calling off the Joint Ministerial Monitoring Committee (JMMC) meeting for July.
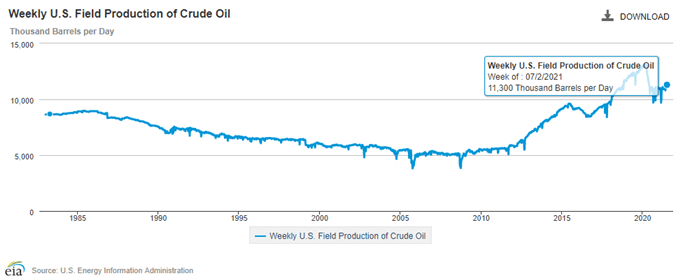
However, the fresh figures from the Energy Information Administration (EIA) shows weekly field production widening to 11,300K from 11,100K during the same period to mark the highest reading since May 2020, and the pick up in US output may spur a greater dissent within OPEC as it approaches pre-pandemic levels.
In turn, a further recovery in US supply may generate headwinds for crude as OPEC and its allies struggle to meet on common ground, and recent price action warns of a larger correction as the price of oil extends the series of lower highs and lows from earlier this week.
With that said, the Relative Strength Index (RSI) highlights a similar dynamic as it falls back from overbought territory to indicate a textbook sell signal, and it remains to be seen if the pullback from the yearly high ($76.98) will turn out to be a correction in the broader trend or a potential shift in market behavior as the price of oil appears to have reversed course after clearing the 2018 high ($76.90).
Oil Price Daily Chart
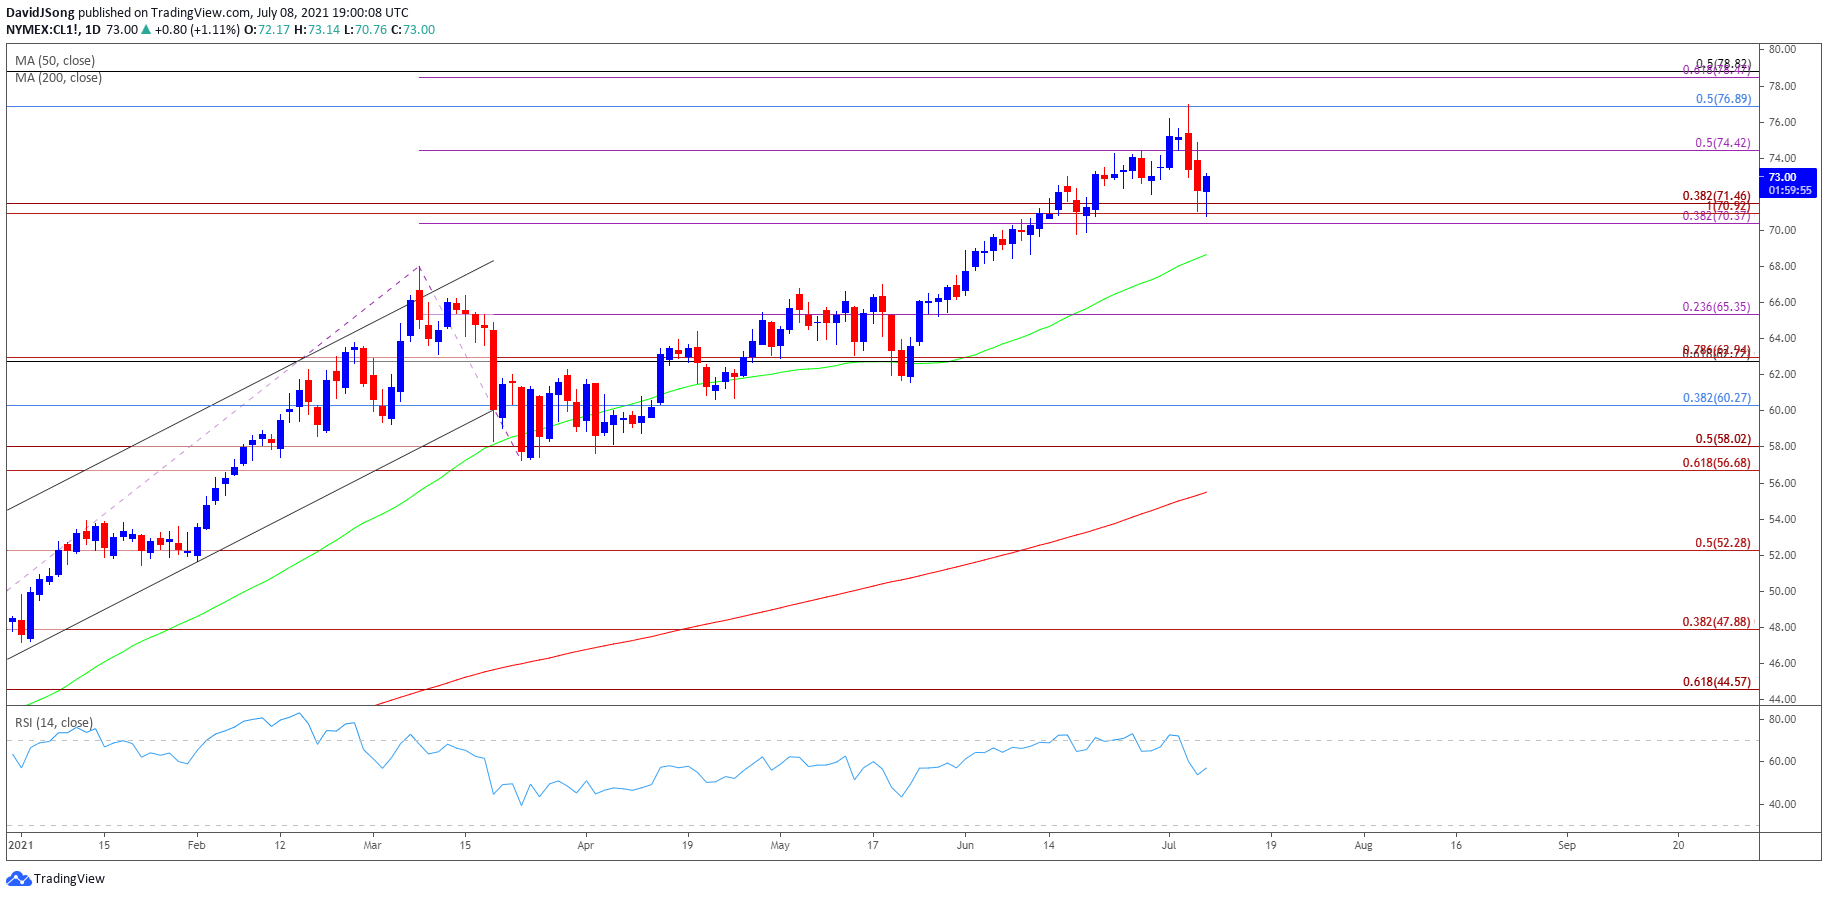
Source: Trading View
- Keep in mind, crude broke out of the range bound price action from the third quarter of 2020 as it established an upward trending channel, with the price of oil taking out the 2019 high ($66.60) as both the 50-Day SMA ($68.65) and 200-Day SMA ($55.49)established a positive slope.
- The price of oil may continue to exhibit a bullish trend as the recent rally removes the threat of a double-top formation, but crude appears to have reversed course after taking out the 2018 high ($76.90), with the Relative Strength Index (RSI) highlighting a similar dynamic as it falls back from overbought territory to indicator a textbook sell signal.
- In turn, a break/close below the Fibonacci overlap around $70.40 (38.2% expansion) to $71.50 (38.2% expansion) may generate a larger correction in crude, with a move below the 50-Day SMA ($68.65) opening up the $65.40 (23.6% expansion) region.
- At the same time, lack of momentum to push below the Fibonacci overlap around $70.40 (38.2% expansion) to $71.50 (38.2% expansion) may undermine the recent series of lower highs and lows in the price of oil, with a move above the $74.40 (50% expansion) region bringing the $76.90 (50% retracement) area back on the radar.
— Written by David Song, Currency Strategist
Follow me on Twitter at @DavidJSong
Be the first to comment