gerenme/iStock via Getty Images
Energy: Fabulous Performance and Abundant Uncertainty
Even though energy has been the best-performing sector of the year by a large margin, many investors are uncertain about the sector; rightfully so. With recent volatility, conflicting analysis, and a constant stream of both bullish and bearish news, it can be hard to say if investors should run screaming for the door or buy.
Why Oilfield Services: Inelastic Demand and Production Decline
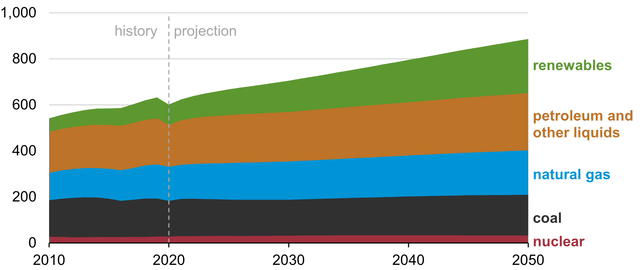
In October of 2021, EIA published its latest International Energy Outlook including this plot of historic and future global energy consumption.
Global Energy From All Sources: 2010 – 2021
Historically, total energy demand has grown steadily and has proven inelastic even through the pandemic period. Global demand for oil and gas is projected to remain constant and in some forecasts grow slightly over the next three decades. Further, renewable energy is not likely to offset demand for oil and gas over the period. Rather, increased renewable energy supply will be absorbed by increased demand for energy from all sources
Currently, over 70% of total U.S. natural gas and 60% U.S. oil is produced from tight reservoirs, according to the EIA. Production from tight reservoirs is subject to typical steep production decline.
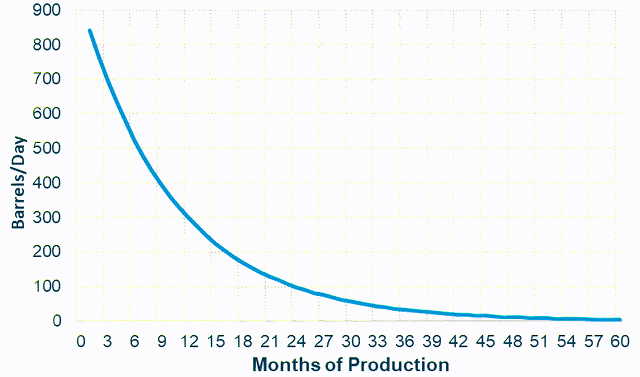
Typical Single Well Production Decline
In this example, initial production of almost 800 barrels per day (bpd) drops by more than 50% to about 300 bpd at 12 months. After 3 years, production is less than 50 bpd, or about 6% of initial production. Metaphorically, maintaining production in tight reservoirs is more like mowing the lawn than planting a tree; new wells must be drilled and completed on a regular schedule. Growing revenue for oilfield services is almost certain and will likely drive price return.
Oilfield Services: Value Matrix
Fifty-three oilfield service (OFS) equities including several selected by the author and the holdings of 2 large OFS ETFs (OIH and XES) were evaluated using a value matrix including factors for value, growth, profitability, ownership, and debt. The complete raw data and calculations are available to download in a downloadable Excel file.
Value Matrix Chart
Author, SA Data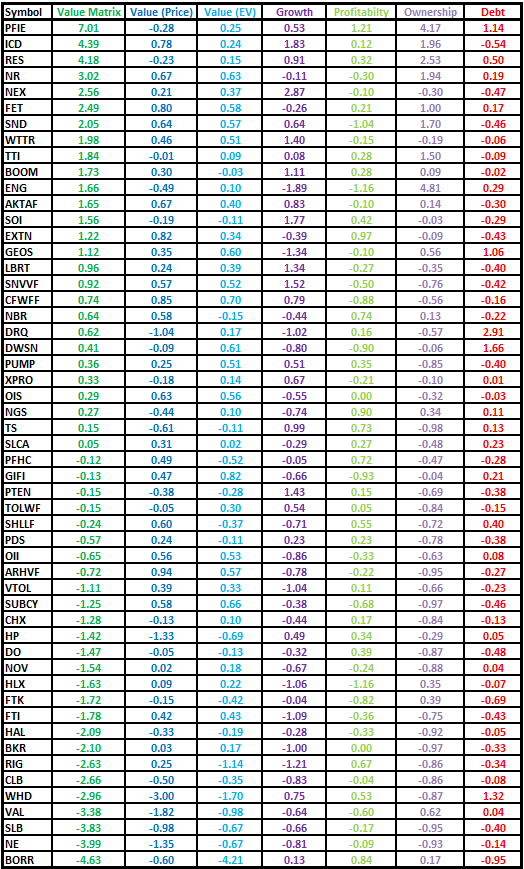
The 53 OFS equities were ranked from highest value matrix score (PFIE) to lowest score (BORR).
Value Matrix: Top 10
Author, SA Data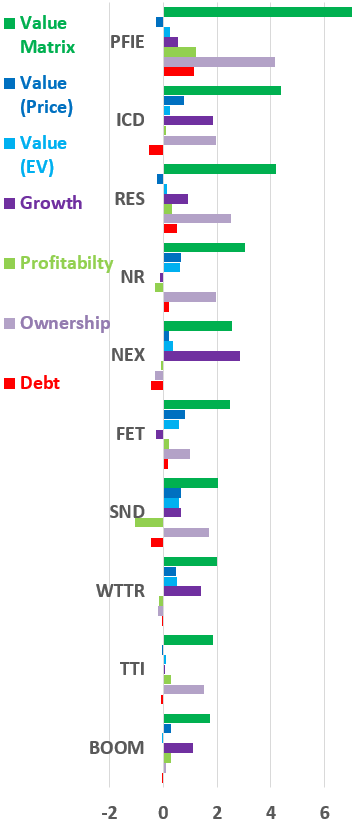
Value Matrix – The top ten OFS equities are plotted in descending order by value matrix sum represented by the dark green bar.
Value (Price)– This factor (the dark blue bar) is normalized as follows: [Average (Price/Sales) – Price/Sales] / Average(Price/Sales). Positive and negative values reflect Price/Sales lesser and greater than average respectively.
Value (EV)– This factor (the light blue bar) is normalized as follows: [Average(EV/Sales) – EV/Sales] / Average(EV/Sales). Positive and negative values reflect EV/Sales lesser and greater than average respectively.
Growth Factor – this factor (the purple bar) is normalized as follows: [Rev YoY – Average(Rev YoY)] / Average(Rev YoY). Positive and negative values reflect YoY revenue growth greater and lesser than average respectively.
Value Matrix: Bottom Ten
Author, SA Data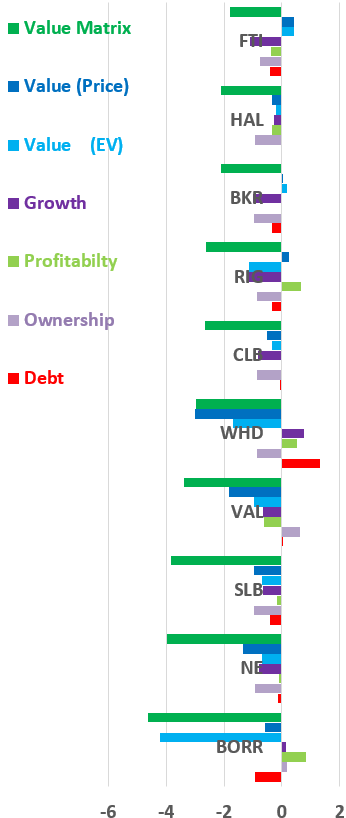
Profitability Factor – this factor (the light green bar) is normalized as follows: [Profit Margin – Average (Profit Margin)] / Average (Profit Margin). Positive and negative values reflect profit margin greater and lesser than average respectively.
Ownership Factor – this factor (the light purple bar) is normalized as follows: [ Insider % – Average (Insider %)] / Average(Insider %). Positive and negative values reflect insider ownership greater and lesser than average respectively.
Debt Factor – This factor (the red bar) is normalized as follows: [Current Ratio – Average (Current Ratio)] / Average (Current Ratio) . Positive and negative values reflect current ratio greater and lesser than average respectively.
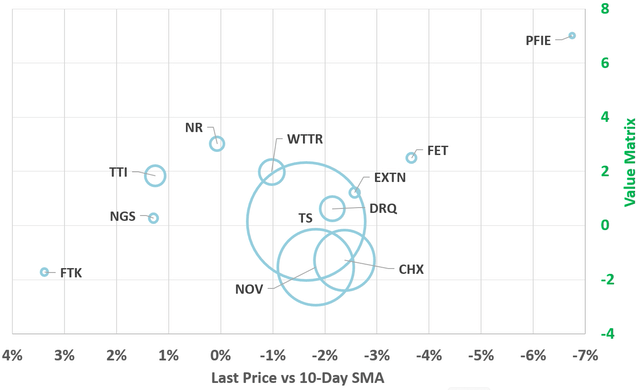
Chemicals and Equipment: Value vs Momentum
Oilfield chemicals and equipment supplier value matrix vs 10-Day momentum is plotted with bubble size proportional to market cap. Larger caps (TS, NOV, & CHX) appear to be most resistant to short term trends, while smaller caps (FTK & PFIE) have responded sharply. By value matrix, smaller caps (PFIE, NR, and FET) score highest while NOV & CHX score lowest amongst oilfield chemicals and equipment suppliers.
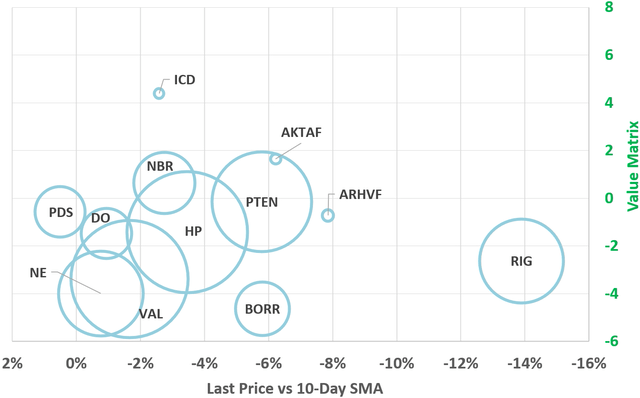
Drillers: Value vs Momentum
Driller value matrix vs 10-Day momentum is plotted with bubble size proportional to market cap. VAL & DO appear to be most resistant to short term trends while RIG has responded sharply. By value matrix, smaller caps (ICD & OTCPK:AKTAF) score highest while BORR scores lowest in the driller segment.
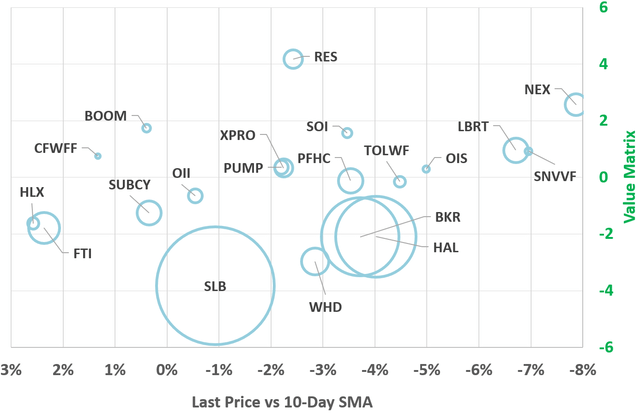
Well Services: Value vs Momentum
Well services value matrix vs 10-Day momentum is plotted with bubble size proportional to market cap. Larger cap SLB appears to be most resistant to short term trends, while smaller caps (NEX, OTCPK:SNVVF, & HLX) have responded sharply. By value matrix, smaller caps (RES, NEX, & BOOM) score highest while NOV & CHX score lowest amongst oilfield chemicals and equipment suppliers.
Engineering, Lab Services, Frac Sand, & Other: Value vs Momentum
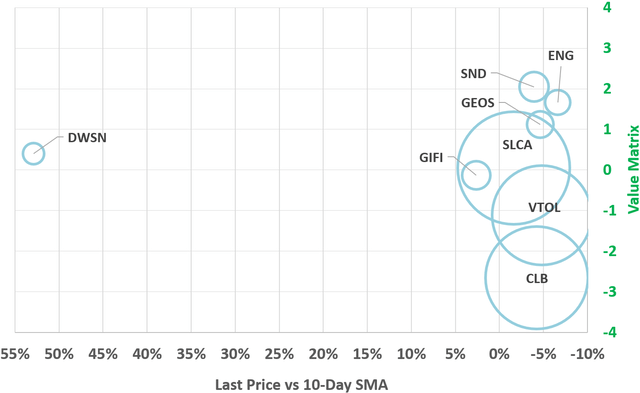
The remaining OFS providers value matrix vs 10-Day momentum is plotted with bubble size proportional to market cap. Larger cap SLCA appears to be most resistant to short term trends while smaller caps (DWSN, GIFI & ENG) have responded sharply. DWSN was up 75% over 3 days on no news and low volume. By value matrix, smaller caps (SND, ENG, & GEOS) are the score highest while CLB & VTOL score lowest amongst remaining OFS providers.
Investor Takeaways
Investors should consider the value matrix a screen only. The matrix, its factors, normalization method, and weights could all be adjusted and yield different results. Further the matrix is based on the most readily available and common metrics. Some of these metrics will change rapidly with share price while others will change as new company reports are released. It does not include some company specific data available in quarterly reports and presentations. Every investment decision regarding an individual equity should be based on comprehensive analysis of that equity.
Based on the value matrix, those investors who hold BORR, NE, SLB or any OFS with low matrix scores may wish to review their positions. OFS equities with higher matrix score may more alpha potential. These include; PFIE, ICD, RES, NR, NEX, and other OFS equities with higher matrix scores. However, the matrix and/or its factors may not forecast future price return of any of the OFS providers screened. The performance of factors considered may not be repeatable going forward; eg exceptional revenue growth may not be repeatable.
BORR was recently covered by Henrik Alex with a hold rating based on debt and dilution concerns. BORR was also recently covered by Energy Realist with a buy rating based on improving market for jack-up rigs and low valuation post sell off. PFIE was last covered over a year ago by Badsha Chowdhury with a hold rating based on diversification, a clean balance sheet, and negative free cash flow.
The value matrix is a screening tool only and some investors may find it to be a useful starting point. Undoubtedly, the value matrix could be improved to better screen OFS given current market conditions & available data. I encourage readers to download the Excel file and work it over. Or modify it completely and apply it to whole new set of fuzzy data. I hope some readers find it interesting and I look forward to comments.
Information is a source of learning. But unless it is organized, processed, and available to the right people in a format for decision making, it is a burden, not a benefit. – William Pollard
Editor’s Note: This article covers one or more microcap stocks. Please be aware of the risks associated with these stocks.


Be the first to comment