

Yevhenii Orlov/iStock via Getty Images
Introduction
The world faces a significant and scary energy shortfall after years of underinvestment, and our outlook is very constructive as a result.
– CEO of NOV, Clay C. Williams, in the company’s Q3 FY22 earnings call
According to the International Energy Agency, the world’s O&G industry needs to spend nearly 50% more annually ($466 billion) from 2022 to 2030 to meet global oil demand.
I believe O&G sub-sectors that would benefit from increased upstream capex spends are in a coiled spring position, waiting for swift realization of its potential. One of the key beneficiaries would be the oil services sector:
If this is your first time reading a Hunting Alpha article using Technical Analysis, you may want to read this post, which explains how and why I read the charts the way I do, utilizing principles of Flow, Location and Trap.
High Potential in OIH
The VanEck Vectors Oil Services ETF (NYSEARCA:OIH) invests in a basket of US listed companies that provide oil services to the upstream oil sector. This includes oil equipment, oil services, and oil drilling.
Read of Relative Money Flow
OIH vs SPX500 Technical Analysis (TradingView, Author’s Analysis)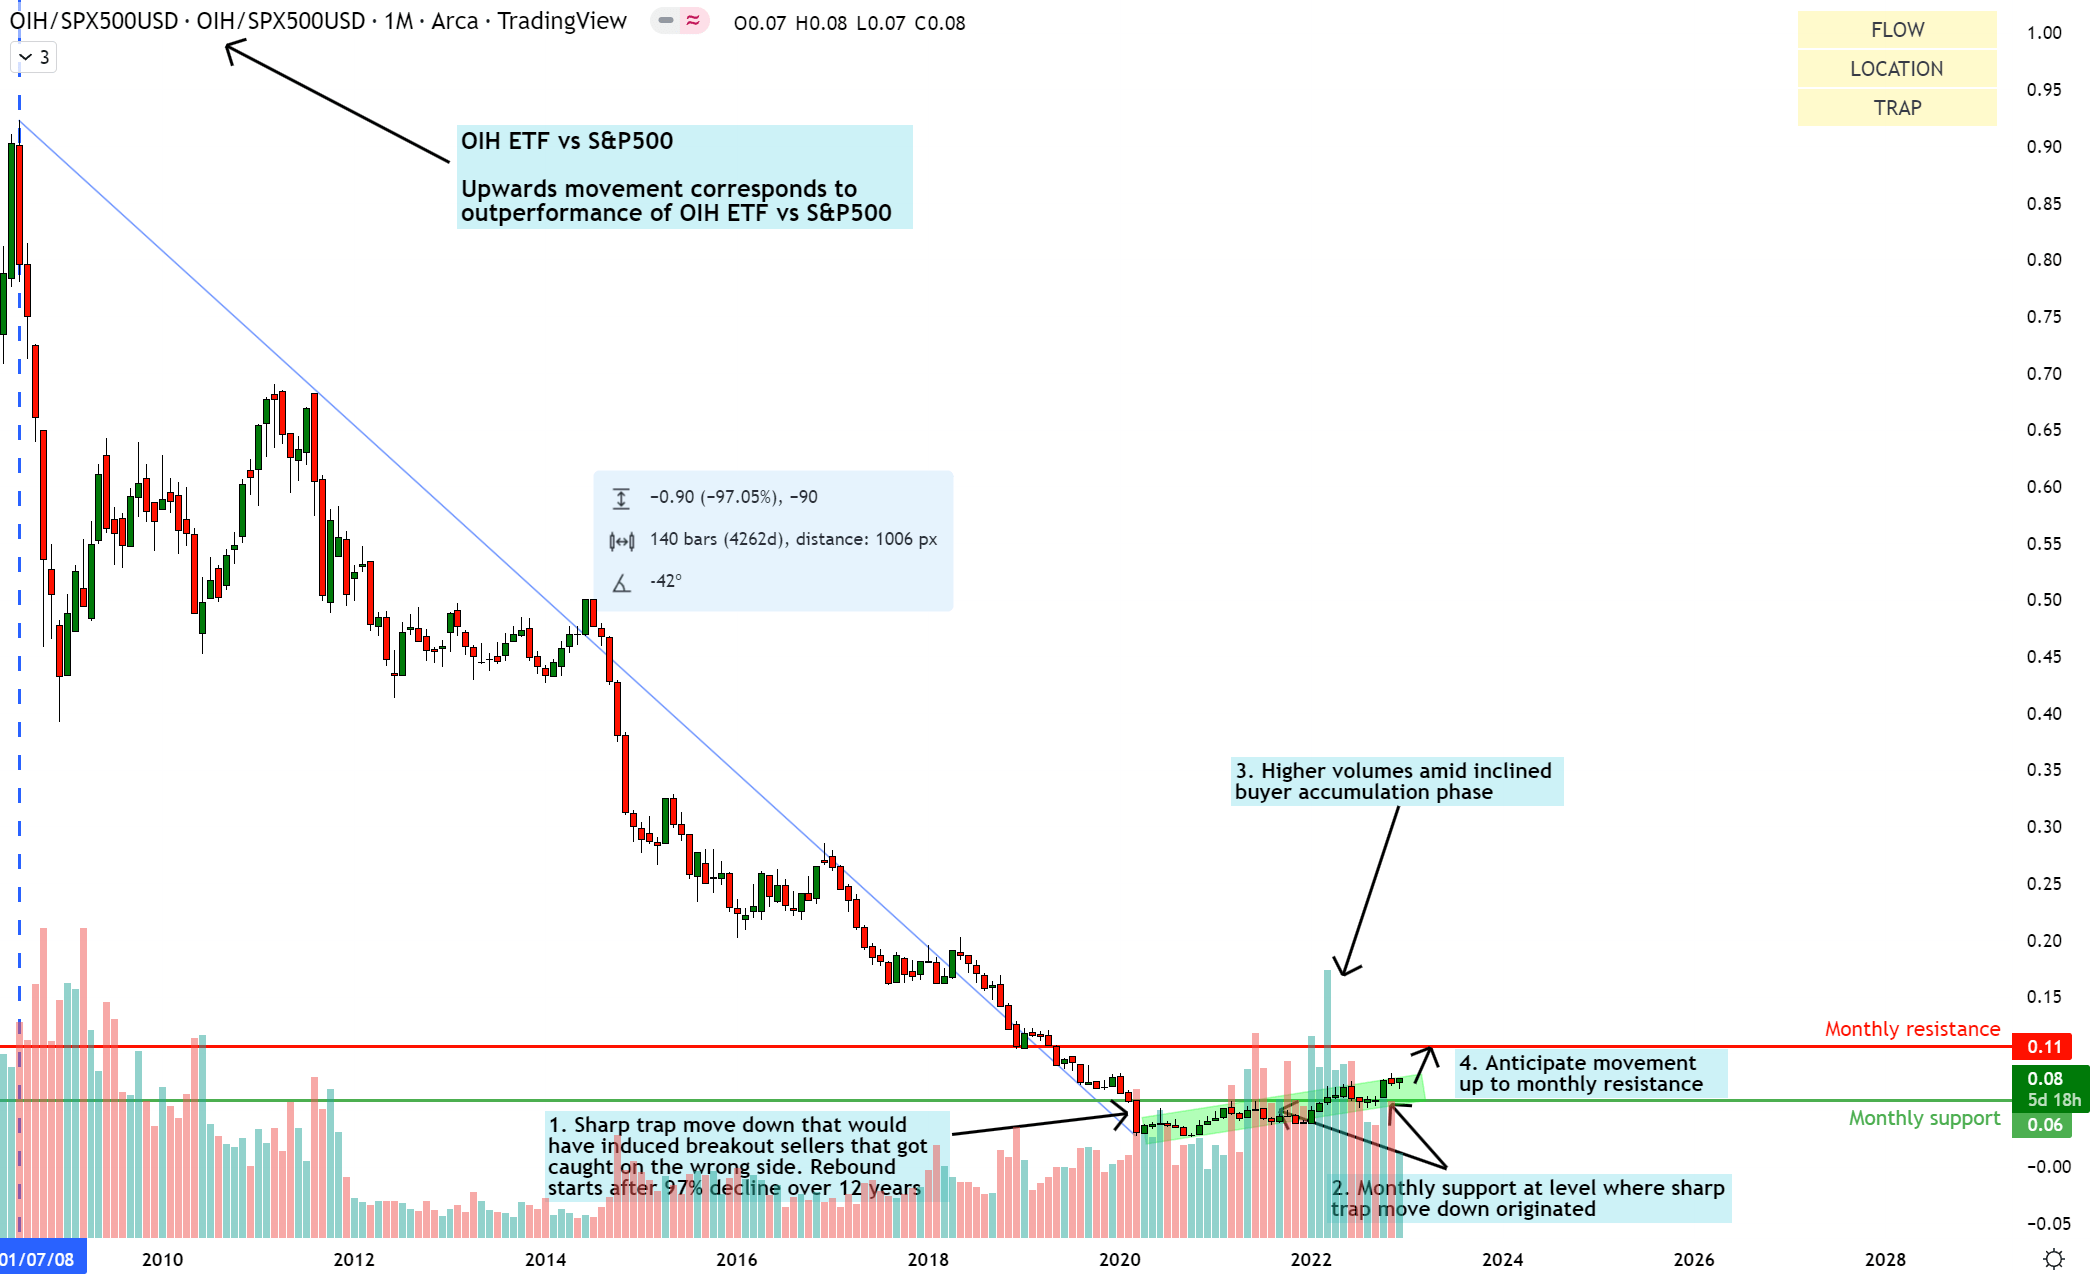
An upward movement on the relative chart of OIH/SPX500 means OIH is outperforming the S&P 500 (SPY). Conversely, a downward movement means the UAE is underperforming the S&P500.
After a 97% decline over 12 years, OIH/SPX500 has printed a sharp trap move down in March 2020. After this, this instrument has been on a steady inclined accumulation phase with higher volumes. Due to this, I believe the buyers are building up positions and after reclaiming a key level from which the trap move originated, it is about to launch up sharply towards the monthly resistance.
Read of Absolute Money Flow
OIH Technical Analysis (TradingView, Author’s Analysis)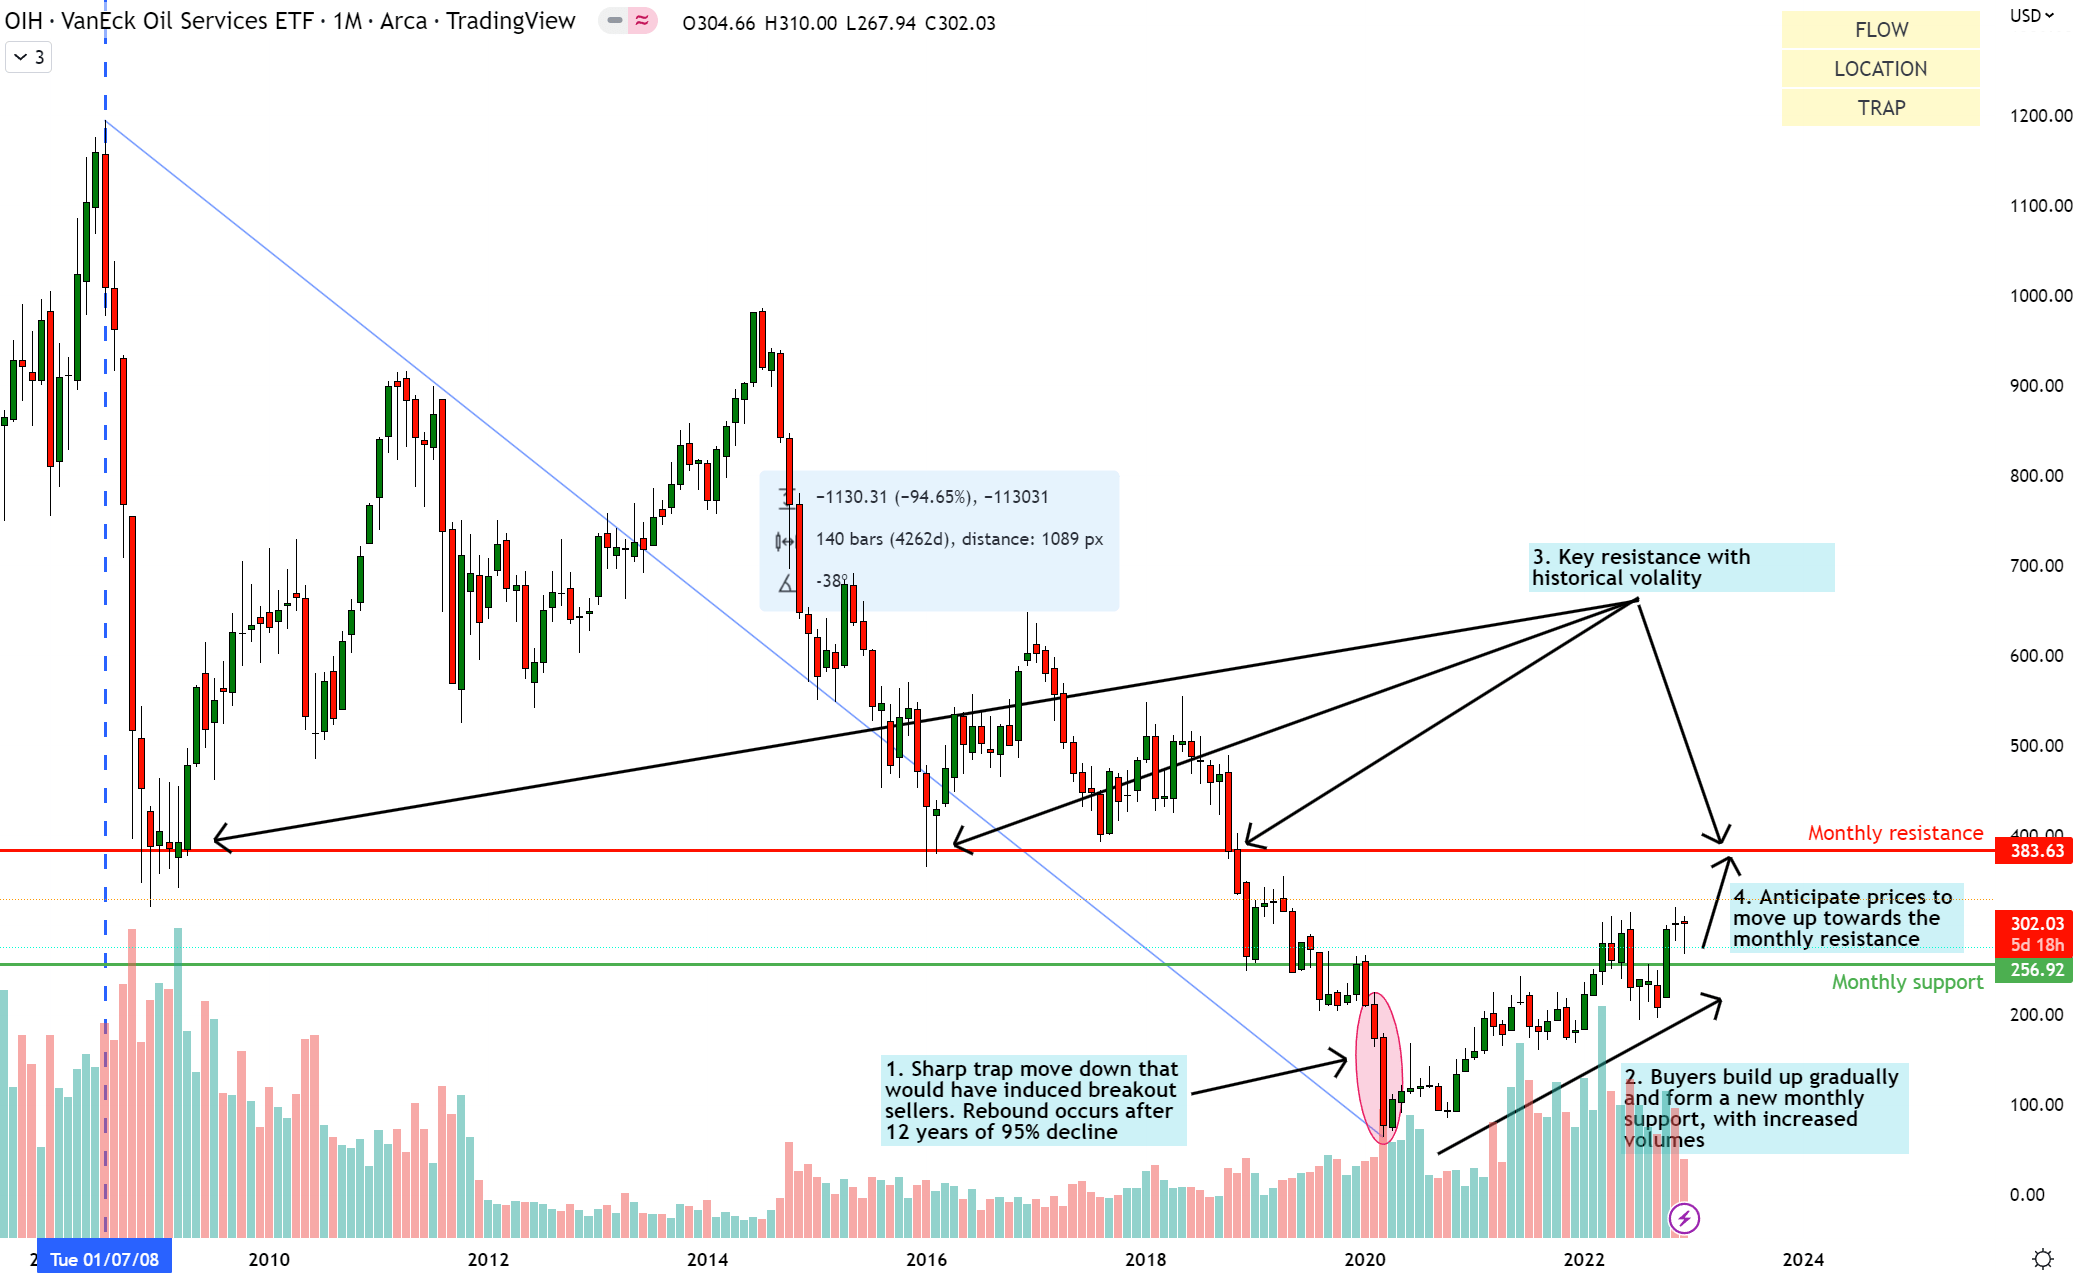
Similar to the relative chart, the absolute chart of OIH also shows a sharp trap move down in March 2020 after a 95% decline over the past 12 years. Here too, buyers have been climbing up and established $256.92 as a monthly support level, with higher volumes. I believe prices are head northwards towards monthly resistance at $383.63 over the next few months.
Thus, I am bullish on OIH, both on an absolute basis and on a relative vs S&P500 basis.
OIH ETF Composition
The OIH ETF is quite concentrated:
OIH ETF Top 5 Holdings (OIH ETF Website, Author’s Analysis)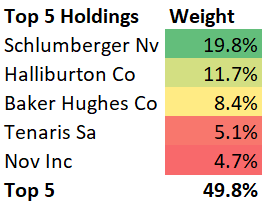
Schlumberger (SLB), Halliburton (HAL), Baker Hughes (BKR), Tenaris (TS) (OTCPK:TNRSF) and NOV (NOV) make up the top 5 holdings. Altogether, the top 5 holdings make up 49.8% of the overall index. The top 2 holdings make up 31.5% of the overall index. This is what makes the index quite top-heavy.
Key Fundamental Driver of the OIH ETF
In the current environment, volume growth is the most important driver for the US oil services industry. Fresh capex announcements in the US’ O&G upstream activities will lead to greater demand for oil equipment, oil services, and oil drilling solutions.
Therefore, I am keeping a close eye on these leading indicators such as North American rig counts, and outlook commentary by the key companies present in the OIH ETF.
I lean fundamentally bullish as there seems to be green shoots in fresh upstream capex in the private sector as evidenced by a 10-15% increase in capex budgets of private exploration and production (E&P) companies. I believe this trend will flow on to large public companies such as Exxon Mobil (XOM).
Summary
Overall, I believe the OIH ETF is a coiled spring about to release accumulated release. Leading indicators such as drill rig counts and earnings call commentaries by key upstream producer and upstream O&G service players suggest early signs of capex expansions. OIH also looks well positioned to outperform the S&P500 and generate positive returns from a technical charts perspective as well. I will look to buy on Monday 26 December.
Editor’s Note: This article discusses one or more securities that do not trade on a major U.S. exchange. Please be aware of the risks associated with these stocks.
Be the first to comment