

georgeclerk
Introduction
Nobody likes offices. Well, maybe some do, but overall, it’s not the best place to spend time. However, there’s a way to get people interested in offices. Boston Properties (NYSE:BXP) is America’s largest office real estate investment trust, holding top-tier office properties in the largest cities. The company, which owns the famous Salesforce Tower in San Francisco, currently yields 6.0%, which is one of the highest yields in its history. It’s also one of the highest yields in the REIT space. Unfortunately, that’s not because of aggressive hikes but because of an abysmal stock price performance. BXP is currently trading below its 2020 lows as it faces a mix of high national vacancy rates, a highly unfavorable macroeconomic environment, and a secular trend that doesn’t favor offices.
In this article, I will walk you through my thoughts as we assess the risk/reward of buying some high-yield office dividends.
So, bear with me!
R.I.P. Offices
The company behind the BXP ticker is the largest developer, owner, and manager of premier workplaces in the United States. The company dominates office spaces in Boston, New York, San Francisco, Seattle, Los Angeles, and other markets. Boston, New York, and San Francisco account for 80.5% of net operating income. That’s a big deal.
Boston Properties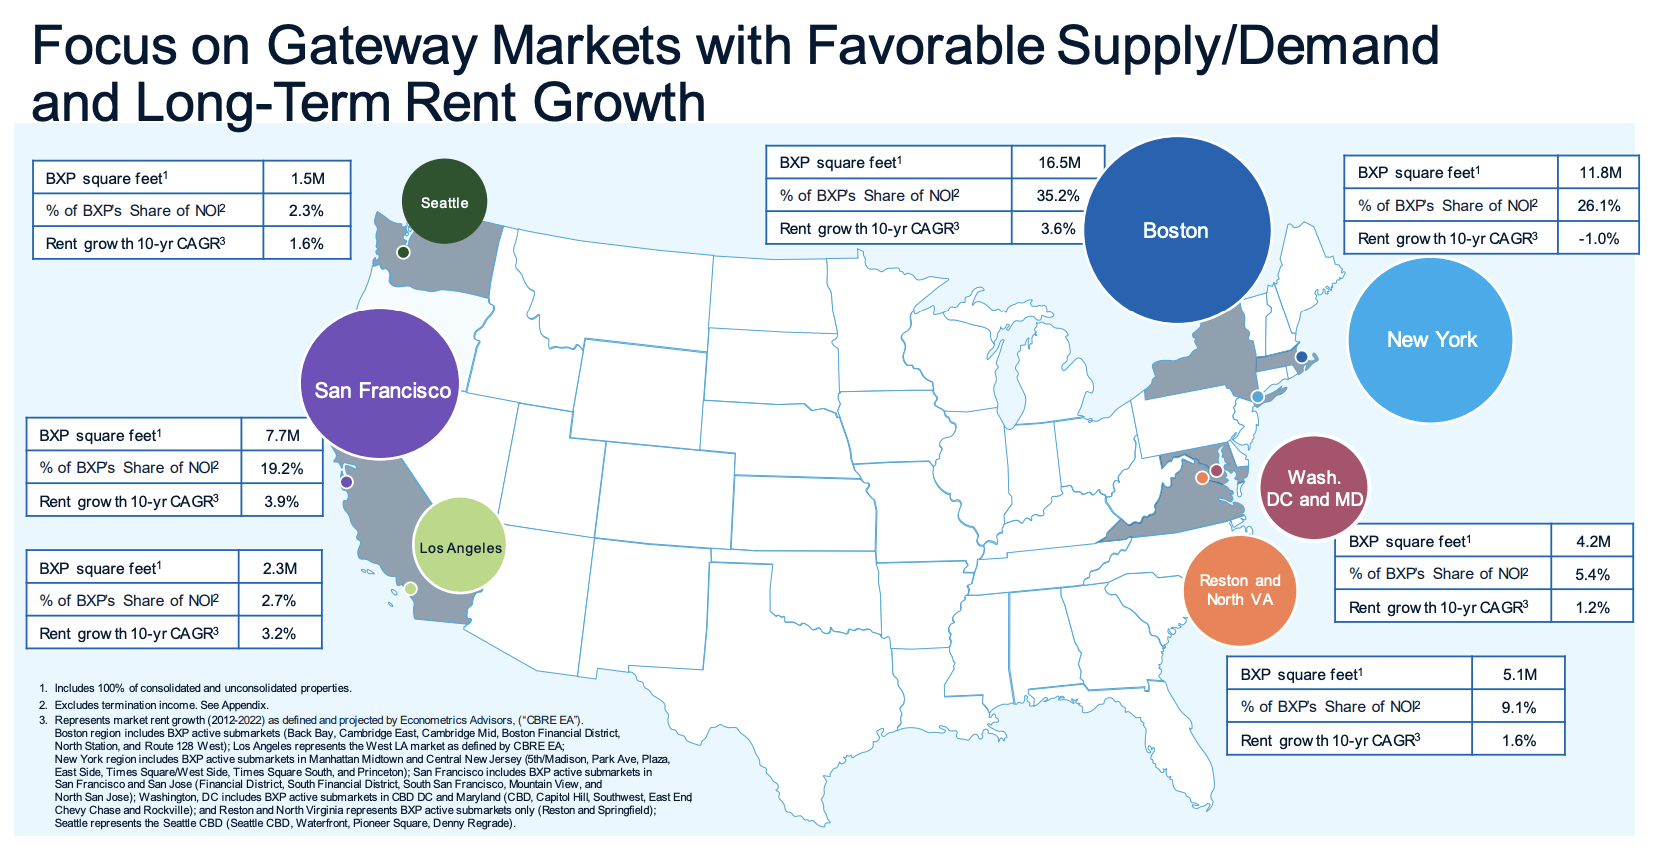
Boston alone accounts for 35.2% of net operating income. Rent growth in its biggest markets is between -1% (New York) and 3.9% (San Francisco). In this case, it’s 10-year compounding rent growth.
At this point, someone might make the case that the company dominates the markets that people want to leave. That would make sense as the US has seen a migration from blue to red states triggered by the pandemic.
Hence, we now see headlines like the one below (October 6, 2022).
Bloomberg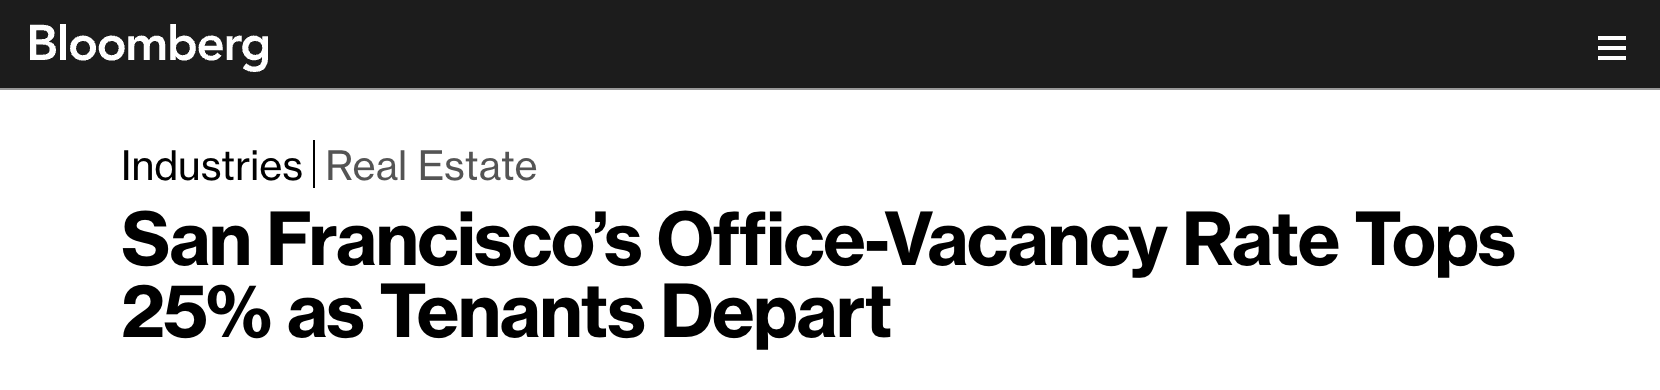
The numbers you’re about to see are wild.
San Francisco’s office vacancies have climbed to a record and are now more than six times their pre-pandemic level, highlighting the tech hub’s ongoing economic struggles.
The city’s office-vacancy rate reached 25.5% at the end of September, up from 20% a year earlier, according to real estate brokerage CBRE Group Inc. At the start of the pandemic, it was around 4%.
The vacancy rate in San Francisco has gone from 4% to more than 25%. That’s quite something, to put it mildly.
This is the result of the pandemic, employees that are slow to return to the office, and the general slow-down in a red-hot property market.
The worst part is that this problem isn’t new. It was just made worse by the pandemic.
In August, the Wall Street Journal published an article focusing on what has become a troubled office industry in the United States.
Wall Street Journal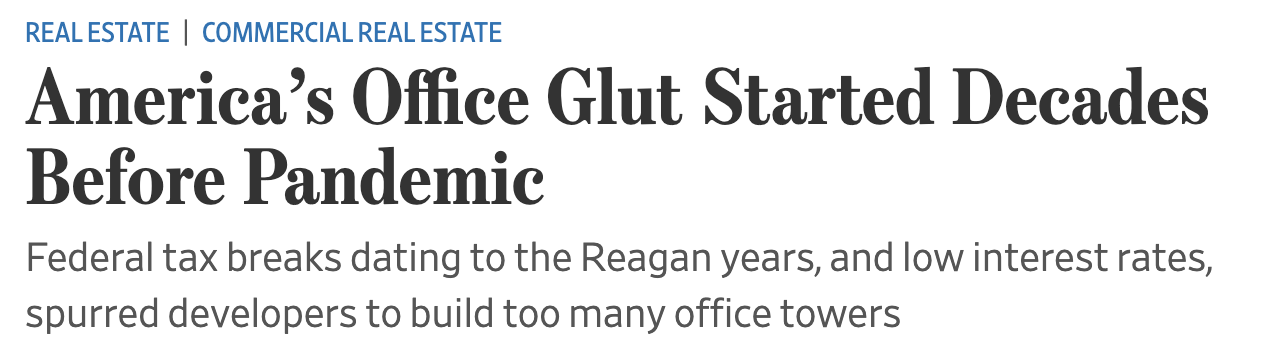
Due to Federal tax breaks, low-interest rates, inflated demand from unprofitable startups, landlords failing to tear down old buildings, and the pandemic, the US has become the center of empty offices in the world.
Even before the bad news from Wuhan, the US had a double-digit office vacancy rate.
Wall Street Journal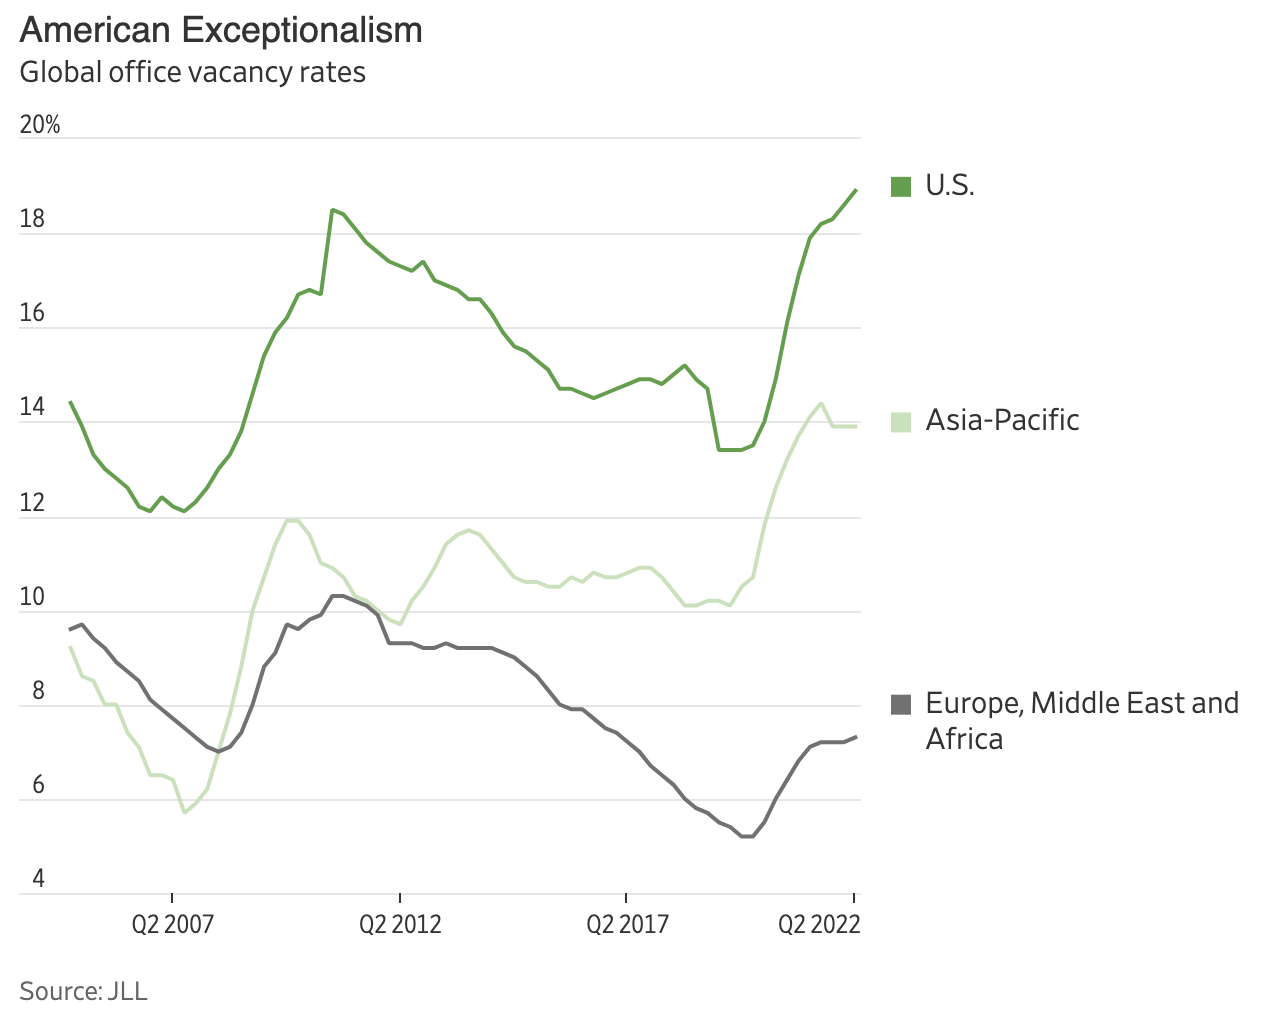
It started in 1981 when the Reagan administration allowed for faster depreciation, which lowered the tax bills of investors.
Before the pandemic, landlords already used incentives to lure in new tenants. After the pandemic, it was even harder to keep tenants as most companies incorporated (partial) remote work as a long-term option for employees.
According to the Yardi Matrix office real estate report of November 2022:
Many firms have embraced remote and hybrid work in the wake of the pandemic, which has led to a widespread reduction of office footprints. This has caused vacancy rates to rise in nearly every market since the start of the pandemic, and the trend has not slowed in 2022. Over the last 12 months, the vacancy rate has increased in 86 of the 120 markets covered by Yardi Matrix—including 22 of the top 25. Among those top 25 markets, the biggest increase in the vacancy rate since November 2021 has been in Portland (400 bps) and San Francisco (390 bps).
Boston Properties Isn’t Half Bad
With all of this in mind, Boston Properties isn’t that bad. As of September 30, 2022, it has an occupancy rate of in-service properties of 88.9%. That’s down from 89.5% in the prior-year quarter. In 2023, the company expects improved occupancy, which is another piece of good news.
Boston Properties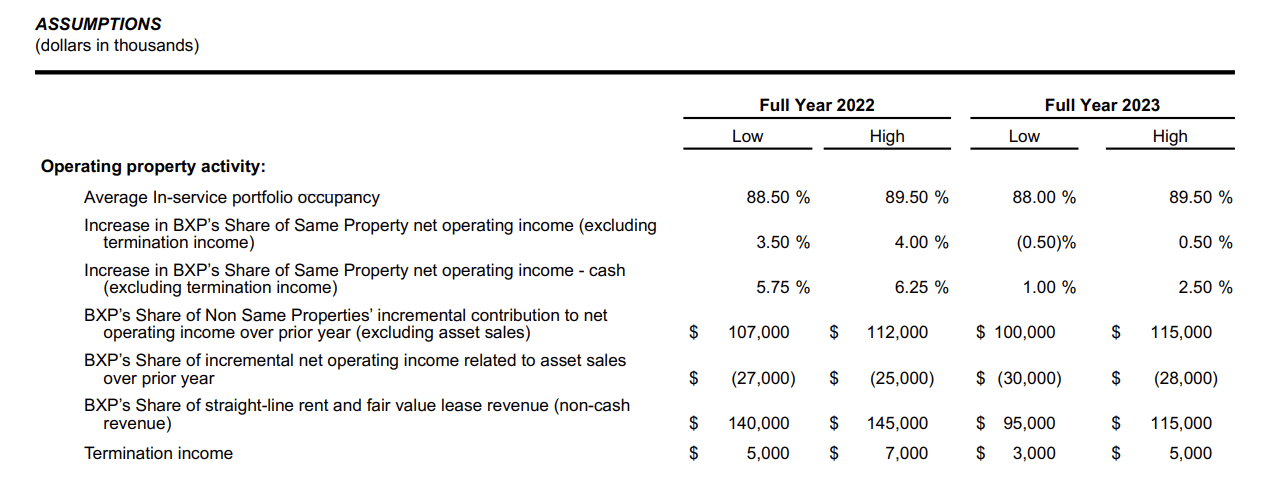
It helps that the company is very good at buying the right properties with the right tenants. For example, on May 17, 2022, the company bought Madison Centre in Seattle. The $730 million deal came with a 92.7% occupancy rate.
Moreover, three new developments are expected to be fully placed in service by the end of this year. These buildings are 325 Main Street in Cambridge, MA, 880 Winter Street in Waltham, MA, and Reston Next, in Reston, VA. Tenants include Google, BXP Life Sciences, Volkswagen, and Fannie Mae. Occupancy rates are between 87% and 97%.
The company’s top 20 clients, accounting for 30% of rental income, are (almost) all blue-chip companies that aren’t likely to move to a different city or office complex.
Boston Properties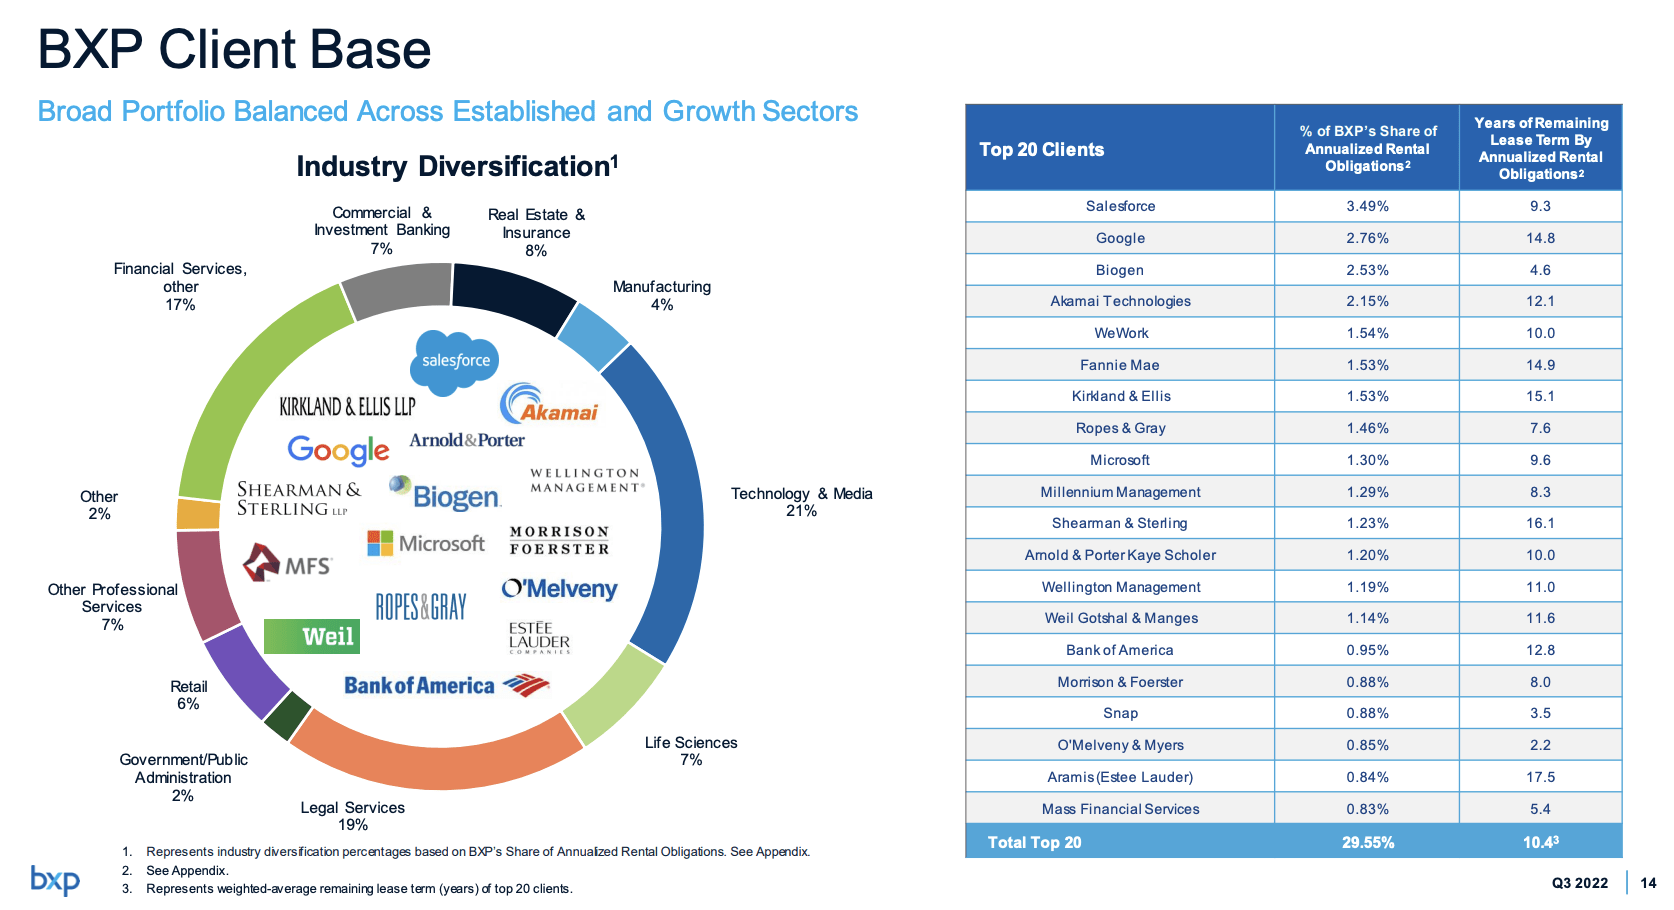
Thanks to great locations and top-tier customers, the company has achieved 3.5% annual compounding funds from operations growth since 2014. Even the pandemic dip is expected to be a thing of the past at the end of this business year.
Boston Properties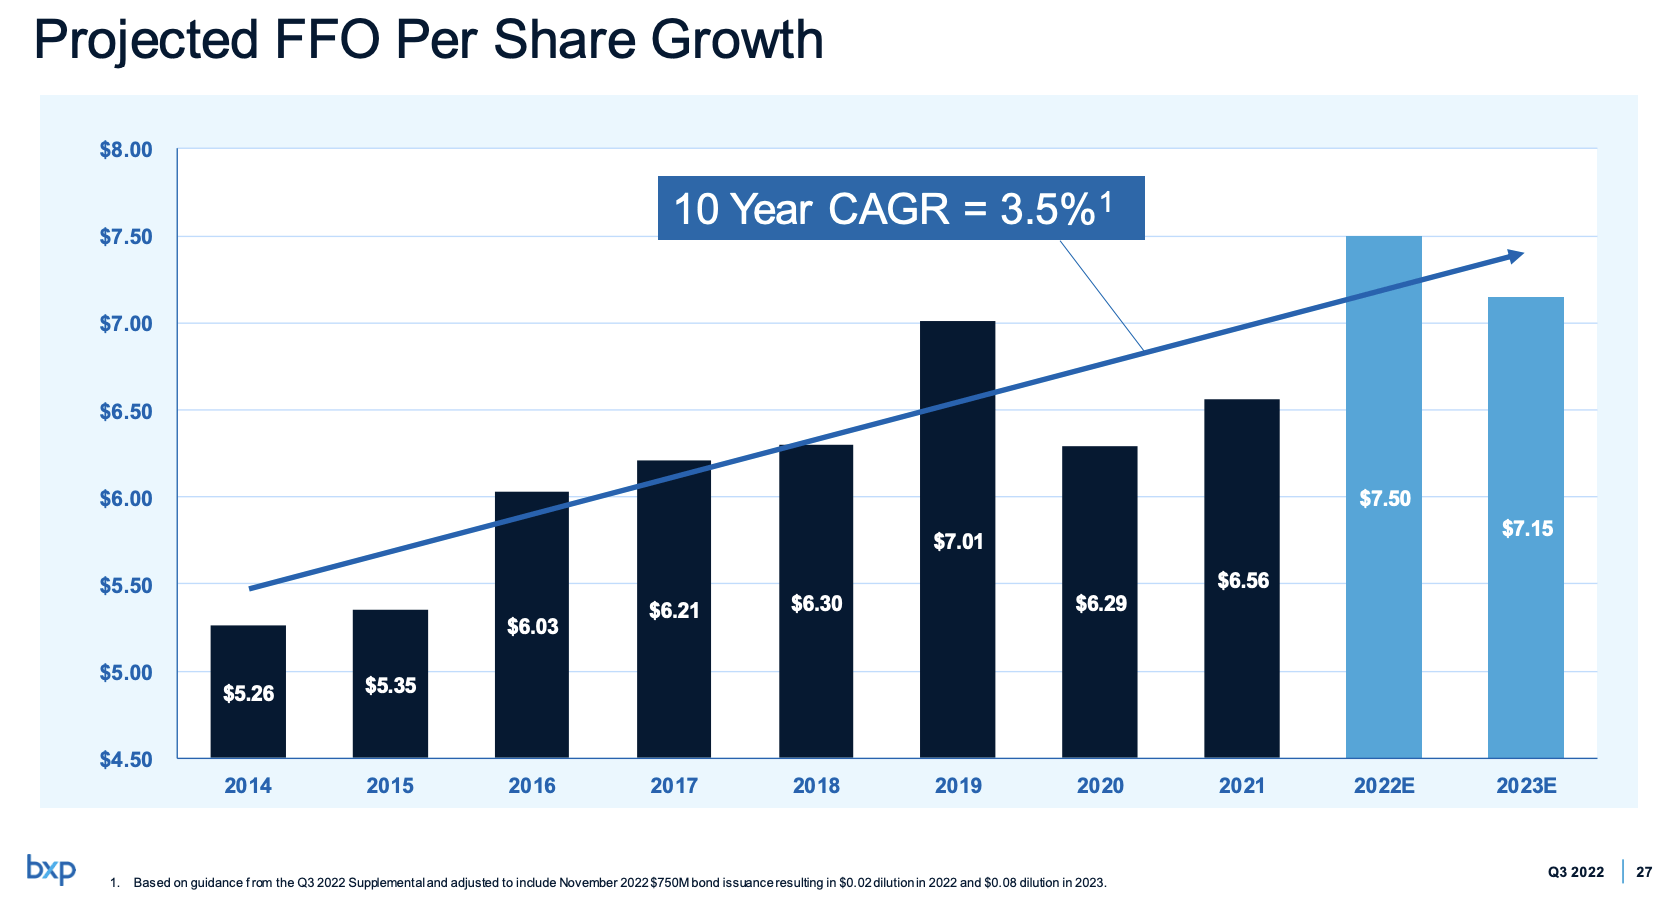
This year, the company expects to generate at least $7.51 in FFO, which is higher than previously expected.
Boston Properties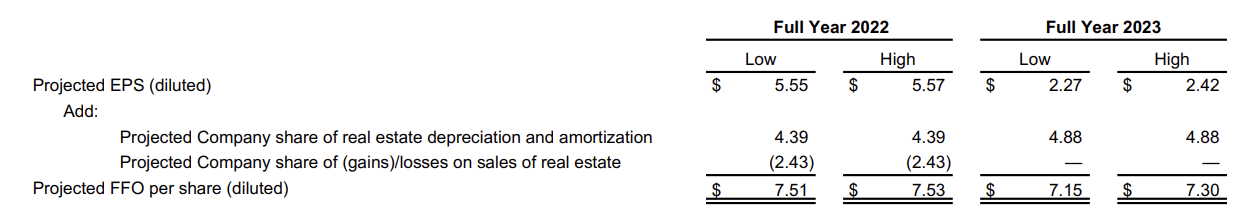
According to the company:
Our FFO per share this quarter was well above both market consensus and the midpoint of our guidance, and we once again increased our forecast for the full year 2022.
[…] The new midpoint of our 2022 guidance represents strong growth in FFO of $0.96 per share or 15% over 2021. At the midpoint of our guidance, our growth is comprised of 3.75% year-over-year improvement in our same-property NOI and that adds $0.35 per share, $0.63 per share of external NOI growth from acquisitions and developments coming online, and $0.16 per share of lower interest expense from locking in low rates in our financing activities last year.
On a long-term basis, the company expects to accelerate annual NOI growth from the low 3% range before 2020 to 3.9% between now and 2026. New developments are expected to be a big driver of future growth.
The company is now trading at 8.9x 2023E FFO of $7.30. That is very cheap. If the company can achieve these targets, it makes BXP seriously undervalued.
It also helps that the company has a fantastic balance sheet.
As of 3Q22, the company has $13.9 billion in gross debt. That’s 7.5x EBITDA(re). That number is up from 6.6x before the pandemic, but roughly unchanged compared to 2020.
Boston Properties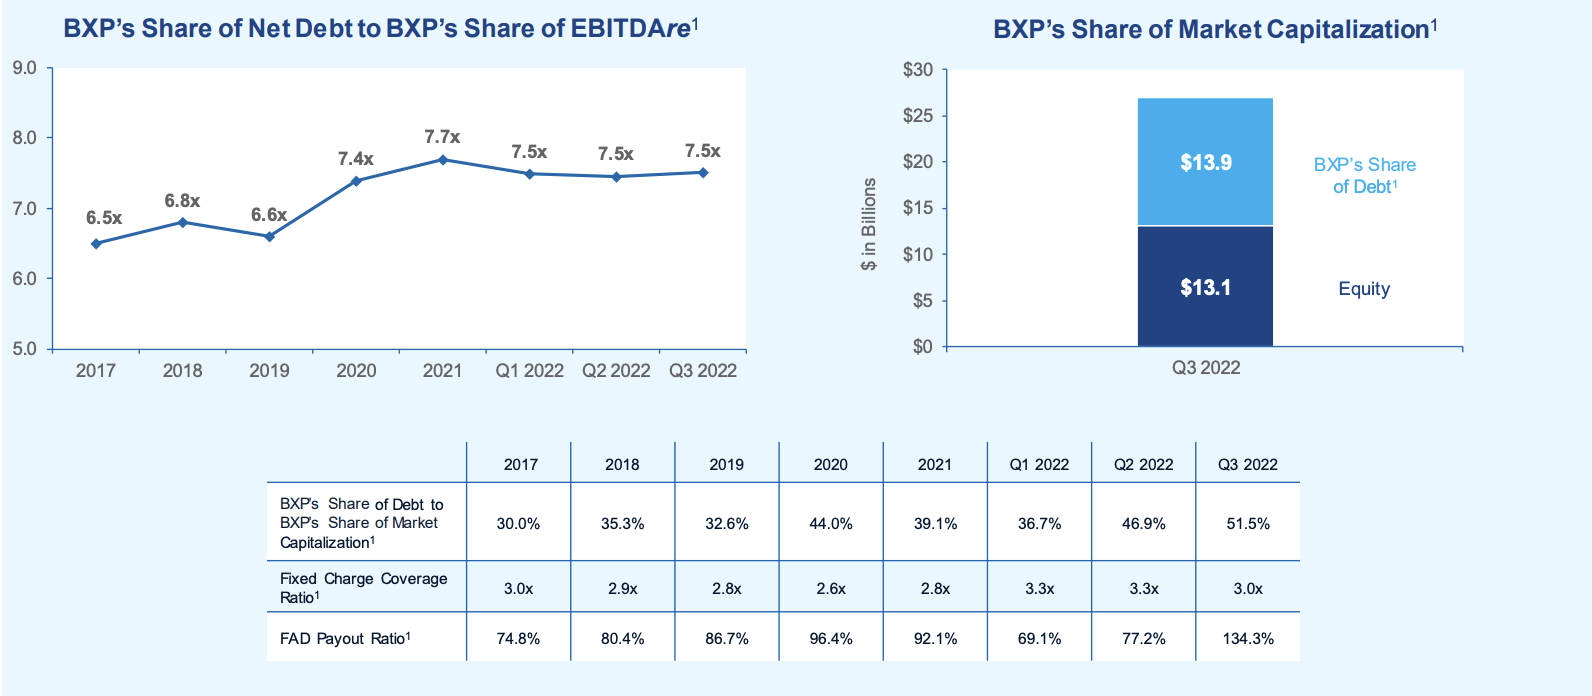
The only thing that looks a bit off in the screenshot above is the payout ratio. However, there’s an explanation for that.
[…] if you look at our FAD, in particular, include the Shearman’s transaction at 599 Lex. They converted a bunch of their free rent to TI and the entire cost for that 20-year, 350,000-square-foot lease is in the FAD this quarter, which is why the FAD looks so unusual.
Moreover, 77% of BXP debt is unsecured debt. The average maturity is 5.4 years. The average debt rate is 3.3%, which is a great deal, and one of the lowest I’ve encountered among REITs this year.
So, what about the dividend?
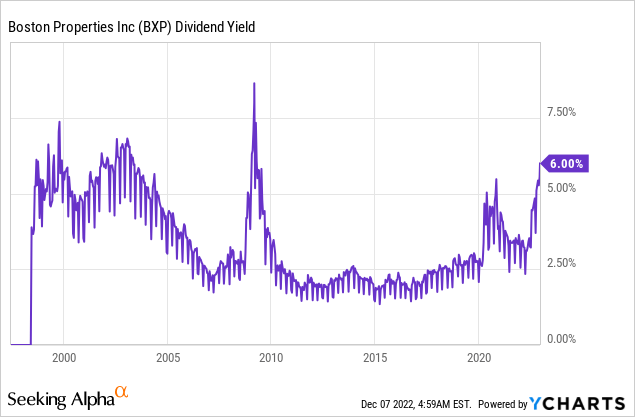
BXP investors currently receive a $0.98 per share per quarter dividend. That’s $3.92 per year. It translates to a 6.0% dividend yield. That’s not bad!
It’s one of the highest yields in the company’s history. Before the pandemic, investors were dealing with a sub-3% yield most of the time.
Unfortunately, the surge in the yield is due to the poor performance of the BXP stock. BXP is down 43% year-to-date. It’s 50% below its 52-week high. The stock is now trading below the 2020 pandemic lows.
FINVIZ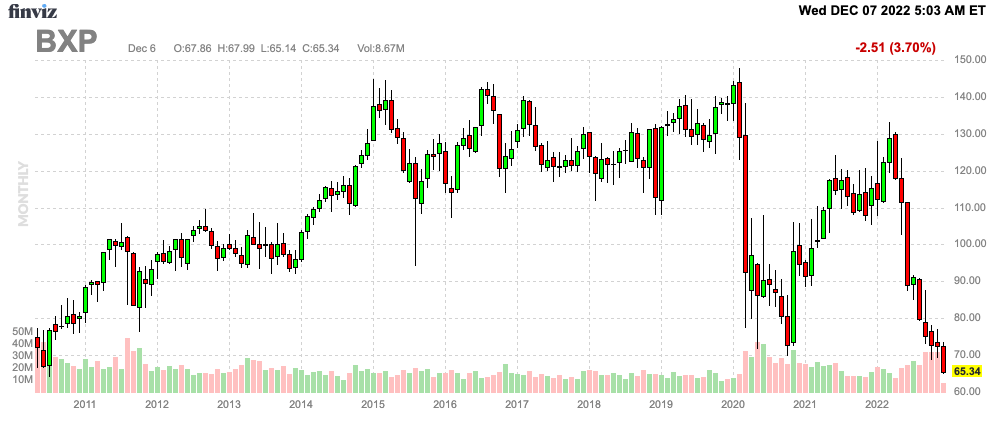
This performance is due to tough macroeconomic conditions. Rates are high, the Fed isn’t expected to pivot anytime soon, and overall asset prices are starting to come down. Add to this the aforementioned (deep-rooted) office vacancy issues, and we get a pretty bad environment for BXP.
Moreover, dividend growth is bad in general. Over the past ten years, the average annual dividend hike was 6.0%. That could be worse. Over the past three years, that number has fallen to 1.0%.
The most recent hike was announced on December 17, 2019. Back then, BXP hiked by 3.2%.
Is BXP A Sell, Hold, or Buy?
If I were a BXP investor, I would hold. BXP is too cheap to sell. While headwinds are serious and persistent, BXP is managing top-tier properties and trading at a very low FFO multiple. Moreover, I do not expect dividend cuts.
Unfortunately, I also do not expect BXP to be able to turn into an attractive long-term REIT. A REIT with steady long-term dividend growth, attractive assets, and secular growth.
Hence, even at a 6.0% yield, I do not recommend BXP shares to long-term dividend investors. I simply do not believe the risk/reward is good. Again, that’s not based on its valuation alone (which is quite low), but on my expectations when it comes to long-term value generation.
If you want to bet on a rebound in REITs, BXP may be your pick. However, if you look for long-term REIT income and capital appreciation, I wouldn’t buy this one.
(Dis)agree? Let me know in the comments!
Be the first to comment