

New Zealand Dollar Talking Points
NZD/USD takes out the September high (0.7170) as it extends the advance following the kneejerk reaction to the US consumer Price Index (CPI), and recent developments in the Relative Strength Index (RSI) indicate a further appreciation in the exchange rate as the oscillator pushes into overbought territory for the first time since February.
NZD/USD Rate Clears September High to Trigger Overbought RSI Reading
NZD/USD climbs to a fresh monthly high (0.7207) during the Federal Reserve’s blackout period as it stages a six-day rally, and the exchange rate may continue to appreciate over the coming days as it extends the series of higher highs and lows from the previous week.
As a result, NZD/USD appears to track to test the June high (0.7288) as the overbought reading in the RSI signals a pick up in the bullish momentum, and the New Zealand Dollar may continue outperform its US counterpart ahead of the next Federal Open Market Committee (FOMC) interest rate decision on November 3 as mixed data prints coming out of the US economy raises the scope of seeing the central bank carry out a gradual approach in normalizing monetary policy.
At the same time, it seems as though the recent developments may do little to detail the Fed from scaling back monetary support as Richmond Fed President Thomas Barkin, who votes on the FOMC this year, insists that the committee will “have a discussion in November on tapering,” and the recent rally in NZD/USD may turn out to be a correction in the broader trend as the exchange rate trades to fresh yearly lows in the second half of 2021.
However, the break above the September high (0.7170) suggests the path of least resistance for NZD/USD remains tilted to the topside amid the broad based weakness in the Greenback, but a further appreciation in the exchange rate is likely to fuel the recent flip in retail sentiment like the behavior seen during the previous month.
The IG Client Sentiment report shows only 39.77% of traders are currently net-long NZD/USD, with the ratio of traders short to long standing at 1.51 to 1.
The number of traders net-long is 0.84% higher than yesterday and 18.71% lower from last week, while the number of traders net-short is 5.85% higher than yesterday and 17.92% higher from last week. The decline in net-long position could be a function of profit taking behavior as NZD/USD trades to fresh monthly high (0.7207), while the rise in net-short interest has fueled the flip in retail sentiment as 50.64% of traders were net-long the pair last week.
With that said, NZD/USD looks poised for a larger recovery ahead of the next Fed rate decision as it extends the series of higher highs and lows from the previous week, and the exchange rate appears to be on track to test the June high (0.7288) as the Relative Strength Index (RSI) pushes into overbought territory for the first time since February.
NZD/USD Rate Daily Chart
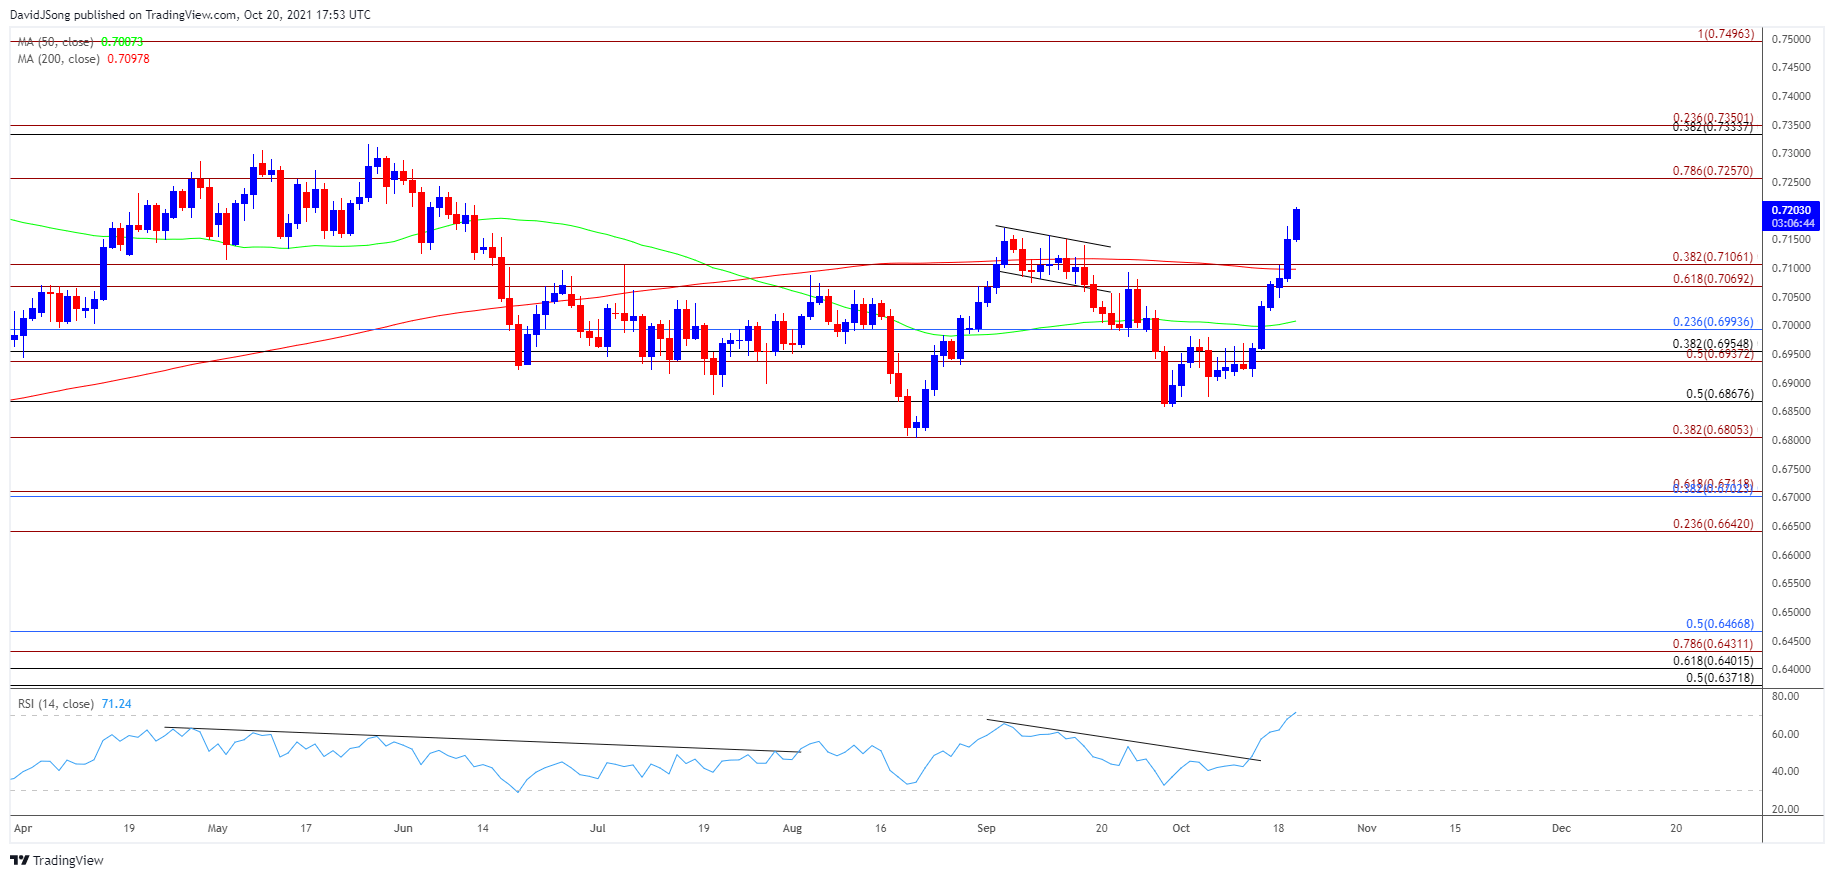
Source: Trading View
- Keep in mind, a head-and-shoulders formation materialized in the first quarter of 2021 as NZD/USD slipped below the 50-Day SMA (0.7007) for the first time since November, with the exchange rate pushing below the 200-Day SMA (0.7098) for the first time since June 2020 to trade to a fresh yearly low (0.6805) in August.
- However, NZD/USD reversed course ahead of the November 2020 low (0.6589) amid the failed attempt to close below the 0.6810 (38.2% expansion) region, and the exchange rate appears to be on track to test the June high (0.7288) following the break above the September high (0.7170).
- The Relative Strength Index (RSI) highlights a similar dynamic as the oscillator pushes into overbought territory for the first time since February, and the indicator may signals a further pick up in the bullish momentum as long as it holds above 70.
- A break/close above the 0.7260 (78.6% expansion) area raises the scope for a run at the June high (0.7288), with a break above the May high (0.7317) opening up the 0.7330 (38.2% retracement) to 0.7350 (23.6% expansion) region.
- However, failure to test the June high (0.7288) may push NZD/USD back towards the Fibonacci overlap around 0.7070 (61.8% expansion) to 0.7110 (38.2% expansion), with the next area 0.6990 (23.6% retracement).
— Written by David Song, Currency Strategist
Follow me on Twitter at @DavidJSong
Be the first to comment