

Justin Sullivan/Getty Images News
In this analysis of NVIDIA Corporation (NASDAQ:NVDA), we examined the company following the recent report of the U.S. government restricting U.S. companies including Nvidia relating to data center product sales to China. Based on a filing by Nvidia, the company stated that the new restrictions on sales to China and Russia put in place by the U.S. government were to prevent its products to be used for a “military end use.” According to Nvidia, its data center products such as its A100 GPU:
delivers unprecedented acceleration at every scale to power the world’s highest-performing elastic data centers for AI, data analytics, and HPC.
To determine the impact on Nvidia’s revenue, we firstly analyzed the revenue breakdown of the company based on its annual report by geographic revenues. Moreover, we examined the classification of Nvidia’s geographic revenue breakdown. Furthermore, to determine the potential revenue impact on Nvidia, we analyzed the cloud market share and compared it with the company’s revenue breakdown by geographic location. Lastly, we examined the potential China competitors which could benefit from the ban and analyzed their products against Nvidia and Advanced Micro Devices, Inc. (AMD).
Nvidia and AMD Geographic Revenue Exposure to China
According to Nvidia, the U.S. government imposed a new license requirement for “any future export to China and Russia” of the company’s data center segment products including its A100 and H100 GPUs as well as DGX or any system which incorporates its GPUs. Nvidia stated that the new license requirement imposed by the U.S. government is to prevent its products from being used in the military. Additionally, according to WCCFTech:
AMD has also received new license requirements that will stop it from selling MI250 GPUs but the company can still continue shipments of its older MI100 GPUs.
Based on Nvidia and AMD’s annual reports, we examined their geographic revenue breakdown in the table below to determine their revenue exposure to China.
|
Nvidia Revenue Breakdown |
$ mln |
% |
AMD Revenue Breakdown |
$ mln |
% |
|
United States |
4,349 |
16.2% |
United States |
4,656 |
28.3% |
|
China (including Hong Kong) |
7,111 |
26.4% |
China (including Hong Kong) |
4,096 |
24.9% |
|
Others |
15,454 |
57.4% |
Others |
7,682 |
46.7% |
|
Total |
26,914 |
100.0% |
16,434 |
100.0% |
Source: Nvidia, AMD, Khaveen Investments
As seen in the table above, Nvidia derived 26.4% of revenue in FY2022 compared to 16.2% in the US. Moreover, AMD derived nearly a quarter or 24.9% of its revenue from China. However, according to Nvidia, the company highlighted a potential revenue impact of $400 mln in sales which is 6% of the company’s Q2 FY2023 revenue of $6.7 bln. Moreover, AMD stated that it did not expect “a material impact on its business” with the new restrictions, according to Reuters. Thus, the guided revenue impact from the new restriction is significantly lower than the company’s revenue exposure based on its reported revenue breakdown.
Nvidia stated in its annual report that its revenue breakdown by geographic region is recorded based on where its customers are billed but its customers could be based in another location:
Revenue by geographic region is allocated to individual countries based on the location to which the products are initially billed even if our customers’ revenue is attributable to end customers that are located in a different location. – Nvidia Annual Report
Similarly in AMD’s annual report, the company stated that it recorded its sales based on the billing location of its customers:
Sales to external customers by geographic regions based on billing location of the customer – AMD Annual Report
Therefore, we believe the company’s revenue breakdown by geographic region is not representative of its revenue exposure to the new restriction as it is not recorded based on the company’s customers’ headquartered locations. According to International Business Strategies, companies in China impacted by the new restrictions include cloud service providers such as Alibaba (BABA, BABAF), Baidu (BIDU) and Tencent (OTCPK:TCEHY, OTCPK:TCTZF) and server makers such as Lenovo (OTCPK:LNVGF, OTCPK:LNVGY) and H3 (OTC:HTRE). That said, Nvidia stated that the new restriction covers
any future export to China and Russia.
More Reflective Revenue Impact on Nvidia and AMD
As discussed in the first point, the revenue breakdown by Nvidia and AMD shows its China revenues are higher than the company’s expected revenue impact. To estimate Nvidia and AMD’s revenue exposure with the new restriction on the company, we analyzed the cloud infrastructure market share which includes Chinese cloud companies.
Company Data, Canalys, Synergy Research, Khaveen Investments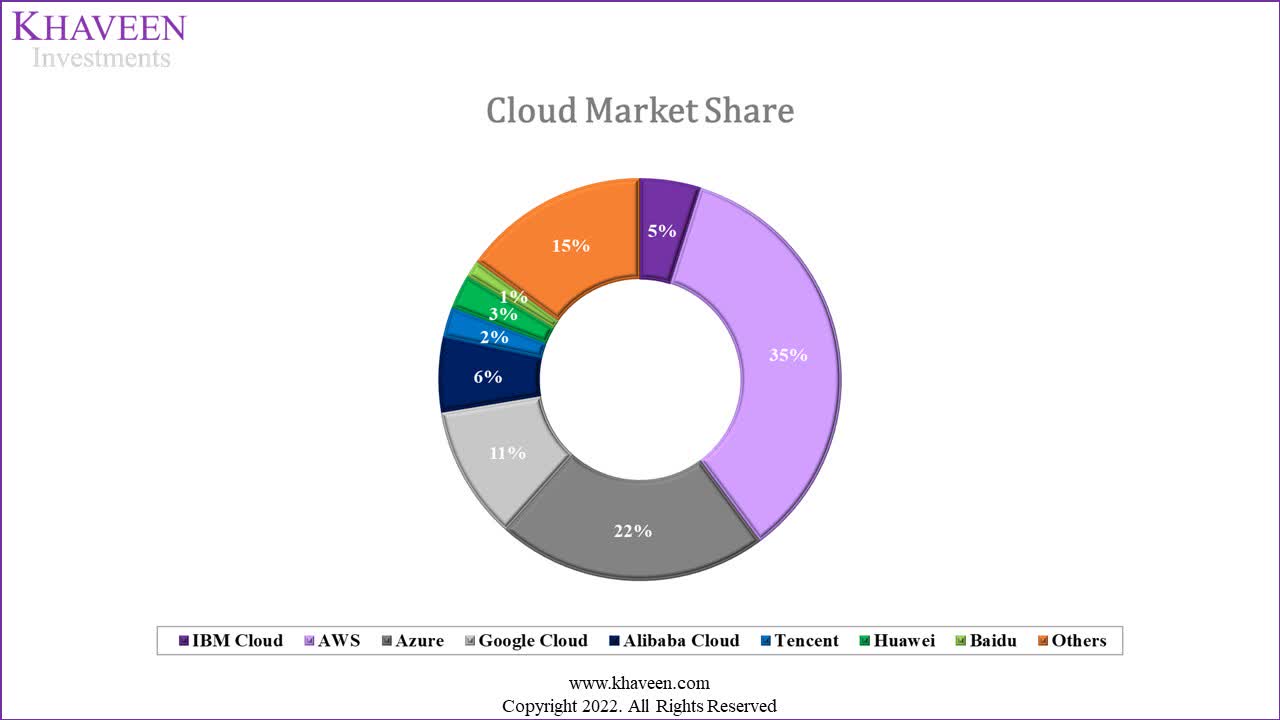
Based on the chart above, the cloud market is dominated by U.S. firms such as Amazon.com (AMZN), Microsoft (MSFT) and Google (GOOG, GOOGL), which accounted for 68% of the market share. Market leader Amazon has the highest share (35%) followed by Microsoft at a 22% and Google at 11% market share. On the other hand, China companies such as Alibaba, Tencent, Huawei and Baidu accounted for 13% of the cloud market share combined with Alibaba as the largest Chinese company but with only a 6% share in comparison to Amazon’s 35% share. This is unsurprising as according to Cloudscene, the U.S. has the highest number of data centers in the world at 2,751 in 2022 followed by Germany (484), UK (458). China is in fourth place with 447 data centers.
According to Nvidia’s website, its cloud computing customers include Alibaba, Amazon, Baidu, Google, IBM (IBM), Microsoft, Oracle (ORCL) and Tencent. Additionally, Huawei is also a customer of Nvidia using its GPUs for its cloud platform.
We estimated the revenue impact to Nvidia and AMD based on the share of China companies’ cloud market share as our assumption as its data center segment exposure to Chinese customers and multiplied it with the revenue breakdown of the company’s data center segment of its latest quarter.
|
China Companies Share of Cloud Market |
13% |
|
Nvidia Data Center Segment ($ mln) (H1 2023) |
7,556 |
|
Nvidia Data Center Segment |
50.40% |
|
Nvidia Data Center Revenue Impact % |
6.4% |
|
AMD Data Center Segment ($ mln) (H1 2022) |
2,779 |
|
AMD Data Center Segment |
22.3% |
|
AMD Data Center Revenue Impact % |
2.8% |
*c = a x b
Source: Company Data, Khaveen Investments
Based on the table above, Nvidia’s data center segment accounted for 50.4% of revenues in H1 FY2023 which is higher compared to AMD at 22.3%. We estimated the revenue impact to Nvidia at 6.4% based on the China companies’ cloud market share of 13% which is close to the company’s provided revenue impact estimates of $400 mln or 6% of its total revenues. Whereas for AMD, we estimated a lower revenue impact of 2.8% as AMD’s exposure to data centers is lower compared to Nvidia which derived over half of its revenues from data centers.
Overall, we believe that Nvidia and AMD’s exposure to the new restrictions is better reflected by the share of China companies’ market share rather than the revenue breakdown by geographic location from their annual reports. Based on our estimates of the company’s revenue impact based on the China cloud companies market share of 13% and Nvidia’s and AMD’s data center segments, we estimated a revenue impact of 6.4% for Nvidia, which is close to management’s guidance of a 6% revenue impact, and 2.8% of AMD’s total revenues.
|
Nvidia Data Center Segment ($ mln) |
2021 |
2022F |
2023F |
2024F |
2025F |
|
Data Center Segment (Before Ban) |
10,613 |
13,632 |
18,051 |
24,606 |
33,858 |
|
Growth % |
28.4% |
32.4% |
36.3% |
37.6% |
|
|
Data Center Segment (After Ban) |
10,613 |
12,708 |
15,695 |
21,547 |
29,849 |
|
Growth % |
19.7% |
23.5% |
37.3% |
38.5% |
|
|
Revenue Impact |
924 |
2,356 |
3,059 |
4,010 |
Source: Nvidia, Khaveen Investments
Whereas for its Data Center segment, we maintained our revenue projections from our previous analysis. Though, we accounted for the restrictions on its sales to China with our estimated revenue impact of $924 mln in 2022 based on our calculated revenue impact of 6.4% prorated by half a year as the restrictions were guided to have an impact starting from Q3 FY2023 by Nvidia. This reduces its Data Center growth from 28.4% to 19.7% in 2022. For the following year in 2023, we accounted for a full revenue impact of 6.4% on our projection of Nvidia which reduces our forecast of its data center segment growth from 32.4% to 23.5% in 2023. Overall, we factored in our estimates of the revenue impact from the new restrictions on its data center segment which resulted in a lower 4-year forward average of 29.8% through 2025 compared to 33.7% previously.
Nvidia and AMD Dominance Supported by Tech Advantage
According to Nvidia, the U.S. government had authorized Nvidia to continue the development of its next-gen H100 product and allow the company
to perform exports needed to support US customers of its A100 through March 2023.
However, Nvidia stated that the company was working with customers in China
to satisfy their planned or future purchases of products not subject to the new restrictions
and also stated that it would seek a license for to export to the customer but provided no assurance that the government would grant the company any exemptions or license.
Both Nvidia and AMD dominate the data center GPU accelerator market with an estimated 95% share for Nvidia and the remaining held by AMD according to Fubon Securities Investment Services. In recent years, Chinese startup companies such as Biren technology and Shanghai Tianshu Zhixin had been developing data center GPUs to compete with Nvidia and AMD. We compared their announced GPUs such as the BR100 for Biren and Big Island for Shanghai Tianshu Zhixin with Nvidia and AMD previous and latest product generation to analyze their performance.
|
Company |
Biren (BR100) |
Shanghai Tianshu Zhixin (Big Island) |
Nvidia (A100) |
Nvidia (H100) |
AMD (M100) |
AMD (M250) |
|
Interface |
PCIe Gen 5 |
PCIe Gen 4 |
PCIe Gen4 |
PCIe Gen 5 |
PCIe 4 |
PCIe 4 |
|
Memory Bandwidth |
3TB/s |
1.2TB/s |
1,935 GB/s |
2.3TB/s |
1228.8 GB/s |
Up to 3276.8 GB/s |
|
Process |
TSMC 7nm |
TSMC 7nm |
TSMC 7nm |
TSMC 4nm |
TSMC 7nm |
TSMC 6nm FinFET |
|
RAM Memory (‘GB’) |
64 |
32 |
40 |
80 |
32 |
128 |
|
Power (‘W’) |
550 |
300 |
300 |
700 |
300 |
500 |
|
FP16 performance (TFLOPs) |
1000 |
147 |
312/624 |
1000/2000 |
184.6 |
362.1 |
Source: Nvidia, AMD, Biren, WCCFTech, TechPowerUp, Tom’s Hardware, Lambda, Khaveen Investments
Based on the table above, Biren claims that its BR100 product is based on the latest PCIe Gen 5.0 interface similar to Nvidia’s new H100 with a higher memory bandwidth of 3TB/s but still lower than AMD’s M250. Though, Shanghai Tianshu Zhixin’s Big Island’s interface is only Gen 4 and has the lowest memory bandwidth among the competitors. Both Biren and Shanghai Tianshu Zhixin’s products are based on a 7nm process which is on par with Nvidia’s A100 and AMD’s M250 products but are behind Nvidia’s H100 based on TSMC’s 4nm and AMD’s M250 which is based on TSMC’s 6nm. In terms of memory, the BR100 is superior to Nvidia’s A100 with 64GB of memory compared to 40Gb for the A100 but is still behind the H100 and M250. The Big Island has a lower memory capacity at 32GB which is tied with AMD’s M100. In terms of power consumption, the H100 has the highest TDP at 700W followed by Biren while the Big Island is on par with the A100 and M100.
Finally, in terms of FP16 performance, Nvidia’ H100 is claimed to have the highest performance with up to 2000TFLOPs due to its Tensor cores. This is followed by Biren’s BR100 with up to 1000TFLOPs claimed by the company and would place it ahead of AMD’s M250. In contrast, the Big Island offers the lowest FP16 performance among the products at only 147TFLOPs.
Overall, this product comparison indicates that Biren’s BR100 is superior to Nvidia and AMD’s older product gen with A100 and M100 but slightly disadvantaged compared to Nvidia and AMD’s new gen of the H100 and M250. Whereas Shanghai Tianshu Zhixin is on par with Nvidia and AMD’s previous gen. We believe this indicates the performance advantage of Nvidia and AMD compared to the Chinese startups, which we believe are also disadvantaged due to their smaller scale. Thus, we expect the Chinese competitors not to pose a major threat to Nvidia and AMD at least in the short term.
Risk: Long-term Competition from Chinese Startups
While we believe Nvidia and AMD to face a minimal threat from alternatives in the short term, we believe the development of Chinese startups could pose a long-term risk to Nvidia and AMD as they grow larger in the future. According to Intel (INTC), the company expects emerging Chinese CPU makers to threaten its position in 3-5 years such as Shanghai Zhaoxin Semiconductor, Huawei’s HiSilicon Kunpeng CPU and Loongson. However, these Chinese startups depend on TSMC which we believe could be a threat to them if TSMC is pressured to halt doing business with them in the future. In the past, HiSilicon was banned by the US and TSMC was prevented to continue business with it according to The Washington Post. In comparison, Nvidia is a long-time customer of TSMC (TSM) and had been a partner since 1998. Previously, we highlighted that the U.S. government had increased restrictions on Chinese foundries with equipment exports below 14nm which could impact the Chinese startups’ ability to manufacture their chips. However, TechInsights claimed that SMIC “appears to have used 7nm technology” for producing an SoC.
Valuation
|
Nvidia Revenue Projections ($ mln) |
2020 |
2021 |
2022F |
2023F |
2024F |
2025F |
|
Gaming |
7,759 |
12,462 |
11,324 |
14,496 |
18,556 |
23,754 |
|
Growth % |
40.6% |
60.6% |
-9.1% |
28.0% |
28.0% |
28.0% |
|
Professional Visualization |
1,053 |
2,111 |
2,236 |
2,455 |
2,696 |
2,960 |
|
Growth % |
-13.1% |
100.5% |
5.9% |
9.8% |
9.8% |
9.8% |
|
Data Center |
6,696 |
10,613 |
13,632 |
18,051 |
24,606 |
33,858 |
|
Growth % |
124.5% |
58.5% |
28.4% |
32.4% |
36.3% |
37.6% |
|
Automotive |
536 |
566 |
691 |
842 |
1,028 |
1,254 |
|
Growth % |
-23.4% |
5.6% |
22.0% |
22.0% |
22.0% |
22.0% |
|
OEM and Other |
631 |
1,162 |
1,162 |
1,162 |
1,162 |
1,162 |
|
Growth % |
25.0% |
84.2% |
0.0% |
0.0% |
0.0% |
0.0% |
|
Total |
16,675 |
26,914 |
29,045 |
37,007 |
48,048 |
62,988 |
|
Growth % |
53% |
61.4% |
7.9% |
27.4% |
29.8% |
31.1% |
|
Revenue Impact (China ban) |
924 |
2,356 |
3,059 |
4,010 |
||
|
Total (Including Impact) |
16,675 |
26,914 |
28,120 |
34,651 |
44,989 |
58,978 |
|
Growth % |
52.7% |
61.4% |
4.5% |
23.2% |
29.8% |
31.1% |
Source: Nvidia, Khaveen Investments
We updated our revenue projection for Nvidia from our previous analysis in the table above. For its Gaming and Professional Visualization segments, we based its CY2022 revenue growth on its prorated Q1 and Q2 revenues which shows a -9.1% growth for its Gaming segment and only 5.9% for its Professional Visualization segment. This is significantly lower compared to its 2021 growth of 60.6% and 100.5% for its Gaming and Professional Visualization segments, respectively. In our previous analysis, we highlighted the forecasted decline in the PC market by 8.2% according to IDC due to
supply and logistics disruption in China and macroeconomic headwinds.
However, we continued to maintain our previous projections for its Gaming and Professional Visualization segments beyond 2022.
Furthermore, for Nvidia’s data center segment, after factoring in the estimated revenue impact, this reduced our growth forecast for its data center segment to a 4-year forward average of 29.8% through 2025 compared to 33.7% previously.
Overall, despite the revenue impact, we believe the company’s data center segment continues to remain a key segment for the company as we forecasted the segment to have the highest revenue growth at an average of 29.8% through 2025. Also, as its data center segment represented 50.4% of revenues, we expect its high growth outlook to support Nvidia’s total revenue growth. In comparison with other segments, we believe the company’s Gaming segment despite accounting for 46% of revenue to be less significant than its data center segment with a lower forecasted average growth of 18.7% through 2025 as we forecasted its Gaming segment to decline by 9.1% YoY in 2022 as the PC market is forecasted to decline by 8.2% by the IDC. We forecasted its automotive segment to have the second highest growth rate at a 22% CAGR but since it is only 2% of revenue, we do not expect it to contribute significantly to Nvidia’s total growth.
Hence, we continue to believe Nvidia’s data center segment to be the company’s key growth driver through 2025 with the highest segment forecasted growth rate.
|
Valuation |
2022F |
2023F |
2024F |
2025F |
|
Revenue ($ mln) |
28,120 |
34,651 |
44,989 |
58,978 |
|
Growth Rate % |
4.5% |
23.2% |
29.8% |
31.1% |
|
P/S |
12.51 |
11.53 |
10.09 |
8.74 |
|
Valuation ($ mln) |
351,802 |
399,571 |
453,826 |
515,448 |
|
Shares Outstanding |
2,475 |
2,475 |
2,475 |
2,475 |
|
Price Target |
$142.15 |
$161.46 |
$183.38 |
$208.28 |
|
Current Price |
$125.16 |
$125.16 |
$125.16 |
$125.16 |
|
Upside |
13.6% |
29.0% |
46.5% |
66.4% |
Source: Khaveen Investments
Furthermore, we valued the company with a P/S for comparison to our discounted cash flow (“DCF”) valuation. We based its 2025 P/S on the industry average P/S for U.S. semicon companies (20%+ 3-year revenue CAGR) at 8.74x to obtain the price target of $208.28 in 2025. Based on the 2025 price target, we prorated it to derive our 2022 price target of $142.15 in 2022.
In addition, we updated our DCF valuation for Nvidia based on a discount rate of 12.2% (company’s WACC), our model shows an upside of 95%.
Khaveen Investments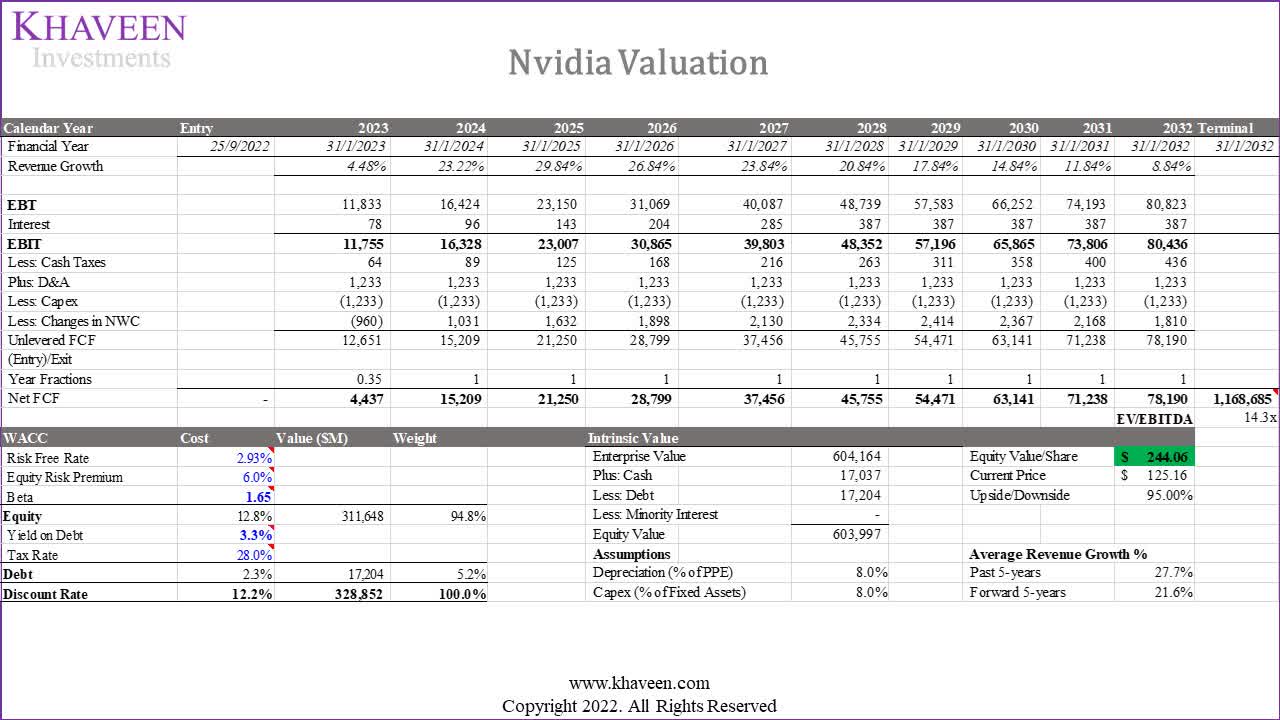
|
Valuation |
DCF |
P/S |
Average |
|
Previous (5-year forecast revenue growth of 26.5%) |
$268.82 |
$157.54 |
$213.18 |
|
Upside |
114.8% |
25.9% |
70.3% |
|
Current (5-year forecast revenue growth of 21.6%) |
$244.06 |
$142.15 |
$193.11 |
|
Upside |
95.0% |
13.6% |
54.3% |
|
Current Price |
$125.16 |
$125.16 |
$125.16 |
Source: Khaveen Investments
In our previous analysis, our valuation was based on a higher EV/EBITDA of 18.4x and a discount rate of 13.3%. The table above shows our adjusted price target from the previous analysis with our previous revenue projections at a higher 5-year average of 26.5% compared to 21.6%. For the DCF valuation, our price target at a 26.5% average forward revenue growth is $268.82 which is an upside of 114.8% compared to $244.06 for the 5-year average of 21.6% at an upside of 95% which is a difference of 19.8%. Whereas for the P/S valuation, our price target with our previous revenue projections is $142.15 (13.6% upside) which is only slightly lower compared to our valuation of $157.54 with an upside of 25.9% based on our previous revenue projections.
Thus, we believe the new restrictions would impact Nvidia’s revenue growth negatively, which affects its valuation, but only slightly, as we obtained a lower valuation of only 19.8% based on DCF and 12.3% based on P/S.
Verdict
All in all, following the confirmation of the U.S. government’s restrictions on Nvidia and AMD’s data center product sales to China, we analyzed the company’s revenue breakdown to determine its exposure to China which is 26.4% based on its latest annual report. However, we believe this is not reflective of the revenue impact faced by Nvidia which guided a revenue impact of around 6% in its upcoming quarter. Thus, we analyzed the Chinese cloud companies’ market share and estimated a revenue impact of 6.4% for Nvidia which is more in line with management’s guidance. Despite that, we believe Nvidia and AMD both will face a limited impact in terms of alternatives from Chinese startups as we analyzed and determined Nvidia and AMD’s performance advantage which highlights their technological superiority.
Although we factored in our estimated revenue impact on Nvidia, we expect its data center segment to remain its key growth driver with higher growth than all other segments including Gaming and Automotive. In terms of valuation, despite a lower revenue projection at a 5-year forward average of 21.6% compared to 26.5% previously, we obtained a slightly lower price target of $244.06 which is not a huge impact to the upside at 95% as its stock had declined by 58% YTD and we maintain our Strong Buy rating for the company.
Be the first to comment