

Jae Young Ju
The investment thesis
The chip business is notoriously cyclical, more so than the overall economy at least. And by this time, it is kind of public information that the last chip cycle has already passed its peak. You can see that either from the stock prices (chart 1 below) or the sales (chart 2 below). Chart 1 shows the YTD price decline of the sector’s two leading stocks, NVIDIA (NASDAQ:NVDA) and Micron (NASDAQ:MU). NVDA suffered a total loss of more than 48% YTD and MU more than 36% (which requires a 92% and 56% rally to break even, respectively). In contrast, the overall tech sector (represented by the QQQ fund) suffered a relatively milder correction of 28% loss.
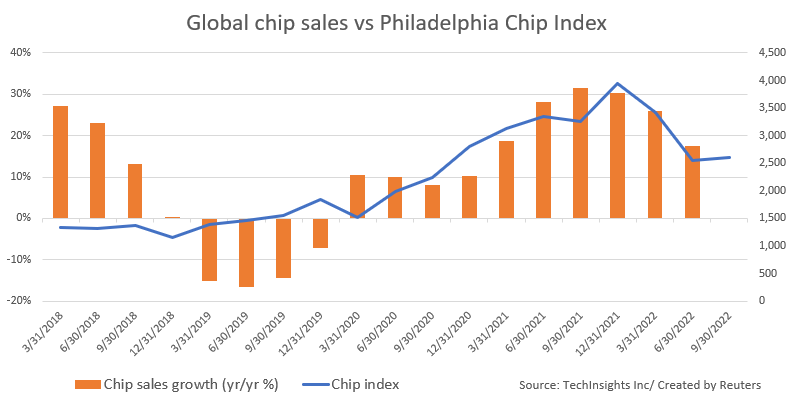
Chart 2, taken from this Reuters report, shows the cyclicality of the sector more vividly. The report calls the current stage the toilet paper hoarding moment for the chip business, for good ideas. Due to the chip shortage earlier in the year, companies started to hoard chips “just in case” they need them and cannot get them (just like people hoarding toilet paper when COVID first broke out). And quickly the shortage turns into a glut, taking chip companies such as NVDA and MU and also Wall Street by surprise in the same way the toilet paper hoarding surprised Kimberly-Clark (KMB) and Clorox (CLX).
You can see the cyclical dynamics pretty clearly in the chart. Sales growth (the orange bars) went through almost a perfect sine wave, with about a 3.5 to 4 years cycle. The growth peaked in early 2018 and then again in 2021 September. The growth (or negative growth to be more precise) bottomed for the last time in June 2019. If it follows the same 3.5 to 4 years cycle, then one would expect the next bottom to occur in the second half of 2022 or early 2023.
In investing, trying to perfectly time the entry at the bottom is a fool’s errand, both practically and emotionally. However, investors can develop a pretty good sense of where the pendulum currently is through study and research, especially similar historical events. And such a general idea is already sufficient to drive good investment returns. It is always better to be approximately right (or directionally right) than precisely wrong.
In the remainder of this article, I will share my experiences and outlook for the chip cycle with a focus on NVDA and MU. You will see that my view is that the business fundamental cycle has not bottomed yet (again, I expect that to happen in the second half of 2022 or early 2023), but the valuation cycle has gotten there already (valuation always leads fundamentals). And this is the reason we started a position in MU recently. I will also share some thoughts on why I prefer MU over NVDA toward the end.
Seeking Alpha Source: Techinsights Inc and Reuters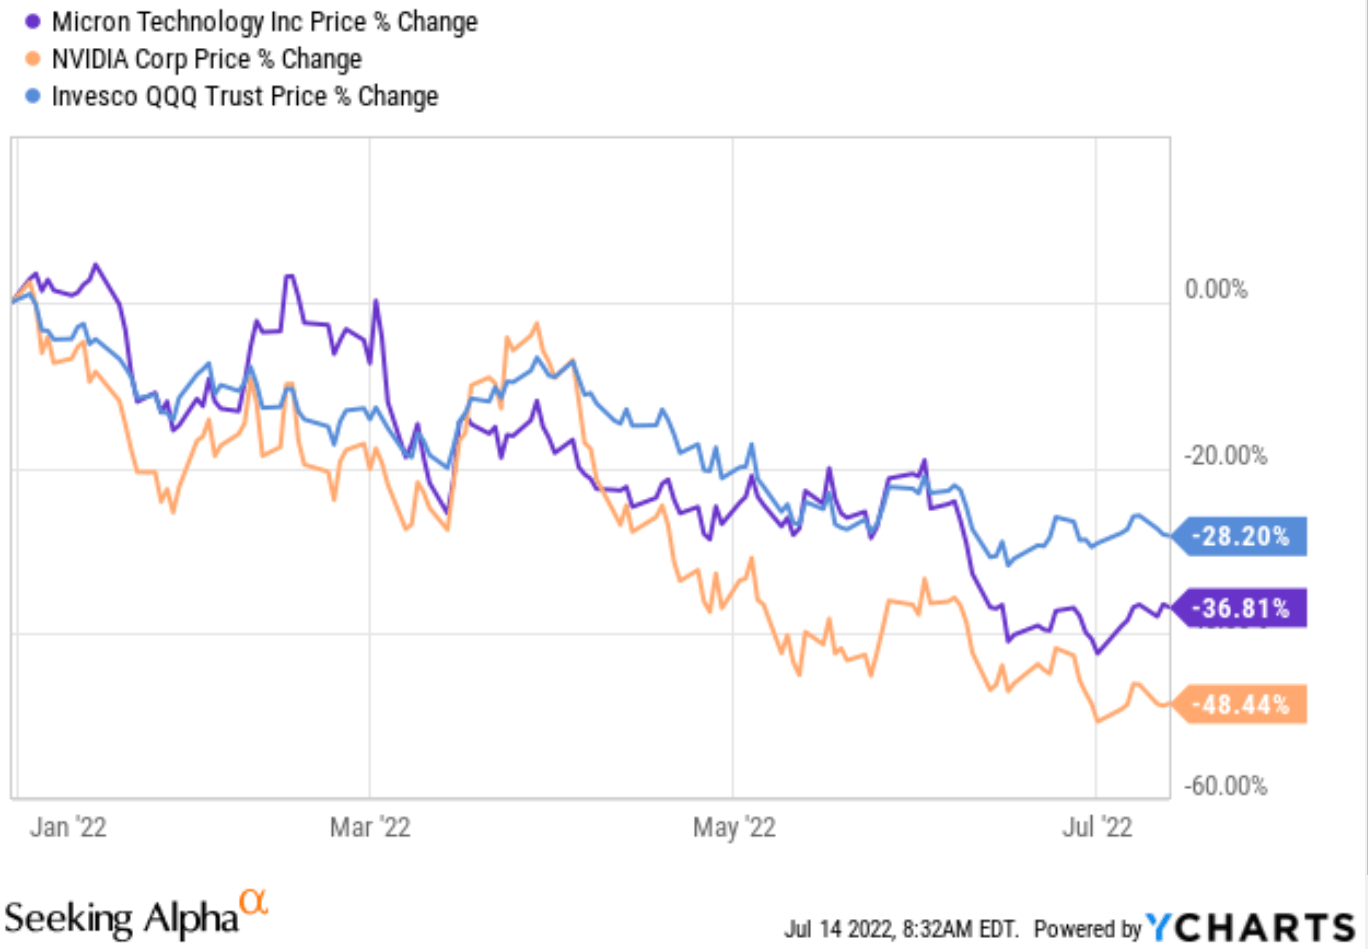
Where are we in the cycle?
The Reuters chart above showed the cyclicality of the general chip sector in the past 5 years (which is about one cycle). And the chart below broadens the view a bit to the past 10 years, showing the last two cycles for NVDA and MU. You see the same sine wave behavior. At a deeper level, nothing “new” really happens in investing. Things may take on new names (AI, cryptocurrency, et al), but the fundamental governing laws never change as long as human nature does not change.
Philosophies aside, we see that the previous chip expansion cycle peaked in 2014 and peaked again toward 2018, resulting in a cycle of about 4 years ago (in the 3.5 to 4 years range). Similarly, the contracting cycle reached its worst in 2016 and again toward 2020, showing the 3.5 to 4 years cyclicality once again.
Seeking Alpha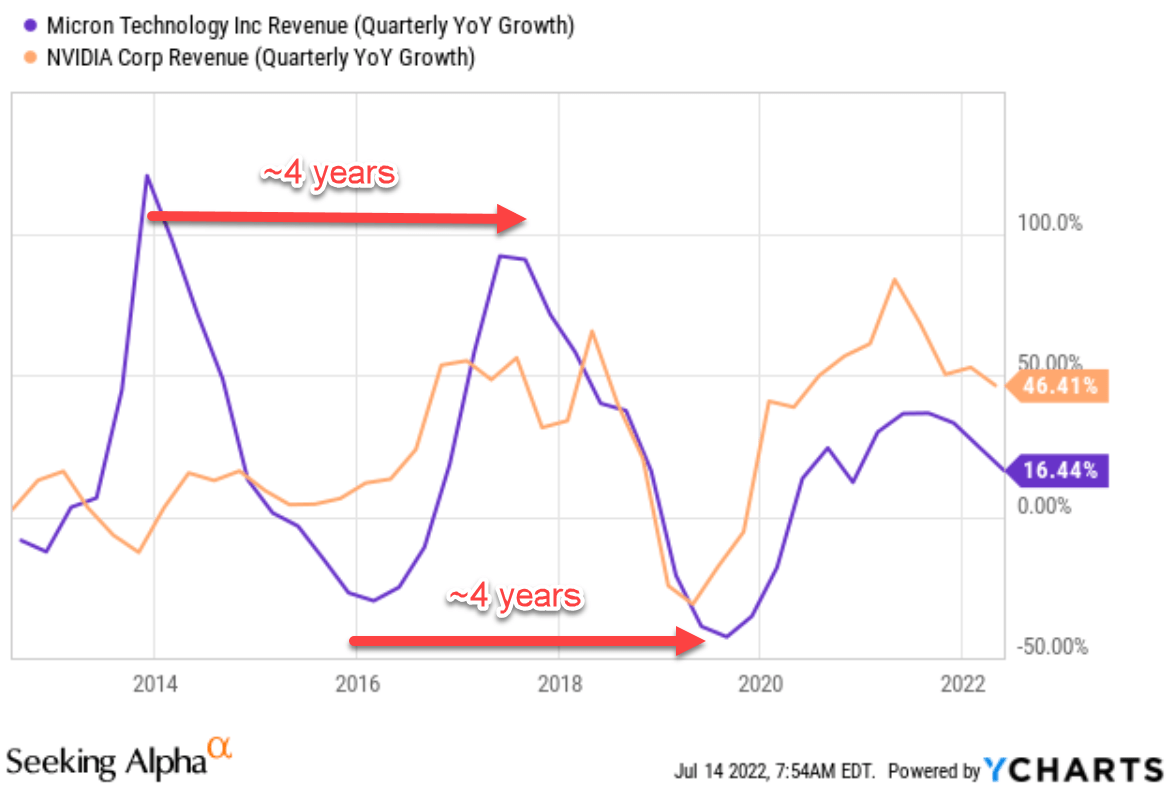
Looking forward, I foresee the next steps will be like the following. Again, I won’t pretend that I can predict the details and specific timing precisely. But I’ve seen the movie and read the script multiple times before both in the chip sector and other sectors. Hence, I am quite confident about the general direction, which has been sufficient to guide my investment decisions (e.g., to stay away from the chip sector no matter how hyped they are during 2021). On the demand side, the market will first have to digest the chips that they have hoarded. On the supply side, MU and NVDA will have to sell their own accumulated inventory first, which will take some time as the demand will be low. You can see the signs from the chart below, which shows that days of inventory standing. MU’s inventory fluctuated in a range between about 80 days to 128 days with an average of 104 days in the past 10 years.
NVDA’s inventory fluctuated in a range between about 67 days to 112 days with an average of 86 days in the past 10 years. Both their inventories reached a 10-year peak around 2020 and 2021, which to me is a clear sign of overexpansion and overconfidence (that their products will sell as fast as they can make them). Then in a wicked way, the COVID and global supply chain disruptions actually helped them and provided data to support their overconfidence (at least temporarily). The demand side turned from a “just in time” mode to a “just in case” mode by hoarding chips and driving down their inventory.
Now the hoarding has come to an end, and their inventory is standing at a relatively high level (above historical average). So the next logical step is either to reduce the price (there are signs of this already as detailed in the risk section) and also scale back production if price reduction itself is not sufficient. In late June, MU Chief Business Officer Sumit Sadana already mentioned that MU would reduce production.
When both price and production have been reduced sufficiently, then the contraction cycle will end and the expansion cycle restarts. Inventory is an important metric that I suggest investors monitor closely in the next few months, and it’s something I will pay special attention to during their upcoming earnings reports.
Seeking Alpha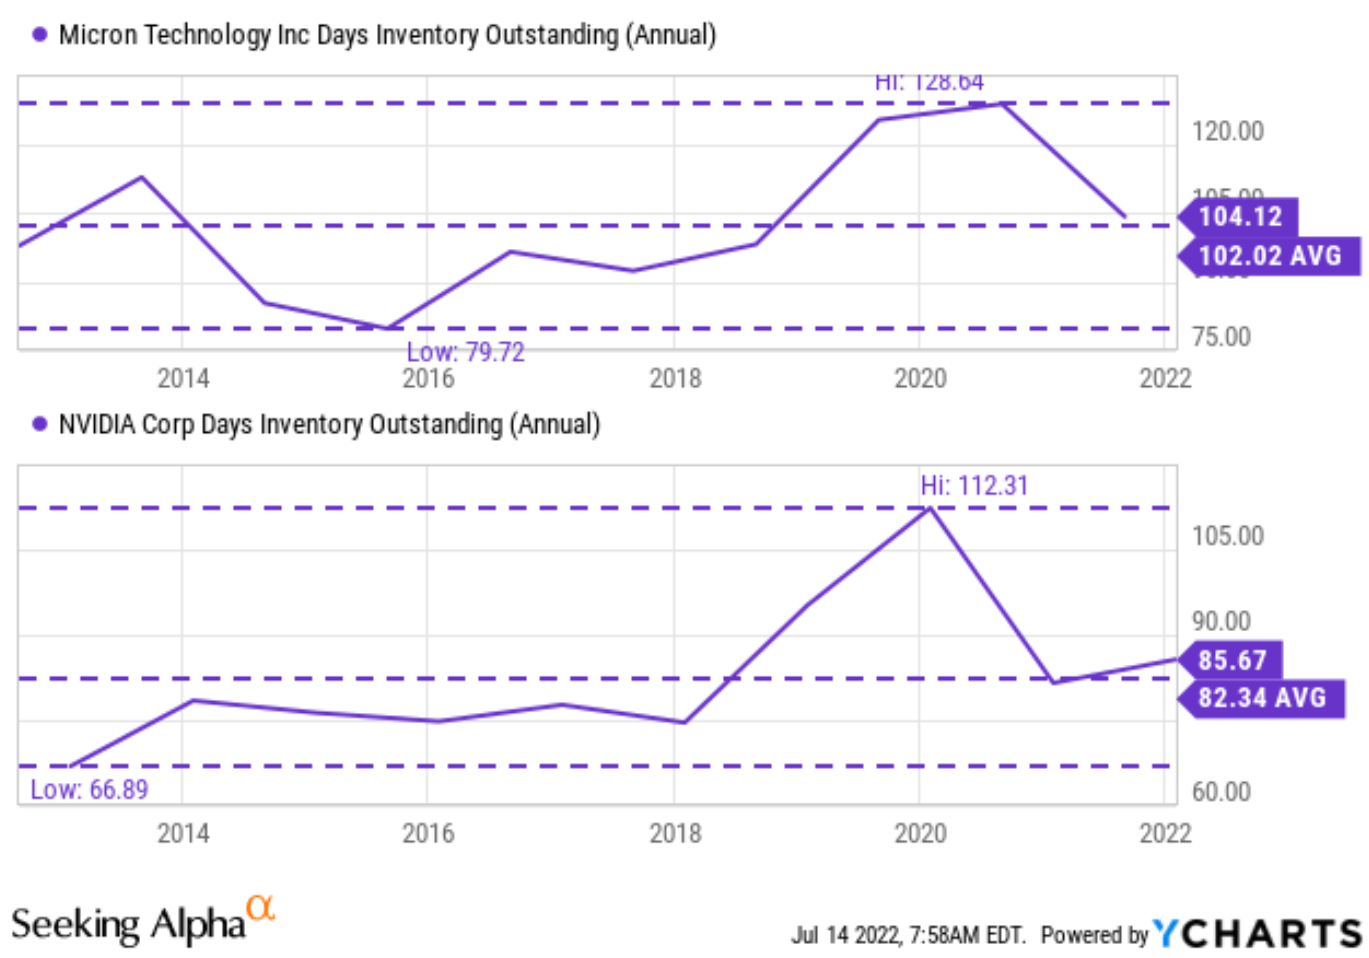
The forever forward-looking nature of P/E
Investors are always forward-looking (like what I am doing here). And the current valuation always tries to price in future developments. Again, just like what I’m doing here – since I am predicting the contraction cycle to end in early 2023, the price I am willing to pay today is based on the condition that I predict for early 2023, not the current conditions.
For this reason, valuation always leads business fundamentals as you can clearly see from the following charts. Even though the fundamentals have not bottomed yet (actually the chip sector is still reporting positive growth if you recall from the early charts), their P/E ratios already reached a multi-year bottom.
To be more specific, the FW P/E for MU has fluctuated between about 6.3x and 16x with an average of 10.7x. And you see can that its current FW P/E of 6.9x is already close to the multi-year bottom. The picture is very similar for NVDA. Its FW P/E has fluctuated between about 26.7x and 77x with an average of 44.4x. And its current FW P/E of 28x is already close to the multi-year bottom.
Seeking Alpha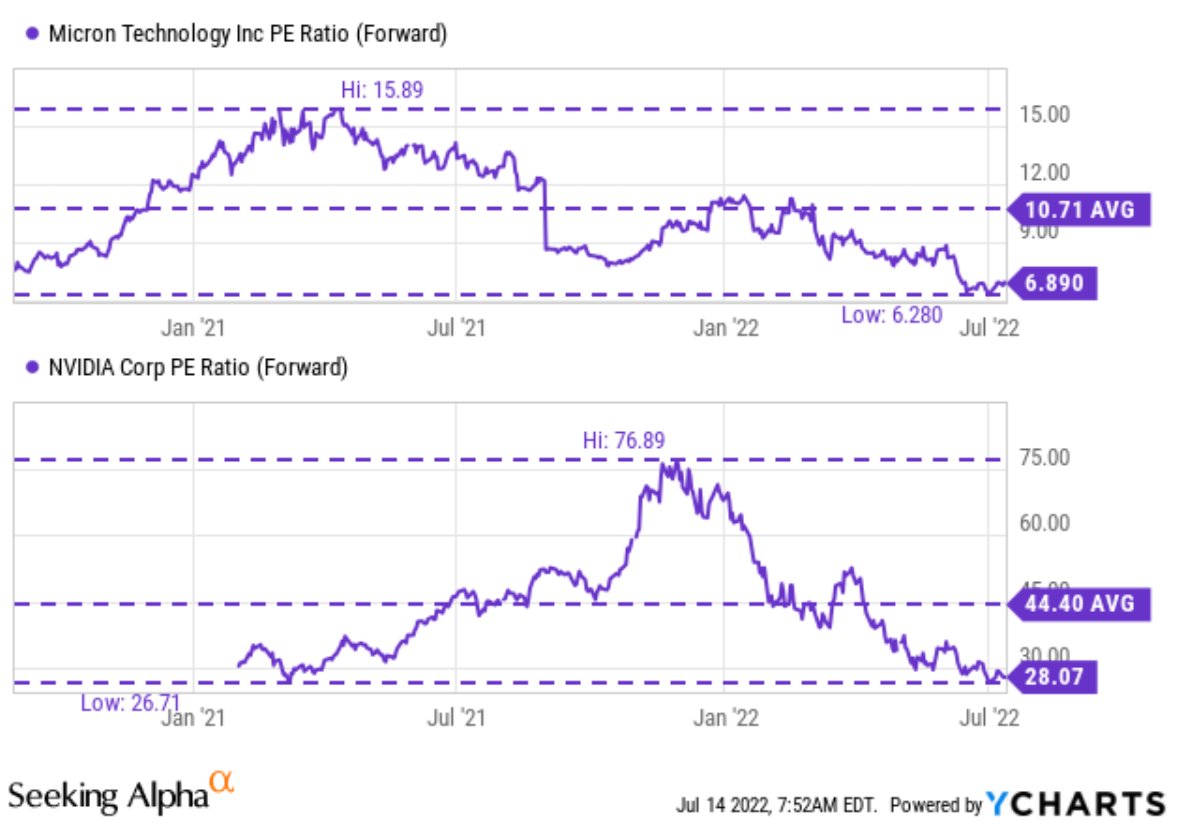
The following chart probably illustrates the dynamics more clearly here. The chart shows the YoY quarterly revenue growth of MU overlaid with its P/E ratio during the last cycle. As you can see, in its last contraction cycle, its P/E bottomed in early 2019, about 10 months ahead of its fundamentals (its contraction did not end till late 2019). Then in its last expansion cycle, its P/E peaked in early 2021, leading its fundamentals by about five months.
Now back to my projection that the current contraction cycle will reach its worst in the next 6 to 12 months, if history is of any guidance, the valuation has already contracted enough by this time.
Let me emphasize once again that I’m not pretending that I have a crystal ball and know all the specifics. A friend of mine, specializing in technical analysis, once told me that A) if you can predict EITHER one of the two things, the target price OR the target timing, you can already become rich, and B) if anyone tells you that he can predict BOTH, then he’s simply lying. The same wisdom applies here. Prices of both MU and NVDA could certainly fall more from here and/or their contraction cycle last longer. But as mentioned before, an overall sense of the stage is good enough to generate market-beating performance already (i.e., staying away from NVDA when it has already been expanding for 3 years in a row and P/E climbed to 70+).
Seeking Alpha
Expected return
The reason that I hold MU but not NVDA is twofold: expected returns as shown in the roadmap below and also risks (as detailed in the next section). The mechanics of the roadmap has been detailed our earlier article. The underpinning idea is that:
- The long-term ROI for a business owner is simply determined by two things: A) the price paid to buy the business and B) the quality of the business. More specifically, part A is determined by the owner’s earning yield (“OEY”) when we purchased the business. And that is why PE is the first dimension in our roadmap. Part B is determined by the quality of the business and that is why ROCE (return on capital employed), the most important metric for profitability, is the second dimension in our roadmap.
- Now, the long-term growth rate is governed by ROCE and the Reinvestment Rate. These are the two most important growth engines, and they mutually enhance each other. High ROCE means every $1 reinvested can lead to a higher growth rate, which leads to more future profits and more flexible capital allocation to fuel further growth, and so on. So to summarize:
- Longer-Term ROI = valuation + quality = OEY + Growth Rate = OEY + ROCE*Reinvestment Rate
Under this framework, we like the projected long-term return of MU better. Its profitability measured by ROCE is undoubtedly lower than NVDA (about 30% compared to NVDA’s 60% to 70%), but the total return is higher when valuation and quality are holistically considered. And note both NVDA and MU enjoy far superb profitability over the general economy (whose ROCE is around 20%), and both offer favorable odds to outperform the market under their current conditions.
Author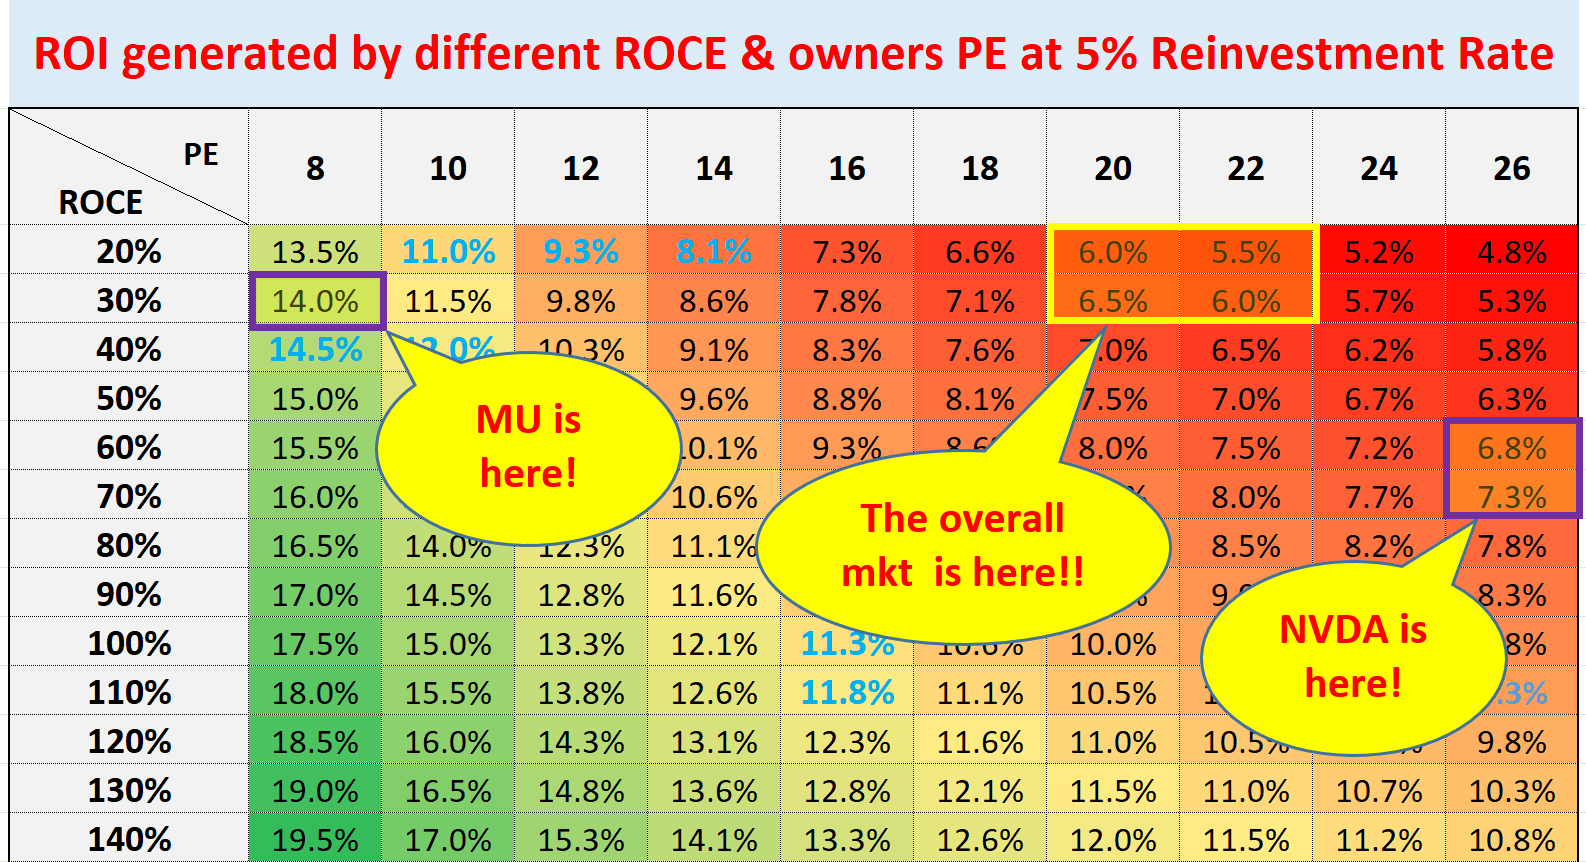
Final thoughts and risks
The silicon shortage has turned into a glut. And it will take a while (my estimate is about 6 to 12 months) for the glut to clean up. In the meantime, chip producers such as MU and NVDA will have to reduce prices and/or reduction production. MU Chief Business Officer Sumit Sadana already mentioned a plan to reduce production. And analysts have already noted pricing for graphics cards fell by about 20% in the June quarter from the March quarter due to rising inventories.
The historical chip cycles lasted about 3.5 to 4 years. As such, I foresee the current downturn stage to last into late 2022 or early 2023. Although valuation is forever forward-looking and always reacts more hastily. Historically, valuation has led businesses fundamentals by about 5 to 10 months and seems already raced to the bottom for both MU and NVDA in this current downturn cycle.
Finally, other risks. History rhymes, but no two cycles are identical. This round is caught in a perfect storm, and interactions among high inflation, COVID, and war in Ukraine could prolong the downturn cycle for the general chip sector. Specific to MU and NVDA, NVDA still features an evaluated valuation risk as aforementioned. A 28x PE is not only higher than MU by comparison but also in absolute terms, especially amid recession uncertainties.
Besides the valuation consideration, another reason I like MU more than NVDA is the correlation of high-end GPUs to crypto mining, which is completely random and unpredictable to me (as detailed in our earlier article). This Barron’s report seems to have made the same observation and attributed the recent large price fall in graphics cards to:
Rising inventories, lower cryptocurrency prices, and concerns about Ethereum’s upcoming migration from a “proof-of-work” model to “proof-of-stake,” which will negate the need for graphics cards for mining.
Be the first to comment