

kynny
NVE Corporation (NASDAQ:NVEC) sold off the day after the latest earnings report. Nevertheless, the stock managed to bounce off the lows and it has slowly creeped up higher in recent days. Still, the stock remains below the highs reached prior to the report. There are also those who are likely to be disappointed with what the report had to say after expectations were raised following the second-to-last earnings report. In addition, support has held the stock up, but that may not last with the constant pressure, which would open the door for a renewed slide in the stock. Why will be covered next.
Why the stock fell in response to the latest report from NVEC
There were those who were curious what NEVC would come up as an encore after Q2 FY2023, which was in many ways an exceptional quarter. For instance, NVEC reached a milestone when it earned $1.26 a share, which marked the first time NVEC earned enough to cover the quarterly dividend of $1. With the exception of Q2 FY2023, NVEC has earned less than the $1 it pays out in dividends, which, while not necessarily a problem in the short run, is nevertheless a point of concern for many.
Q2 FY2023 also stood out for one more thing. Quarterly revenue was stuck in the $5-8M range until Q2 FY2023 when revenue reached a record $10.7M. Unfortunately, NVEC was not able to follow up. NVEC still managed to grow the top and the bottom line by double digits, but more was expected, which explains why the stock dropped after the Q3 FY2023 report.
Q3 revenue increased by 17.7% YoY to $7.4M, but it also decreased by 30.9% QoQ. GAAP EPS increased by 22.2% YoY to $0.88, but it also decreased by 30.2% QoQ. Not bad, but the numbers likely disappointed those who were hoping that NVEC had turned a corner after Q2 FY2023. The numbers suggest NVEC is back to its old self, which is a company that has long struggled with sustained growth. The table below shows the numbers for Q3 FY2023.
Note that the gains in the bottom line were in part due to an increase in interest income. Long-term marketable securities reached $41.17M on the balance sheet, up from just $24.31M at the start of FY2023. On the other hand, cash, cash equivalents and short-term marketable securities fell to $12.36M, down from $31.28M at the start of FY2023.
|
(GAAP) |
Q3 FY2023 |
Q2 FY2023 |
Q3 FY2022 |
QoQ |
YoY |
|
Revenue |
$7,401,678 |
$10,717,824 |
$6,290,809 |
(30.94%) |
17.66% |
|
Gross margin |
80.0% |
77.6% |
78.0% |
240bps |
200bps |
|
Operating margin |
65.1% |
67.3% |
64.2% |
(220bps) |
90bps |
|
Operating expenses |
$1,104,058 |
$1,105,603 |
$868,651 |
(0.14%) |
27.10% |
|
Income from operations |
$4,819,248 |
$7,209,440 |
$4,037,152 |
(33.15%) |
19.37% |
|
Net income |
$4,231,324 |
$6,090,373 |
$3,465,407 |
(30.52%) |
22.10% |
|
EPS |
$0.88 |
$1.26 |
$0.72 |
(30.16%) |
22.22% |
Source: NVEC
If there were still people out there who were hoping that Q2 FY2023 was the first of many, then they were likely disappointed. Management poured cold water on the idea of a repeat of Q2 FY2023 anytime soon. From the Q3 earnings call:
“there is a chunkiness in our government-related business that we alluded to in our comments. We’re still serving that market. It’s just returning to a more of a normal state. So I would say that to jump back up to a $10 million quarter would be not something that we would say that we can readily see in the future, although that’s certainly our goal.”
A transcript of the Q3 FY2023 earnings call can be found here.
The stock has held up, but for how much longer remains to be seen
The stock fell as much as 11% after the release of the Q3 report, only to recover before the end of the day to wind up with a loss of about 4.6%. Furthermore, the stock creeped up higher in the following days to recoup a portion of the post-earnings losses. The stock is still below where it was before the Q3 report, but at $74.09, it is only 3.8% away from the high of $76.99 set on January 23, intraday highs not included.
The stock has gained 14.4% YTD, which might seem impressive, but it’s actually worse in comparison to most semiconductor stocks. For instance, the iShares PHLX Semiconductor ETF (SOXX) has gained 24.3% YTD, much better than the 8.6% gain for the SPDR S&P500 ETF (SPY). NVEC is somewhere in between, but it still means that NVEC has underperformed compared to most semis. The chart below shows how the stock has soared higher after the Q2 FY2023 report was released on October 19.
Source: finviz.com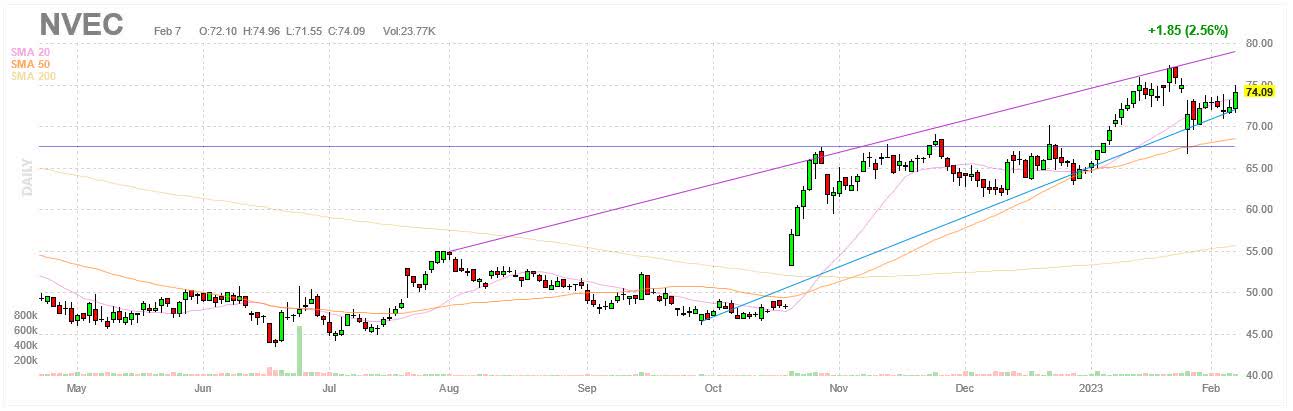
However, while the stock has recovered most of the post-earnings losses, the stock may have also laid the groundwork for a bigger move in the near future. Note the two trendlines above. The upper trendline can be seen as resistance and the lower as support with the stock moving between these two trendlines that are converging on one another. The stock has been hugging the lower trendline ever since it dropped after the Q3 report.
Support has held and the stock has ticked up higher along with the trendline, but the fact that the stock needs constant support is a cause for concern. The more often support is challenged, the greater the odds support will fail to hold. Support has held up the stock and, if that goes away, it may be a long way down before the stock finds it again.
Note that the stock is also painting what looks like a rising wedge, a bearish chart pattern. If correct, this would mean that the stock is getting ready for a reversal of the current trend in the stock, which has trended higher since last October. The trendlines are not close to converging and the stock can continue higher within the wedge for a while longer, but when there is the eventual breakout, it’s most likely to happen with the stock breaking through the lower trendline. The stock could potentially make it all the way back to the base of the uptrend that started in October.
Valuations are still okay
NVEC has appreciated by almost 54% since the stock started its rally on October 20. Yet valuations are still within reason. NVEC has an enterprise value of $296M, which is equal to 14 times EBITDA. If the stock does correct, it will likely not be due to valuations. The table below shows some of the multiples NVEC trades at.
|
NVEC |
|
|
Market cap |
$348.98M |
|
Enterprise value |
$296.00M |
|
Revenue (“ttm”) |
$32.2M |
|
EBITDA |
$21.1M |
|
Trailing GAAP P/E |
19.11 |
|
Forward GAAP P/E |
N/A |
|
PEG ratio |
0.59 |
|
P/S |
10.85 |
|
P/B |
5.50 |
|
EV/sales |
9.20 |
|
Trailing EV/EBITDA |
14.04 |
|
Forward EV/EBITDA |
N/A |
Source: SeekingAlpha
Investor takeaways
NVEC is a proponent of the use of spintronics and although the technology has its advantages, NVEC has struggled with uptake. Revenue and EPS have remained more or less stagnant for many years. The Q2 FY2023 report was a breath of fresh air in that sense as it surpassed both $10M in revenue and $1 in EPS, all barriers that NVEC has struggled to cross.
However, the Q3 FY2023 report poured cold water on expectations as management suggested not to expect another quarter with $10+M in revenue anytime soon. The quarterly numbers were by no means bad, but they must have come as a disappointment to those who thought NVEC had turned a corner when it comes to growth. The report likely reinforced the conviction of those who were skeptical of all the supposed progress made by NVEC.
While the headline numbers look pretty solid with both revenue and EPS increasing by double digits YoY, they are not that different from what the market had gotten accustomed to from NVEC. Q3 revenue of $7.4M is within the $5-8M range NVEC has been stuck in for years. Ditto for EPS of $0.88, which is again less than the $1 quarterly dividend that NVEC has once again announced. The latest report from NVEC was basically a case of more of the same, which is the last thing you want if you need to get past the same old, same old.
I remain neutral on NVEC after getting out due to questions raised in a previous article. The latest report from NVEC show that these concerns are definitely warranted. NVEC is still stuck in a loop when it comes to growth. NVEC is still not earning enough to cover its dividend. In addition, the current yield at 5+% is no longer high enough to sway the doubters. In the past, zero interest rates made NVEC an attraction due to its relatively high yield at 8+% and people were more forgiving of NVEC’s flaws due to this.
It’s true the stock has continued higher after an initial drop, but the chart patterns suggest a reversal may not be so far away. Support has held its ground, which has allowed for the stock to move higher, but the more often support has to step in to keep the stock afloat, the more likely it becomes support fails and the stock breaks down.
The current rally that goes back to last October was after all triggered by an outstanding earnings report that suggested NVEC might have solved its two biggest issues, namely anemic growth and a dividend payout that is not sustainable in the long run. But the latest report suggests NVEC has yet to find the solution. It’s therefore not out of the question that the stock reverses to unwind a rally that was built on mistaken assumptions.
Bottom line, NVEC remains a company with potential, but also some serious flaws that need to be worked on. If NVEC wants to convince more buyers that the stock is worth backing for the long term and not just for the occasional trade, then it has to show that it can keep growing the top and the bottom line, something it has failed to do over the years. Potential only goes so far as it comes with an expiration date. At some point, you are who you are. Potential has to translate into the bottom line. If it does not, then it won’t be long before people start losing interest and move on to those that do deliver.
Be the first to comment