

Andrii Dodonov/iStock via Getty Images
(This article was co-produced with Hoya Capital Real Estate)
Introduction
I promised a reader a post-merger follow-up article once Nuveen posted the new Nuveen Select Tax-Free Income Portfolio (NYSE:NXP) composition. This article does that, plus compares NXP against other Nuveen tax-free national CEFs with some different values for important variables.
High income investors look to tax-free funds to enhance their after-tax yields. While they help investors avoid Federal income taxes, muni-bond income is included when calculating one’s MAGI, or Modified Adjusted Gross Income, a figured used by IRMAA and some other IRS eligibility rules.
While some of the other municipal bond strategies appear better choices, amongst the three Investment-Grade, Non-Leverage CEFs, NXP is the best.
Nuveen Select Tax-Free Income Portfolio Review
Seeking Alpha describes this CEF as:
The Fund’s investment objective is current income exempt from regular federal income tax, consistent with preservation of capital. The fund invests in the investment-grade municipal securities rated Baa and BBB or better. It benchmarks the performance of its portfolio against the Standard & Poor’s (S&P) National Municipal Bond Index and Lipper General and Insured Unleveraged Municipal Debt Funds Average. The original NXP fund started in 1992. Its two related funds became part of NXP in late 2021.
Source: Seeking Alpha
NXP has $688m in AUM and has a 3.9% yield. Nuveen charges 29bps in fees, lower than many Nuveen CEFs as NXP employs no leverage.
Holdings Review
Nuveen includes this statement about its possible asset allocation strategy.
The Fund may invest up to 20% of its managed assets in municipal securities rated below investment quality or judged by the manager to be of comparable quality, of which up to 10% of its managed assets may be rated below B-/B3 or of comparable quality. The Fund may invest in inverse floating rate municipal securities, also known as tender option bonds. The Fund’s use of tender option bonds to more efficiently implement its investment strategy may create up to 10% effective leverage.
Source: nuveen.com NXP
Nuveen.com NXP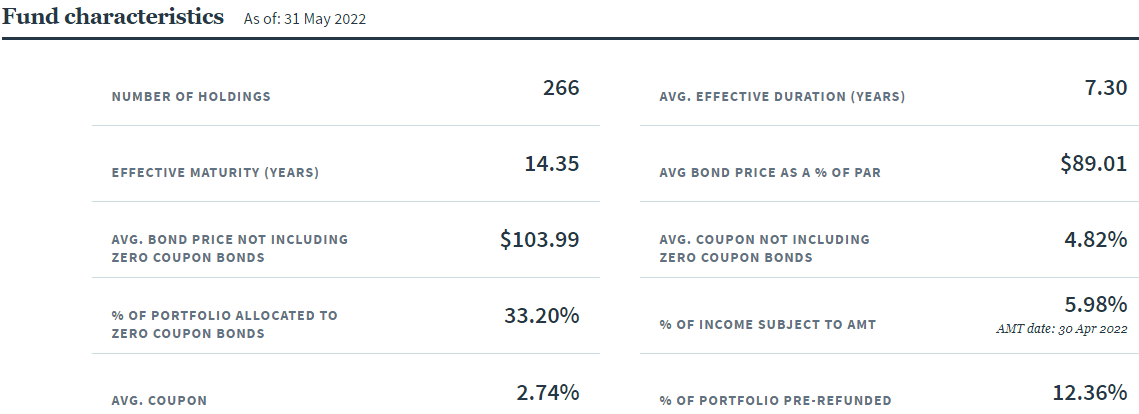
Nuveen provides the above basic data about NXP’s portfolio.
Nuveen.com NXP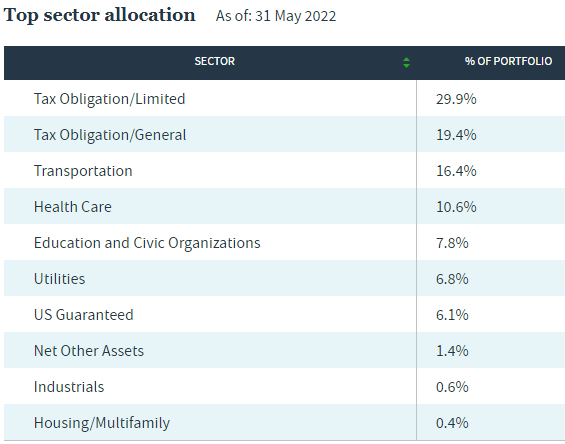
The taxing ability of the underlying issuer accounts for almost 50% of the portfolio, with almost 30% restricted as to where its income comes from (i.e., not general tax revenue). This compares to my estimated 40% when the funds merged. The Top 10 state exposures are:
Nuveen.com NXP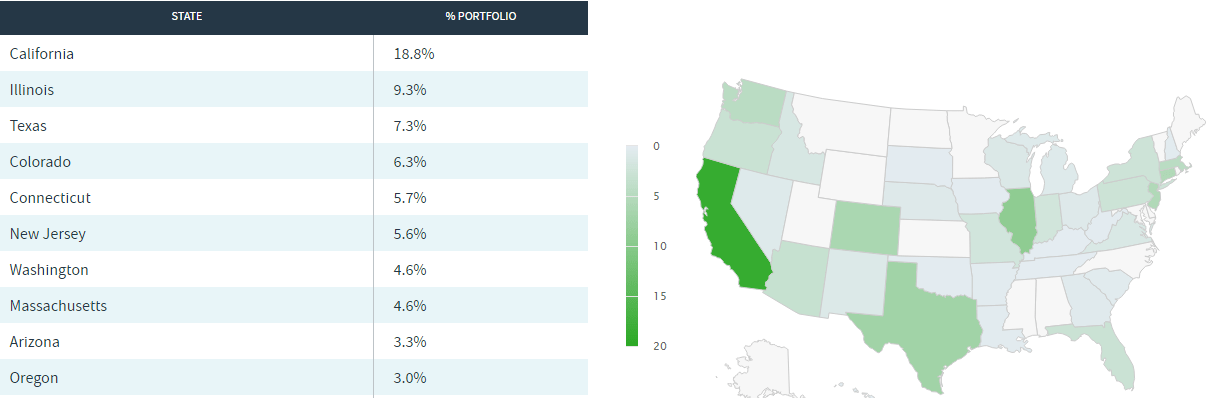
California dominates the portfolio, as it did before. Assuming those are supported by state revenue, they should be currently secure as the state posted a $62b surplus! These weights are close to what my estimates were.
Nuveen.com NXP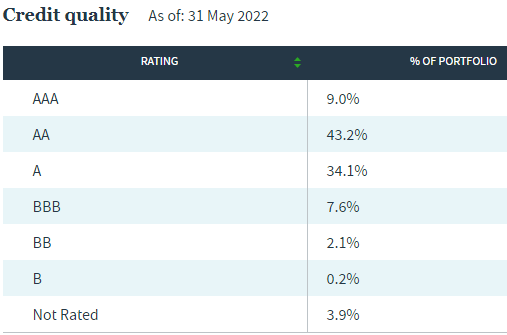
With BB and below considered non-investment-grade debt, NXP is almost totally in IG bonds, as would be expected. I did not find their rules for selling off bonds when the ratings dipped below IG levels.
Nuveen.com NXP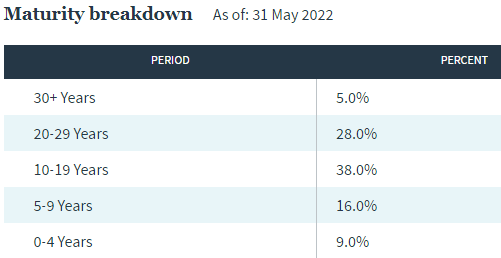
NXP invests in longer-date bonds, resulting in weighted maturity of over 14 years. Only 9% of the portfolio matures over the next four years, limiting a natural roll into higher coupons expected to be available in that period versus today. New coupons need to be near 5% to be above the average coupon of the current portfolio.
Nuveen.com; compiled by Author (5/31/22)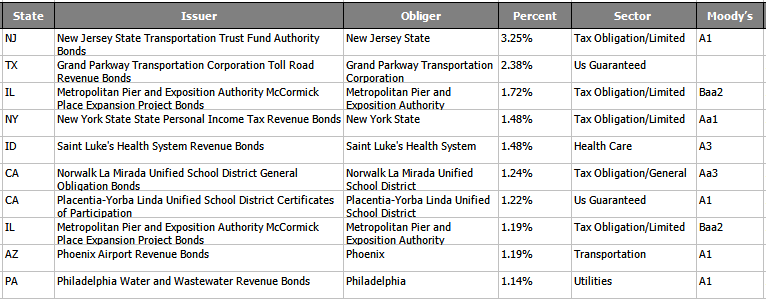
The above 10 largest holdings equal 16% of the portfolio. This is what I approximated NXP’s Top 20, post-merger, using 10/31/21 data, would be.
Nuveen.com; compiled by Author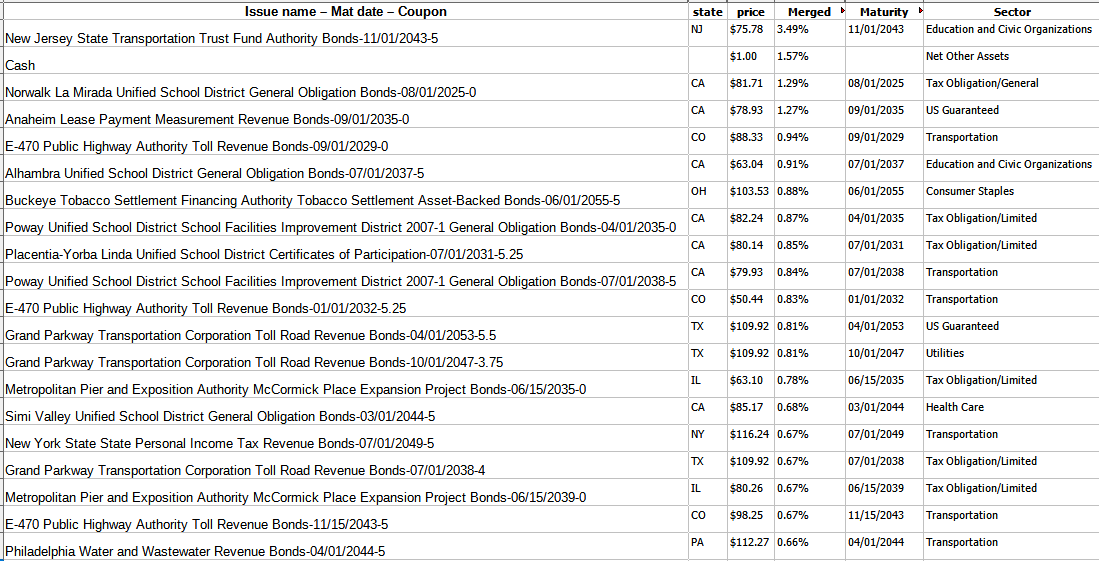
This was the sector and largest state estimated allocations using the same data.
Nuveen.com; compiled by Author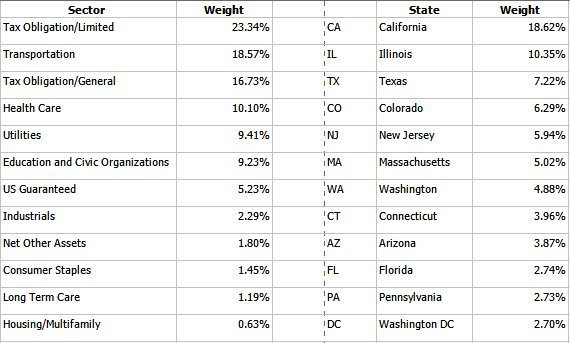
Distribution Review
seekingalpha.com NXP DVDs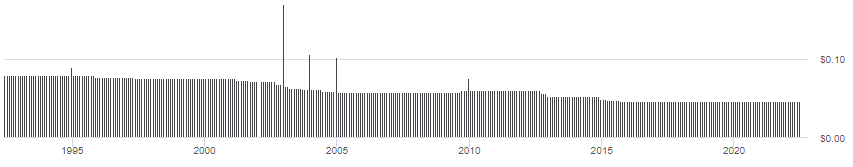
As interest rates basically declined since 1995, NXP’s payout has followed suit. Over the last three months, NXP has not earned enough to cover their payouts. This could indicate another reduction might occur.
Nuveen.com NXP
Price And NAV Review
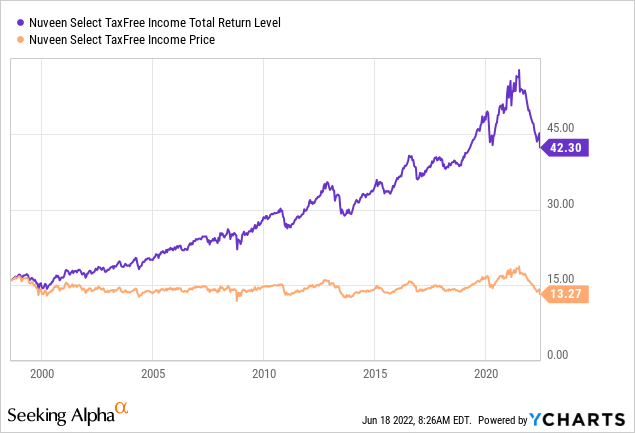
The latest price is down 17% from the initial value and currently is below the worst level that happened during the COVID crash. The Total Return is near zero since, then too after a strong recovery. Historically, it appears NXP is at a good buy point. The next chart compares Price to NAV.
CEFConnect.com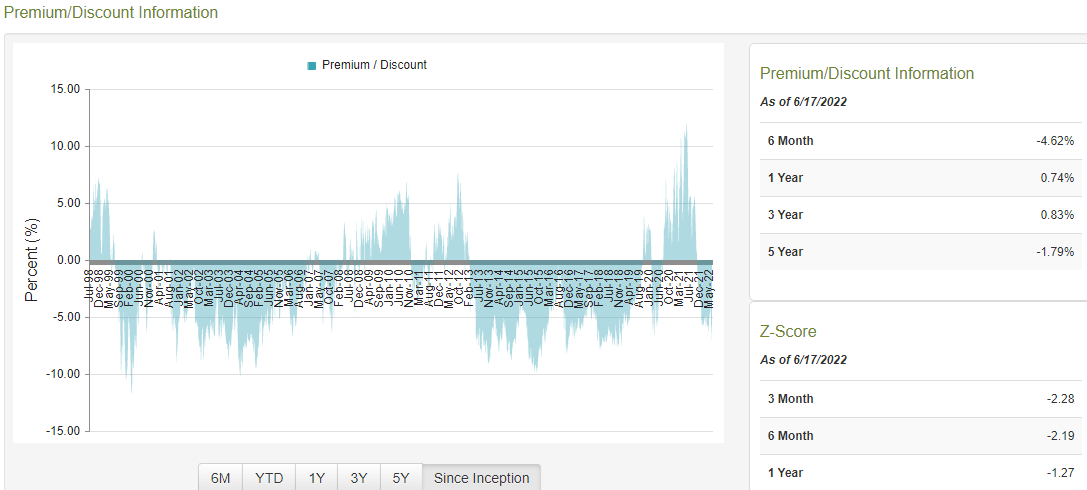
NXP owners, like myself, should have seen last summer as a “take the money and run” moment based on the historical level the premium reached at that time. Even on a Total Return basis, NXP is down over 25% since the peak. The current 7.27% discount, while the best since 2020, is only average in terms of depth.
CEF Comparison
Nuveen classifies its national tax-free CEFs into three groupings: High-Yield, Investment-Grade, and Mixed. NXP is from the Investment-Grade group. I included a leveraged CEF from that group in the comparison: NIQ.
- Nuveen Municipal High Income Opportunity Fund (NMZ)
- Nuveen Intermediate Duration Municipal Term Fund (NID)
- Nuveen Intermediate Duration Quality Muni (NIQ)
| NXP | NMZ | NID | NIQ | |
| Size | $695m | $1300m | $648m | $176m |
| # of Holdings | 266 | 867 | 419 | 175 |
| Fees | 26bps | 143bps | 119bps | 105bps |
| Premium/Discount | ||||
| Leverage | 0% | 39% | 36% | 36% |
| Yield (mkt) | 4.1% | 6.9% | 4.3% | 3.7% |
| Earnings/Dist ratio | 96.7% | 92.1% | 94.7% | 89.3% |
| Average Coupon (x Zeroes) | 4.82% | 6.18% | 5.62% | 5.49% |
| Average Bond Price (x Zeros) | $103.99 | $90.75 | $99.43 | $105.10 |
| Duration/Maturity | 7.3/14.4 | 17.1/23.2 | 6.4/10.0 | 8.3/10.8 |
| Est. Portfolio Rating | AA- | BBB+ | A- | A+ |
As you can tell from the differences in Duration/Maturity, NMZ has a much longer portfolio, which helps explain it having the lowest average bond price. Using Nuveen data, I estimated what each portfolio’s weighted bond rating came to (this ignores non-rated bonds whose percents were widely different). The average coupon reflects these results.
PortfolioVisualizer.com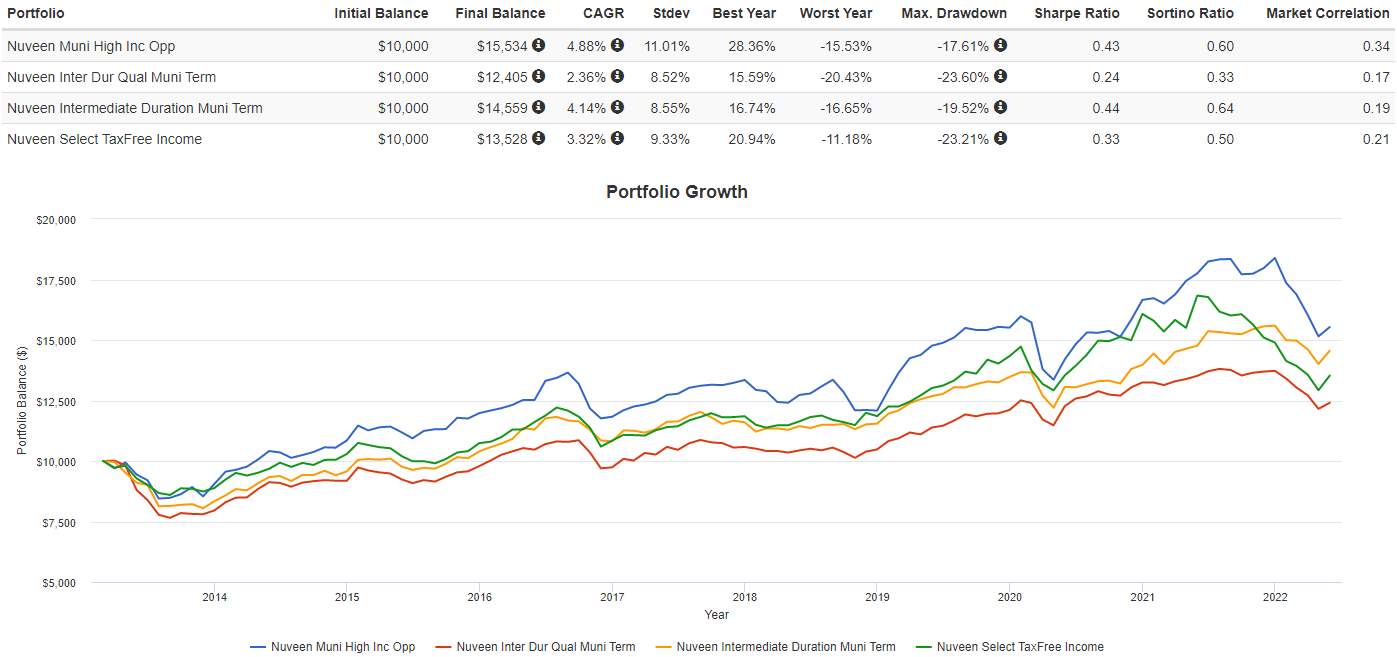
NXP is the only one used without leverage, but that doesn’t seem to have reduced the volatility investors experienced with that CEF compared to the others. The HY CEF, NMZ, provided the best CAGR, with risk ratios near the best set, held by NID.
While some of the other municipal bond strategies appear better choices, amongst the three Investment-Grade, Non-Leverage CEFs, NXP is the best.
Portfolio Strategy
For investors in states with high personal income taxes (CA, NY, NJ, etc.), you should first look at bond funds that focus on your home state. Nuveen offers such funds for the above states plus several others. Depending on how much after-tax income is your goal versus after-tax total return, you should look at taxable muni-bond options like the Nuveen Taxable Municipal Income Fund (NBB) to stay within the muni-bond sector or one of many corporate or US Government bond funds available. Here is how three other Nuveen CEFs compare to NXP since 2014.
PortfolioVisualizer.com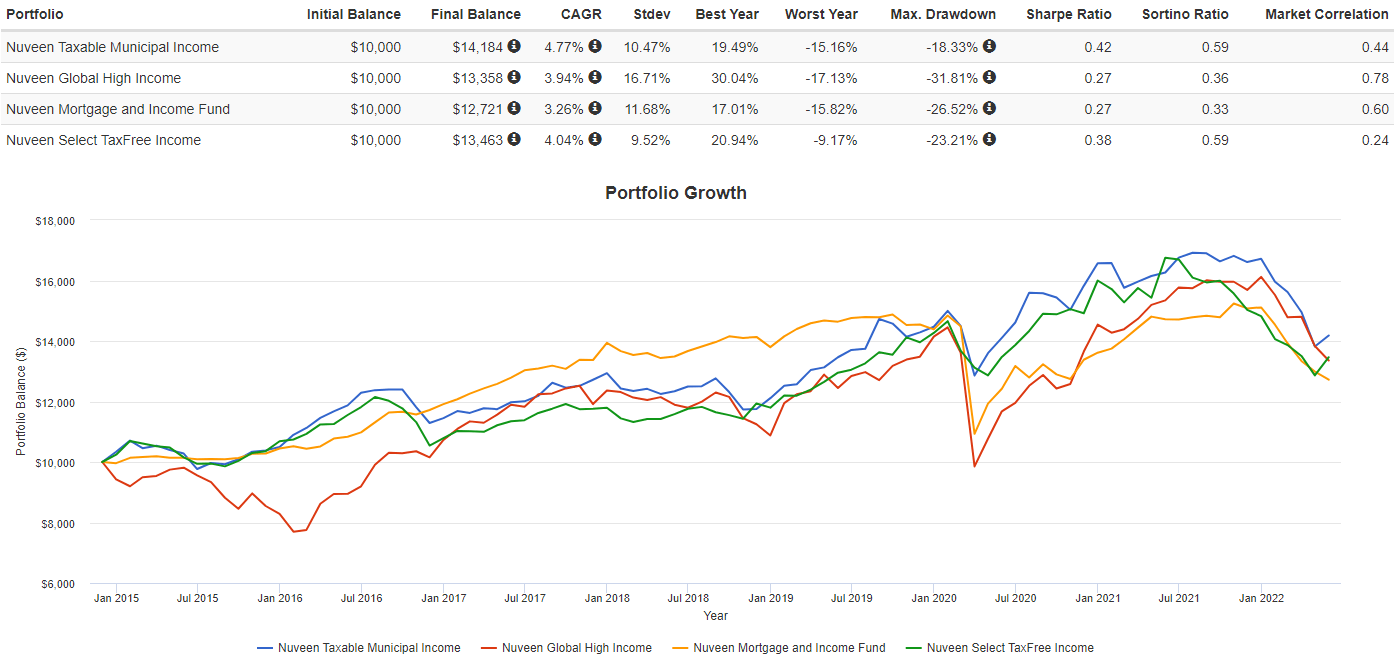
Be the first to comment