

belekekin/iStock via Getty Images
Investment summary
Sector-tailwinds are building for NuVasive, Inc. (NASDAQ:NUVA). However, its investment debate is plagued by uncertainty from future valuation and its ability to further penetrate the spinal market. Figures came in strong last earnings season, underscored by strength in its emerging segments, but we’re seeking above-market growth in an otherwise fairly stagnant spinal sector.
Exhibit 1. NUVA 12-month price action
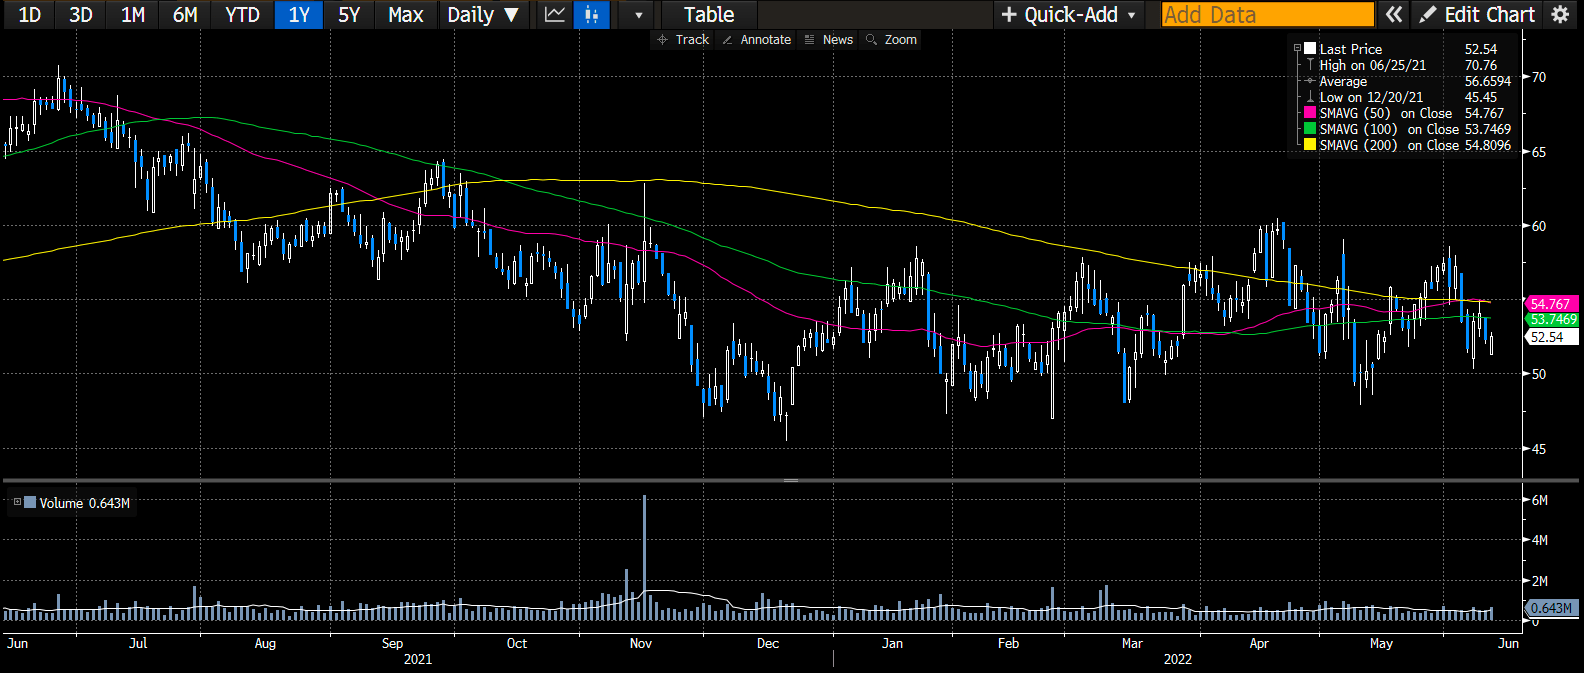
Data & Image: Bloomberg
However, our modelling implies a period of below market growth into the coming years, unless there’s further pull through from its Pulse and Simplify segments. Hospital patient trends have now more than normalised, and it’s time for the company to deliver on a myriad of factors to secure the upside debate. Valuation also dampens the case as we price NUVA at $49–$53 on a composite of 5 valuation inputs implying little upside to be harvested in the medium term. Technical studies add further evidence to the neutral stance.
Q1 performance indicative of industry tailwinds
Q1 sales were strong with turnover up 9% YoY driven by US spinal hardware, posting $156 million to the top line. It saw a 7% growth YoY. Management pointed to improved volumes towards the back end of the quarter, in line with independent data. National hospital discharges grew 18% month on month in April, ~50bps YoY. More importantly, the number of patients discharged in April grew ~14% since 2020, evidence that patient turnover trends have normalised past pre-pandemic levels. Management reckon there isn’t a patient backlog, and that we’re back at pre-Covid procedure level.
We’d note the company’s language on ‘seasonality’ of its cash flow. NUVA printed a loss in FCF of ~$27 million last filing saying Q1 is historically the free cash flow quarter of the year and typically negative. Analysis of the data reveals this statement to ring true. The company has grown FCF sequentially since 2018 albeit in a seasonal trend as management describe (Exhibit 2). These trends match the seasonality in pre-pandemic hospital trends evidenced by prior analysis. Assuming the normalisation of volume and turnover trends shown above, the data suggests that days in accounts receivable peaks in January at 51.3 days before trending downward throughout the remainder of the year. In the March quarter, initial denials typically spike by ~8%, “driven by benefit plan changes and higher outpatient volume from the previous quarter.” The data also shows that outpatient revenue per case is 4% below the annual average in this time.
Exhibit 2.
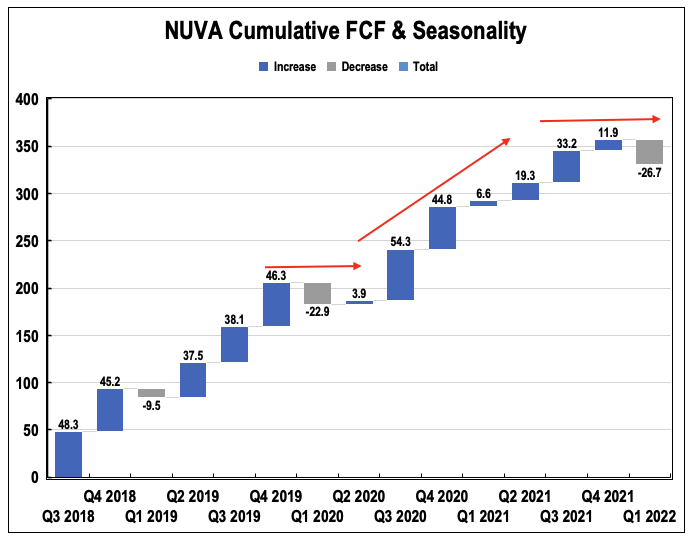
Data: NUVA FY18–22′; Image: HB Insights
Alas the company is adhering to longer-term growth trends adds to the predictability of its future cash flows. In addition, industry forecasts point to a moderate yet sustainable growth period of the coming decade, with data indicating CAGR 4.5% growth, and contrary research suggesting CAGR 5.1%, 4.6% and 5.2%. Q1 growth was underscored by a strengthening C360 segment, with the portfolio growing more than 20% YoY, with the Simplify the star performer. Management is guiding 7.5–9% at the top for FY22 calling for ~$1.2 billion whilst it also raised EPS guidance to $2.45 at the upper end, implying an above-market growth schedule. These are optimistic claims. Cash to inventory days is more than 425 days, suggesting sales are heavily sensitive to price versus volume. Once probing NUVA’s capacity to withstand cost inflation and hospital capital budgeting, another debate ensues.
Despite management’s planned optimism, our models are implying a slower period of growth for the company. We’ve modelled $1.22 billion at the top for FY22 and $1.3 in FY23 for NUVA, implying ~7% growth in both instances. We reckon it can feed ~$120 million below the bottom line in FCF in FY22. However, from there, our base scenario sees revenue growth slow to ~3% for the company YoY until FY27, until we see further uptick in the spinal sector and better execution on the placement of the Pulse system. Amid the seasonality in hospital budgeting and threat to capital allocation from Covid-19 ‘scares’, this adds a risk adjustment to forecasts. As a positive it has placed more than 500 Pulse platforms as of the previous quarter. A key differentiator is that it can be used in all spinal surgeries, being software based. There’s been a paradigm shift towards software offerings in spinal lately, particularly with software that integrates across a wide reach of applications. Pulse corroborates to this and the company has a collaboration with Siemens Healthineers to integrate the Pulse platform with its Cios Spin mobile C-arm intraoperative imaging solutions. Our upside case yields similar results in the 3-5% YoY sales growth region until FY27, adding weight to our neutral thesis.
Exhibit 3. NUVA FWD Estimates
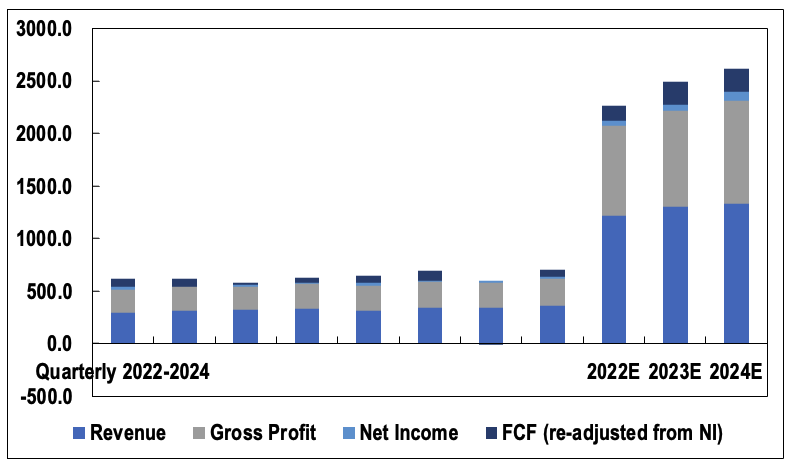
Data & Image: HB Insights
Importantly, to balance the risk/reward calculus, our modelling also shows a high degree of forward earnings leverage, whereby EPS and FCF are poised to grow at faster multiples than the top line. We’ve modelled an average 37.1% YoY growth schedule to EPS into FY26 and normalised 15% YoY FCF growth into the same period. Adding weight to this data is that gross margins have remained top heavy at above 71% in the last 3 years, and we model a ~300bps decompression to gross margins from FY22–FY26 to 74%. R&D margins have also remained fairly constant these past 2 years dancing at ~21–25% of turnover, whilst operating margins have tightened from the pull-through of a spike in operating costs from Q4FY21. Operating costs are $841 million on a TTM.
Valuation
Shares are trading at 21.5x our forward EPS estimates and command more than 3x book value. It also trades on a 4-year normalised 144x P/E and 4-year average 35x FCF. It’s currently priced at 71x FCF, however, noting the seasonality of its FCF curve. NUVA’s also grown its book value per share by around 4.6% geometrically over the past 5 years to date, well behind the S&P 500’s 5-year annualised return. However, BV/share is reasonably high at $15.63 on TTM basis.
Exhibit 4. Comps & Multiples
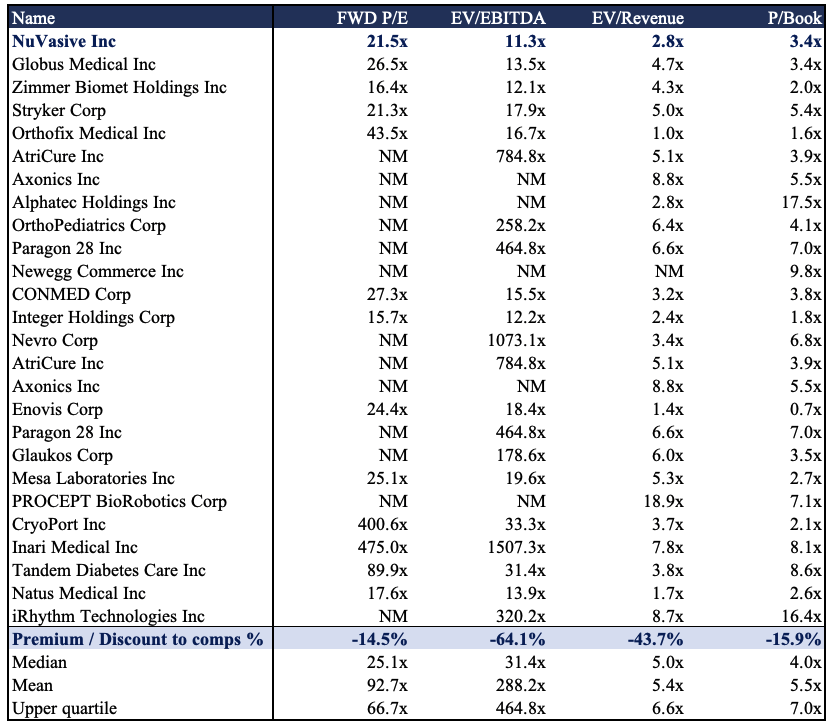
Data & Image: HB Insights
It trades to an average 34% discount to its GICS Industry peer median across key multiples, and one might wonder if the discount is justified at this point. Research outlined above suggests an average 4.85% CAGR industry growth into the coming decade, whereas we’ve modelled 3.9% for NUVA into the same time, and 4.9% into FY26. However, we’ve also modelled a high degree of earnings leverage and free cash conversion into the same period. Nevertheless, discounting this unrealised FCF value to today’s terms at 12.5% (opportunity cost of holding the SPX + current yield on long-dated treasuries) sees us value NUVA at $53 per share, offering little to no upside potential on that basis. Moreover, it trades at 35x FCF, a figure that needs adjusting. NUVA trades at a rough 34% discount to the peer group, and adjusting the 35x by that amount sees us value NUVA at 21.12x FY22 FCF or $51/share.
Exhibit 5. DCF Summary
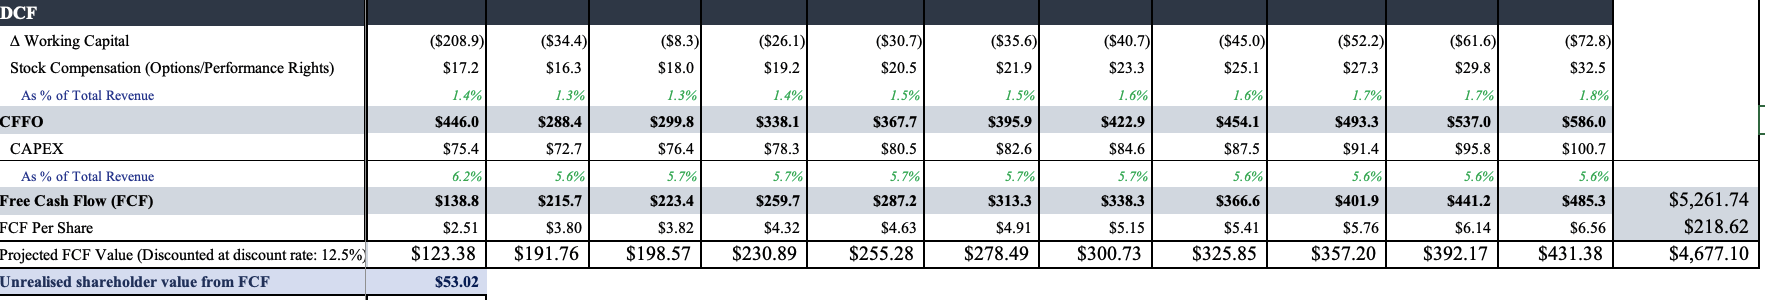
Data & Image: HB Insights
Moreover, it trades at 21.5x our forward EPS estimates of $2.31, suggesting a price objective of $49, and assigning this to our FY23 basic EPS target of $2.61 and discounting this back at 12.5% as above sets a price target of $49.80. These figures are corroborated by the spread of price targets identified via point and figure (“P&F”) charting with daily charts suggesting multiple downside targets from $42–$46. On a weekly chart multiple downside targets in the $50s have already been met as a bearish confirmation and these downside targets can now be taken more seriously. P&F charting gives us critical insight into price action and market psychology around the stock for more near-term directional observations.
Exhibit 7. Multiple downside targets
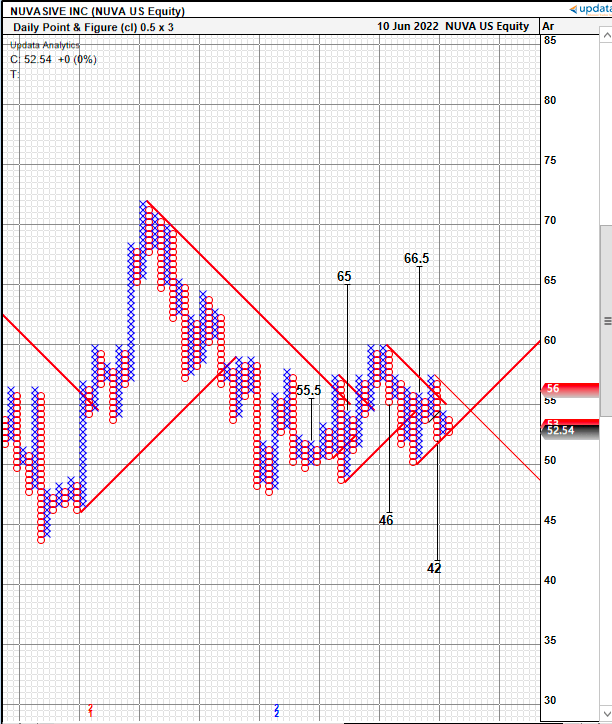
Data & Image: Updata Analytics
Forming a composite of these 5 valuation inputs on an equal weighted basis sets a price objective of $49 for NUVA, with a valuation range of $42–53, suggesting it is more than fairly priced at its current levels.
Technical studies
Shares are trading below cloud support having tested that level over the past few weeks. There is medium-term support rising from December however shares recently tested and failed a key resistance level at the ~$58 mark having failed at that approximate level three times from Dec-date. The stock is currently rangebound although trend indicators signal there are buyers at these levels.
Exhibit 6. Trading towards key support levels
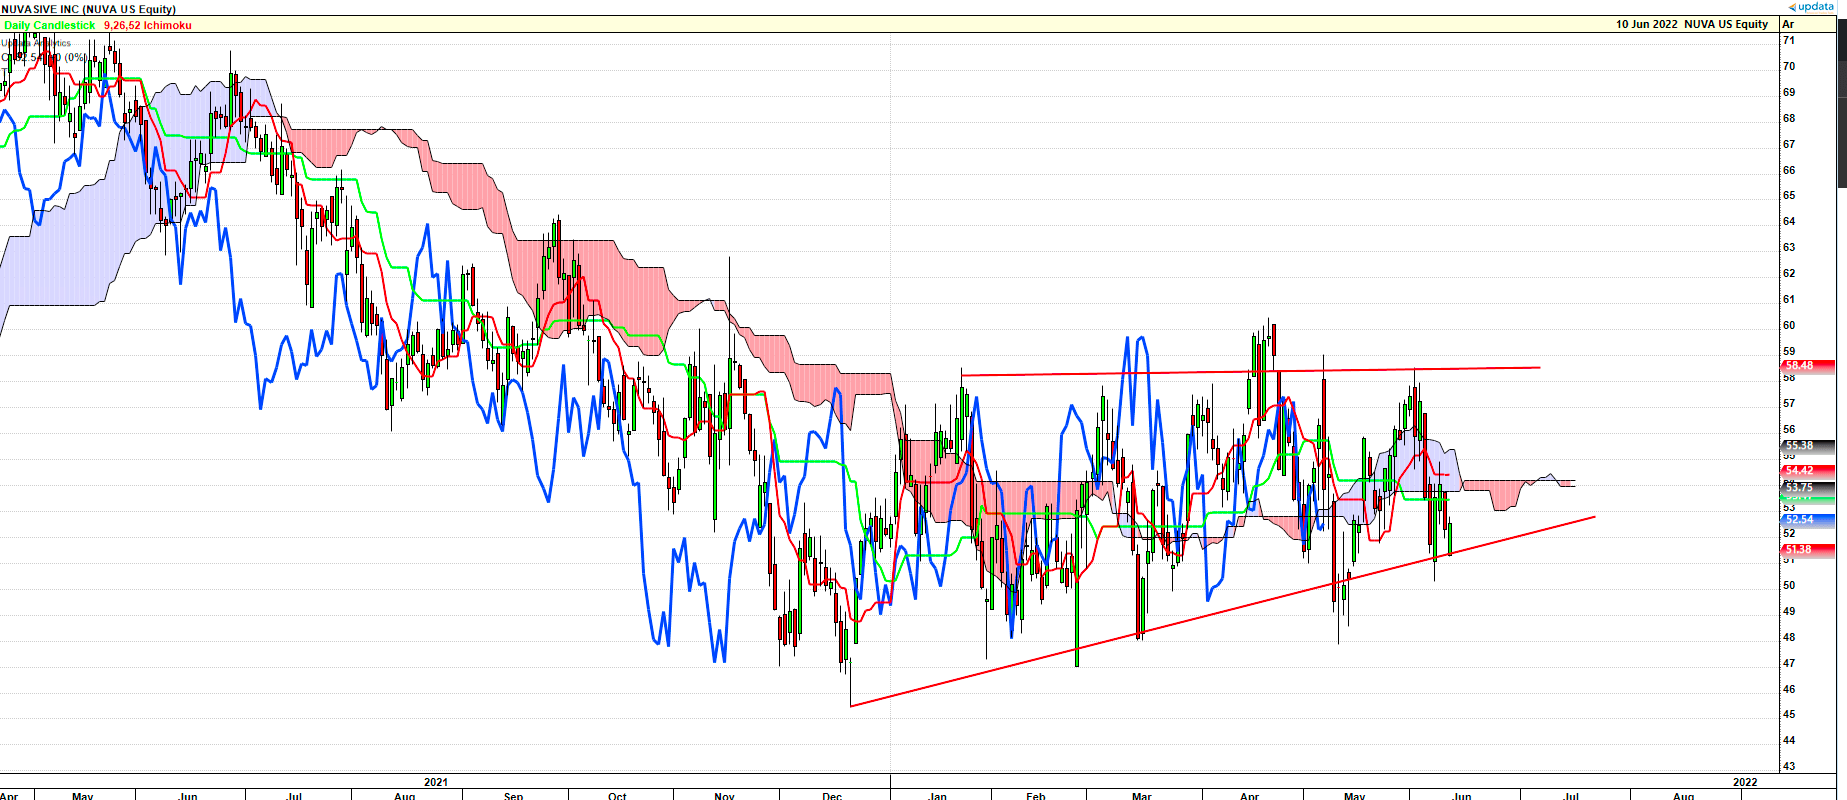
Trading below cloud support (Data & Image: Updata Analytics)
Exhibit 7. Trend indicators show buyers at multiple levels
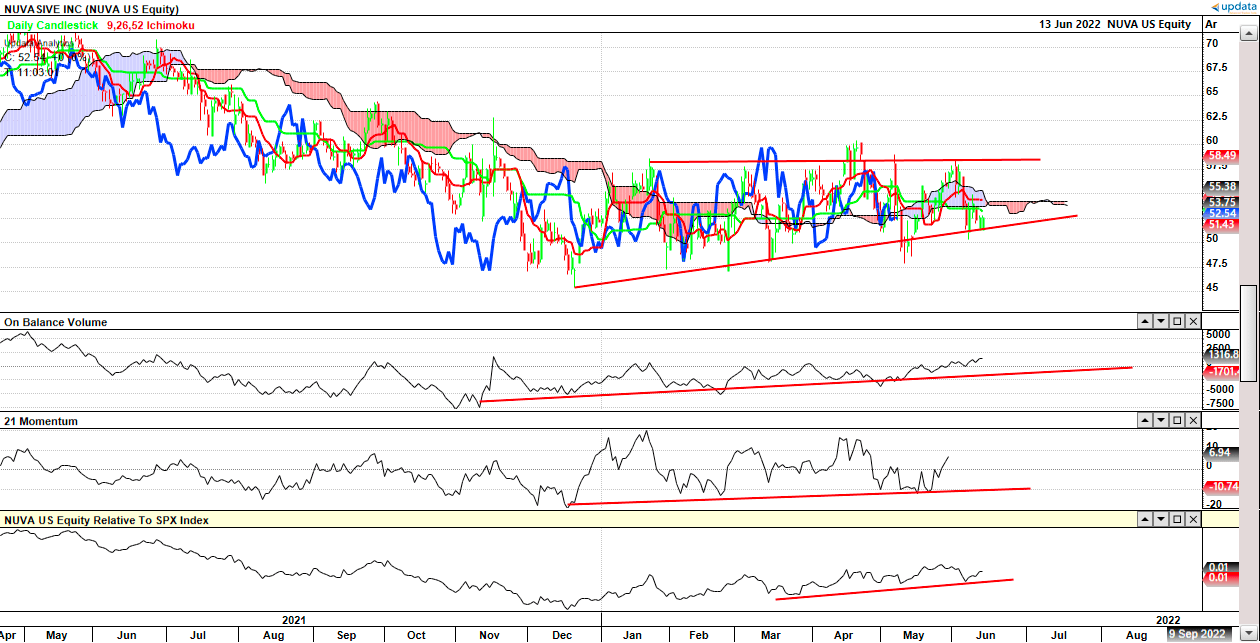
Data & Image: Updata Analytics
On balance volume (“OBV”) have curled up gently since November last year just as the stock found a bottom and begun its reversal. OBV has since continued up and is trending alongside the NUVA share price. Moreover, momentum has followed suit albeit in wide volatility. NUVA has also regained near-term strength against the SPX since March in continuation with the aforementioned trends. However, given the confluence is weak between all three, we feel these aren’t bullish factors but rather a softening of bearish sentiment.
In Short
After pricing NUVA at $49–$53 per share, it’s not unreasonable to think the market has it discounted correctly. There’s management’s optimism in forward sales, and a degree of earnings leverage to go buy, backed by robust free cash conversion. However, we’ve modelled a slowdown for the company in our base case, unless we see more momentum in its emerging segments. Sales have shown reasonable growth but in absolute terms need more build out, by estimation. Without the flesh to place on the skeleton, there’s a lack of identifiable upside drivers to ratchet the stock north in the medium term, by estimate. Rate neutral on these grounds.
Be the first to comment