

tattywelshie/E+ via Getty Images
On Friday, the latest installment of the non-farm payroll report was released. The report showed that the U.S. economy added 431,000 jobs for the month, which is an impressive number when you think about it. Unemployment soared during the pandemic, leaving a lot of ground to cover, but payrolls are approaching the level they were at before the pandemic. In this article, we’ll look at what this means, as well as what some other popular economic indicators say about the market, particularly the yield curve.
What Are Non-Farm Payrolls and Why Do They Matter?
The monthly non-farm payroll report measures the change in jobs each month. It’s typically released on the first Friday of each month. The payroll report is taken by surveying more than 100,000 businesses and government agencies for whether they’re adding or reducing jobs. As the name implies, the non-farm payrolls report doesn’t include those employed on farms, but it’s also good to know that it doesn’t count those who are self employed. Non-farm payrolls are a useful, broad gauge to see how the economy is doing as it predicts consumer demand for the ~80% of the workforce that it covers.
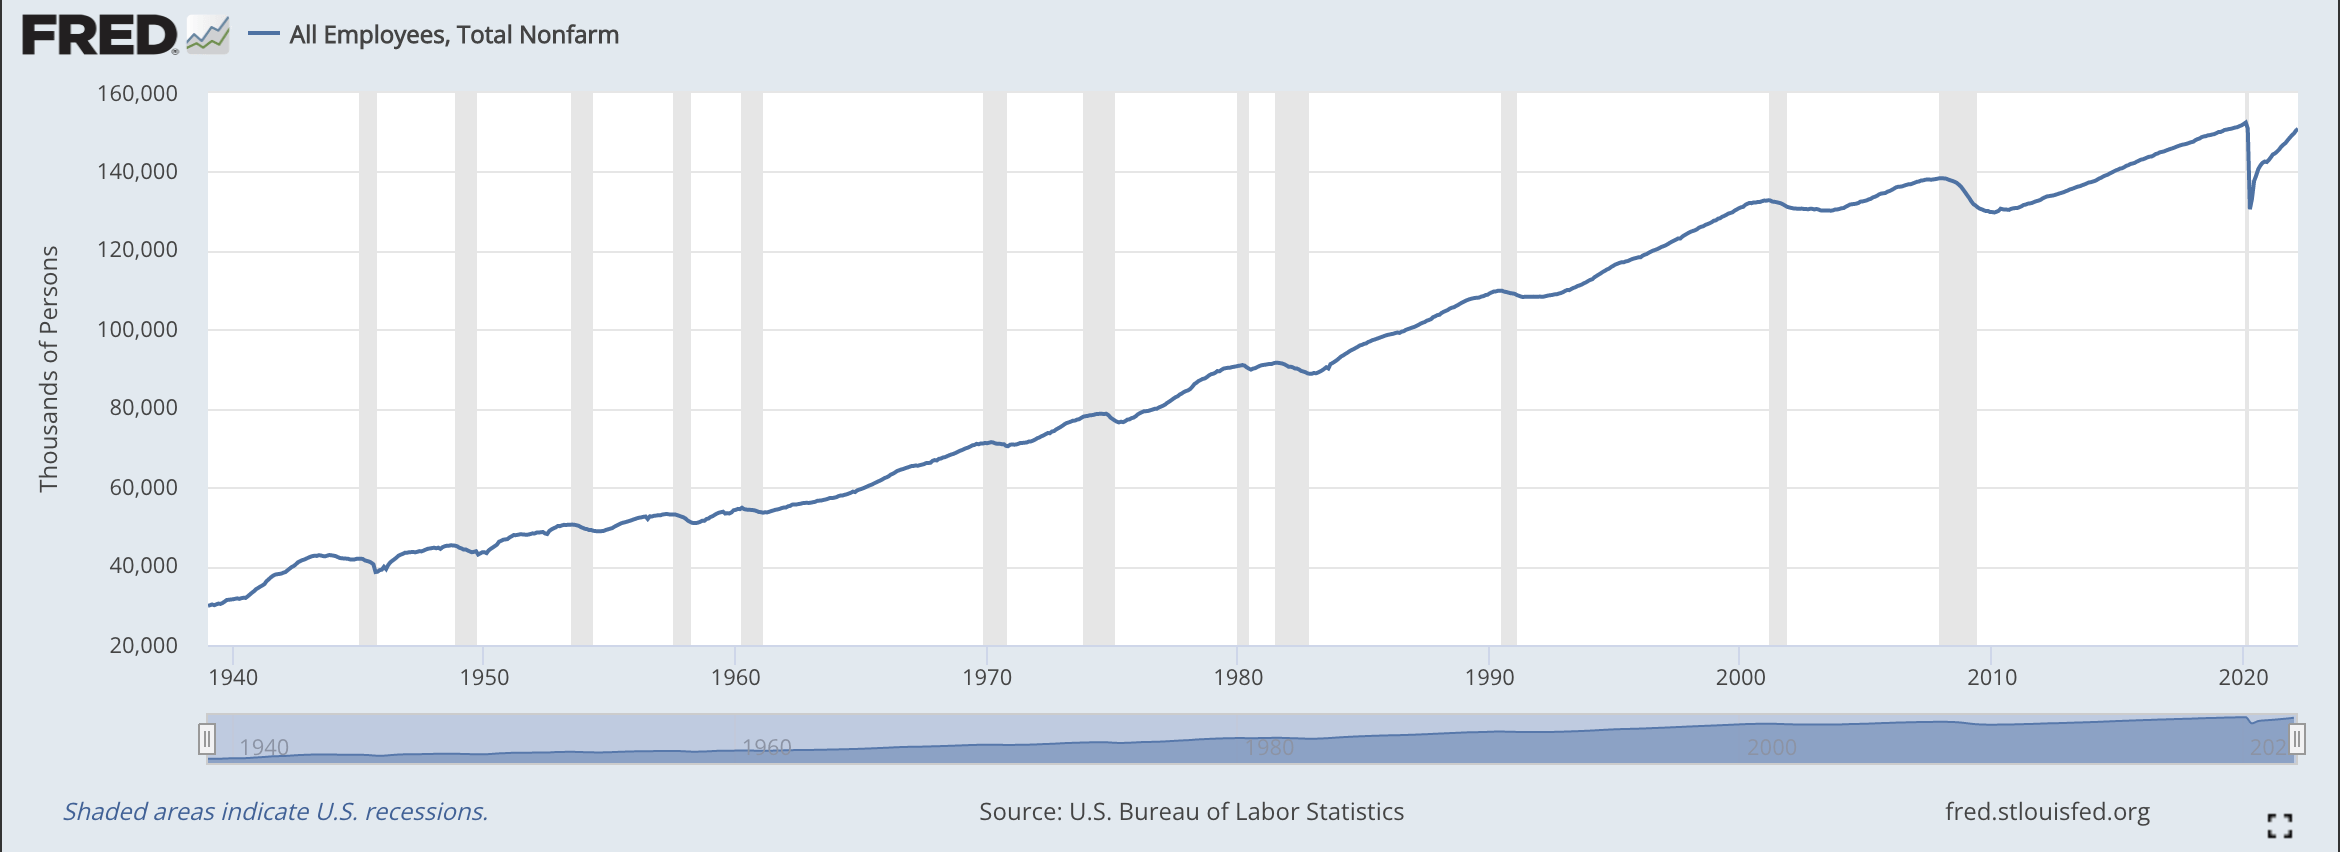
Total Payrolls (FRED)
This report showed another month of rapid job gains, but with the unemployment rate at 3.6%, the shrinking pool of unemployed workers to hire means that payroll growth is likely to slow down from here. If you look just at the unemployment rate, the economy is back to where it was in February 2020 before this whole mess started. If you look at labor force participation, we’re only about 70% back.
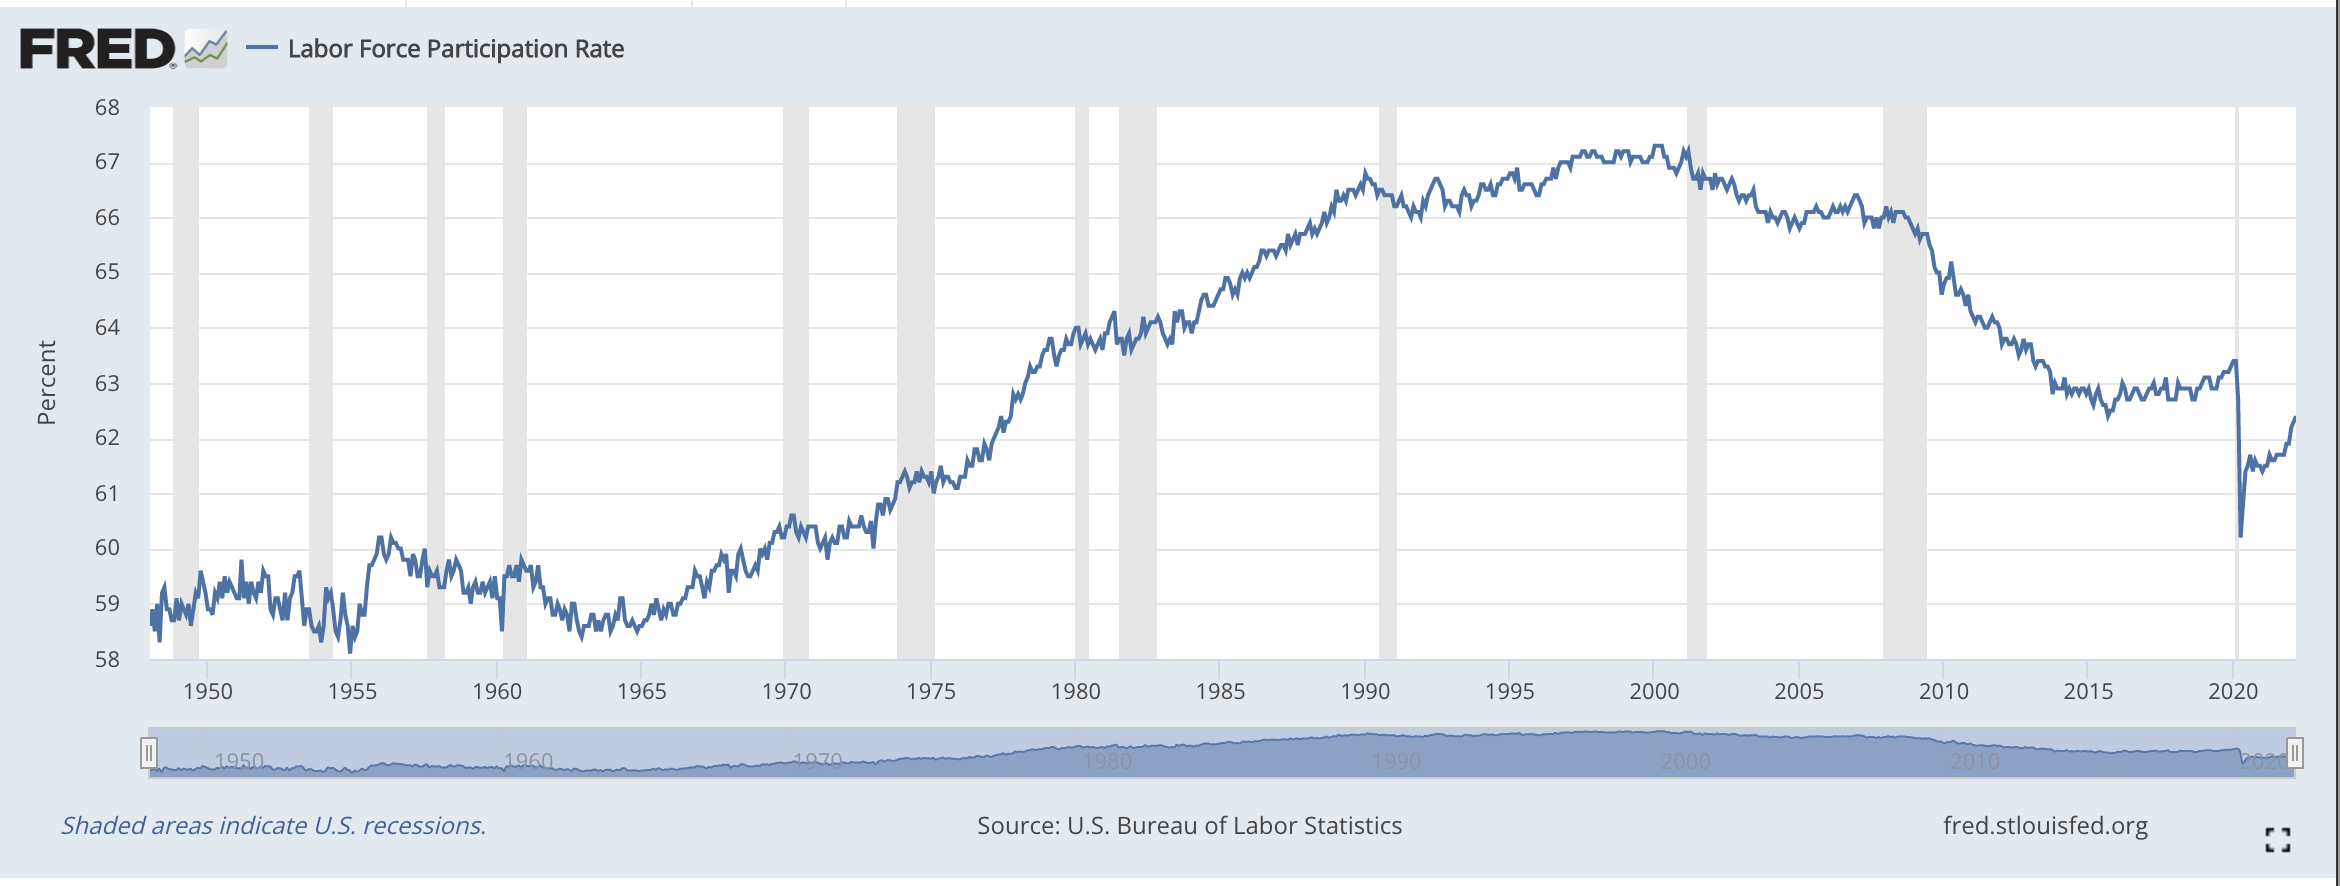
Labor Force Participation Rate (FRED)
You can see from the graph that labor force participation has been generally going down over the past 20-25 years. It’s natural to wonder if this is because there are more retired people and the population is getting older. But when you look at data that compares the same age groups, labor force participation by 65+ year-olds is skyrocketing, while participation by prime-working age people is steadily dropping (it’s not clear how the pandemic affected this, but the trend for most things affected by the pandemic has been to revert to the mean as the virus has calmed). I’d say the most underappreciated reason this is so is because of the shocking increases in drug and alcohol abuse in the U.S, leading to record numbers of overdoses and indirect effects from people not working. Maybe there are other trends in play like increasing minimum wage laws and the rise of cashierless checkout, but the implications for the broader economy from these are mixed.
The Fed also watches non-farm payrolls closely as well, as part of its dual mandate to provide full employment and stable prices for the American public. There’s classically a trade-off between inflation and unemployment that’s known as the Phillips Curve. The idea was that the Fed could tighten policy and accept more unemployment, or could loosen policy and get more inflation but lower unemployment. This is generally true, but the relationship was shattered in the 1970s when inflation and unemployment both rose simultaneously, taking the stock market down the tubes with it. The late Milton Freidman believed that the only reason the Phillips Curve worked in the short run is that companies could fool workers into accepting lower wages by raising pay slower than inflation (like has happened thus far in 2021 and 2022). Freidman’s argument was that in the end, what happens when policymakers try to spur inflation to decrease unemployment is that it works in the short run but leads to stagflation in the long run. The mainstream media is writing about the “Great Resignation,” but what’s happening is really just a natural consequence of wages not keeping pace with inflation.
This is how you get an economy that appears healthy, but really isn’t as inflation-adjusted earnings for households fall and there are shortages of necessary goods like housing and cars. This is also why consumer confidence is near 2008-recession levels–most people are poorer than they were pre-pandemic in terms of their purchasing power! Companies have had record profits while consumers are getting poorer in inflation-adjusted returns, and without the government pumping stimulus checks in to fill the gap, I believe the record profits are likely to reverse as the economy comes back into balance.
Economic Takeaways From Non-Farm Payrolls
- The employment market has mostly recovered from the pandemic and should continue to do so.
- Inflation is way too high, meaning the Fed needs to tighten quickly to avoid stagflation.
- The economy overall is not functioning very well right now due to the overhang of too much stimulus and supply chain issues, but the free market is working to bring in additional supply for goods that have rapidly increased in price, such as housing and cars.
- Fed tightening by itself is likely to cap the upside for stocks and bonds and at the very least lead to a slower, more balanced economy.
- However, the real problem for stocks isn’t a recession but unrealistic expectations for what stimulus can do for the economy and stock market (i.e. S&P 500 earnings), as was warned about by Milton Freidman and other economists.
What About The Yield Curve?
Here’s where things get interesting. The economy appears healthy right now by most accounts, even though some leading economic indicators are indicating trouble. But the crystal ball of the yield curve has flashed a widely known recession indicator–the dreaded yield curve inversion. Of course, the Fed’s balance sheet is so large at this point that they could probably make the yield curve do whatever they want by buying or selling trillions of dollars in bonds.
To this point, the yield curve is a mess right now.
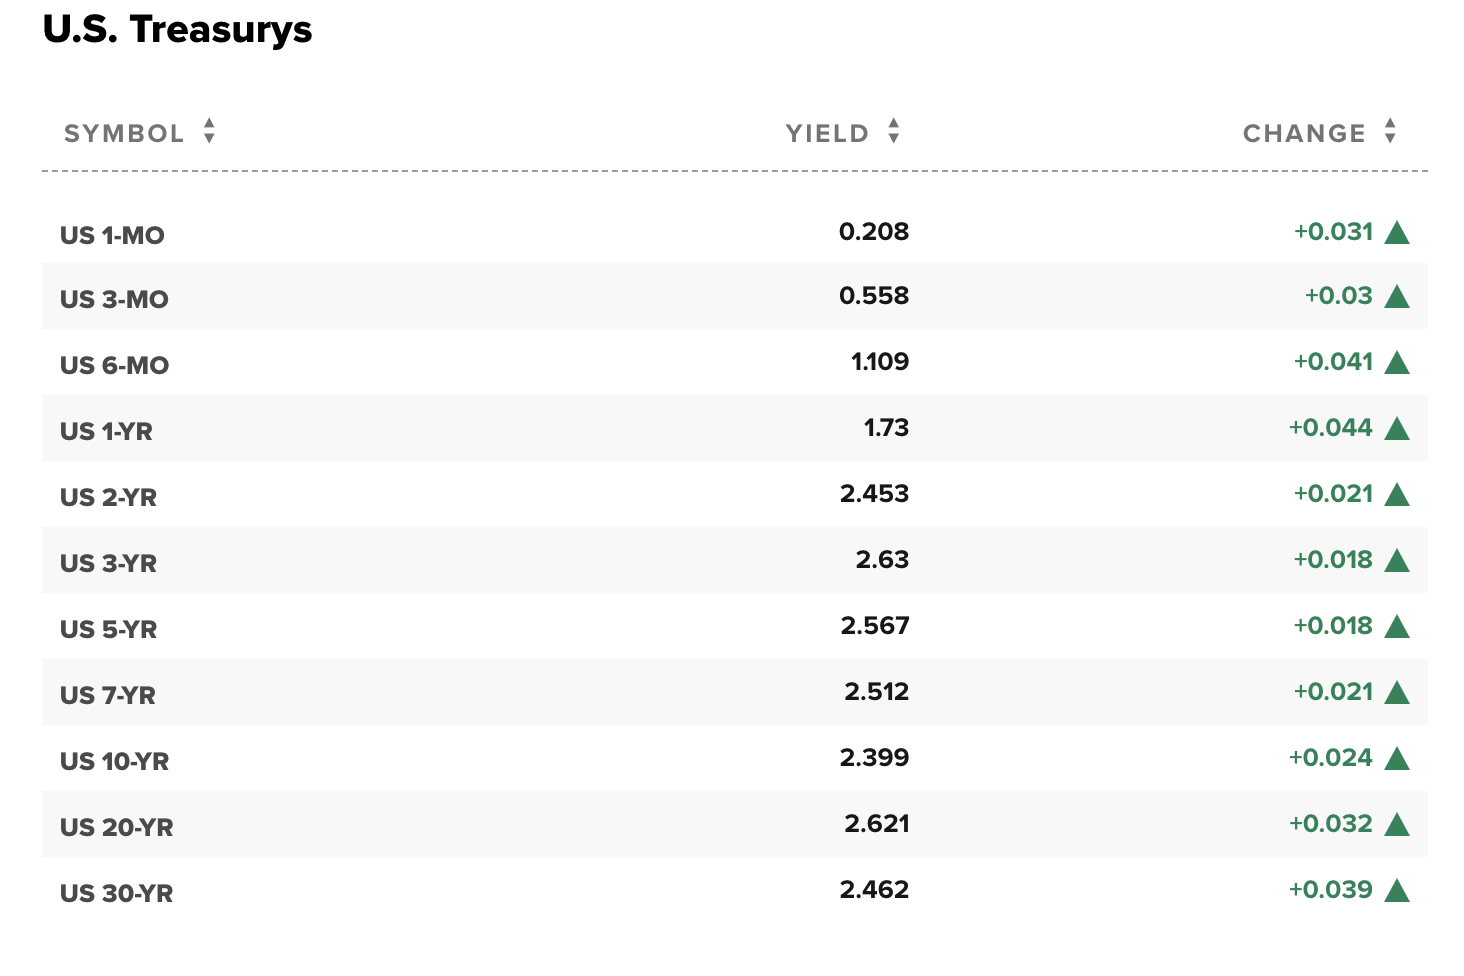
The Current Yield Curve (CNBC)
Notes on the yield curve:
- Cash rates are low but are expected to quickly rise, as you can see from the one-year rate being about 1.75%. For what it’s worth, I think this is still probably not enough compensation for how much the Fed will hike.
- The two-year Treasury yields more than the 10-year, which is a classic yield curve inversion that has typically forecasted a recession within the next year or so.
- The shape of the yield curve is messed up and likely will revert to the mean. Bond buyers tend to be very constrained and don’t have the flexibility to shop around on the yield curve because they’re matching assets to liabilities or are mandated to buy certain maturities of bonds. You don’t necessarily have this constraint, so you can think about where you want to be on the yield curve.
- The U.S. Treasury plays a role in this as well– if 30-year bonds are yielding less than 20-year bonds or 5-year bonds, then they can increase how much they sell to meet demand and get cheaper financing for the government.
I don’t quite know what to make of the yield curve at the moment. The Fed has done a massive amount of QE, and at various points in U.S. history the yield curve has been heavily manipulated by the Fed. When this happens, it inevitably leads to shortages (similar to what occurred during the WW2 period, or now) or busts (like the S&L crisis). For these reasons, I don’t know if the yield curve indicates a true recession signal or rather simply that growth and/or inflation will be higher over the next two years than they will be over 10 years. For risk assets the picture is clearer– it means trouble.
Bottom Line For Markets
Non-farm payrolls put in big gains for March while consumer confidence and the yield curve flashed recession signals. For the economy, I believe this is part of the healing process as government support is removed and the market begins to supply demand. For example, the US is building close to 2 million homes this year without any corresponding population growth. Will this lead to a big correction in home prices as consumers can’t rely on stimulus anymore to get money and rates rise? I would guess so. But in the long run, there are worse things for the economy than having some extra housing stock.
The story isn’t so different in the stock market. I could see a scenario here where earnings and stock prices drop back to sustainable levels, leading to a 20%-30% bear market in stock prices (i.e. back to February 2020 prices) without a corresponding rush of job losses. The problem here is not necessarily with the Fed raising rates or a yield curve inversion, but in the unrealistic expectations for demand/profits in the long run based on massive stimulus and a brief but powerful bull market.
For these reasons, the stock market is likely to have to continue to correct to come back in line with economic fundamentals. April is earnings season and earnings expectations don’t make much sense to me. Before it starts, I would take the time as an investor to take profits and rid your portfolio of unrealistically priced stocks.
Be the first to comment