

SPACs aren’t the ones going to the moon. Inverse ETF SOGO is. Vertigo3d/E+ via Getty Images
Investment Thesis
The SPAC process contains several pitfalls that are often hidden from view until after merger completion, resulting in dismal returns from which many will never recover. By tracking the inverse performance of post-SPAC companies, the Short De-SPAC ETF (NASDAQ:SOGU) allows you to profit from this phenomenon.
SPACs generate a lot of hype. But the companies they merge with are often ill-prepared for the demands of a publicly traded company even while receiving far less capital than anticipated, leaving them worse off than before.
Meanwhile, misleading projections, share dilution, and conflicts of interest leave investors holding the bag. Add on additional SEC regulations and probability of shareholder lawsuits, together with rampant inflation and recession concerns, and you have a real disaster on your hands.
Academic studies have shown that post-SPAC scars are permanent. A 2016 study showed that 58% of 105 SPACs completed during 2003-2013 “failed” (were no longer listed). Because companies that have gone public via SPAC recently are likely to suffer a similar fate, I rate SOGU a Strong Buy.
SOGU is the #1 ETF of 2022
SOGU has returned 117% through June, making it the #1 highest performing unleveraged ETF so far this year (even #3 including all 2x and 3x ETFs!). It even outpaces the 68% YTD return of its better-known sibling Tuttle Capital Short Innovation ETF (SARK) which I profiled recently, and that ranks #3 among unleveraged ETFs. (The United States Gasoline ETF (UGA) took the #2 spot.)
I own shares of SOGU and have been surprised at the lack of coverage for this ETF, especially given it’s #1 ranking so far this year. Thus, an in-depth analysis is in order.
Because SOGU tracks the inverse performance of an index of companies that have gone public recently via SPAC merger, we’ll start first by discussing what SPACs are and why they’ve become popular; the horrendous returns of companies after completing their SPAC merger; why that is and why it will likely continue. Then we’ll look at the De-SPAC Index that SOGU tracks (on an inverse basis). Finally, we’ll take a closer look at SOGU itself, including both its risks and phenomenal performance.
Quick Primer on SPACs
MSCI ESG Research LLC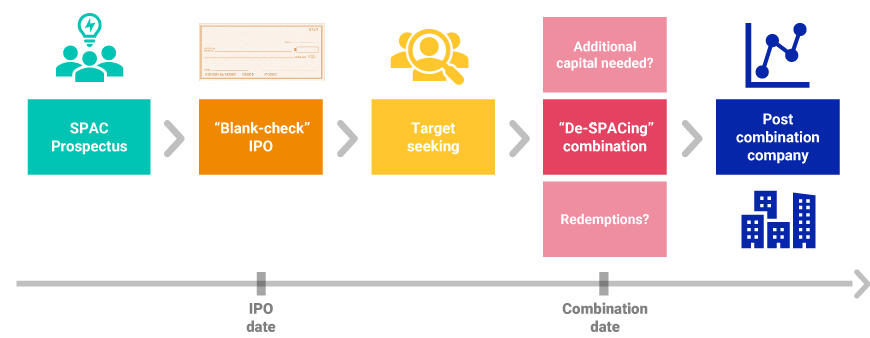
A Special Purpose Acquisition Company (or SPAC for short) is first formed when a group of experienced investors use an IPO to launch a company whose sole purpose is to target and acquire a privately-owned company. SPACs are often referred to as a “shell company” or “blank check company” because they don’t have any significant business operations of their own, and because investors are placing money without knowing what company will be acquired (though they do vote on whether to approve the merger, once a target company has been identified).
Upon merger approval, the SPAC company combines with the company it acquired/merged with and takes on the name of the target company, thus completing the de-SPACing process. Post-SPAC the ticker symbol will change as well, from that of the SPAC itself to one that conforms to the acquired company. Because the acquired company is the one that survives, SPACs are also correctly referred to as a “reverse merger.”
Bloomberg Law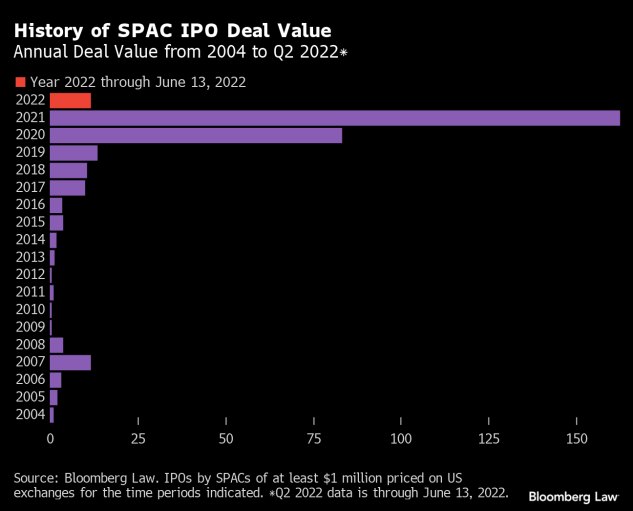
Going public via SPAC merger (instead of the traditional IPO process) has exploded in recent years. However, since the onset of the pandemic-amid unprecedented Fed intervention via QE, stimulus checks and a surge in retail interest and frenzy in ‘meme stocks’-the number of SPACs has exploded.
While there are various theories and explanations for the explosion in SPAC deal volume and gross proceeds, the principle of Occam’s Razor (the simplest explanation is the most plausible) suggests it’s near-perfect correlation to monetary inflation suggests it was just part of the speculation that happens when there’s too much money in an economy.
FRED, SPACinsider.com
FRED, SPACInsider.com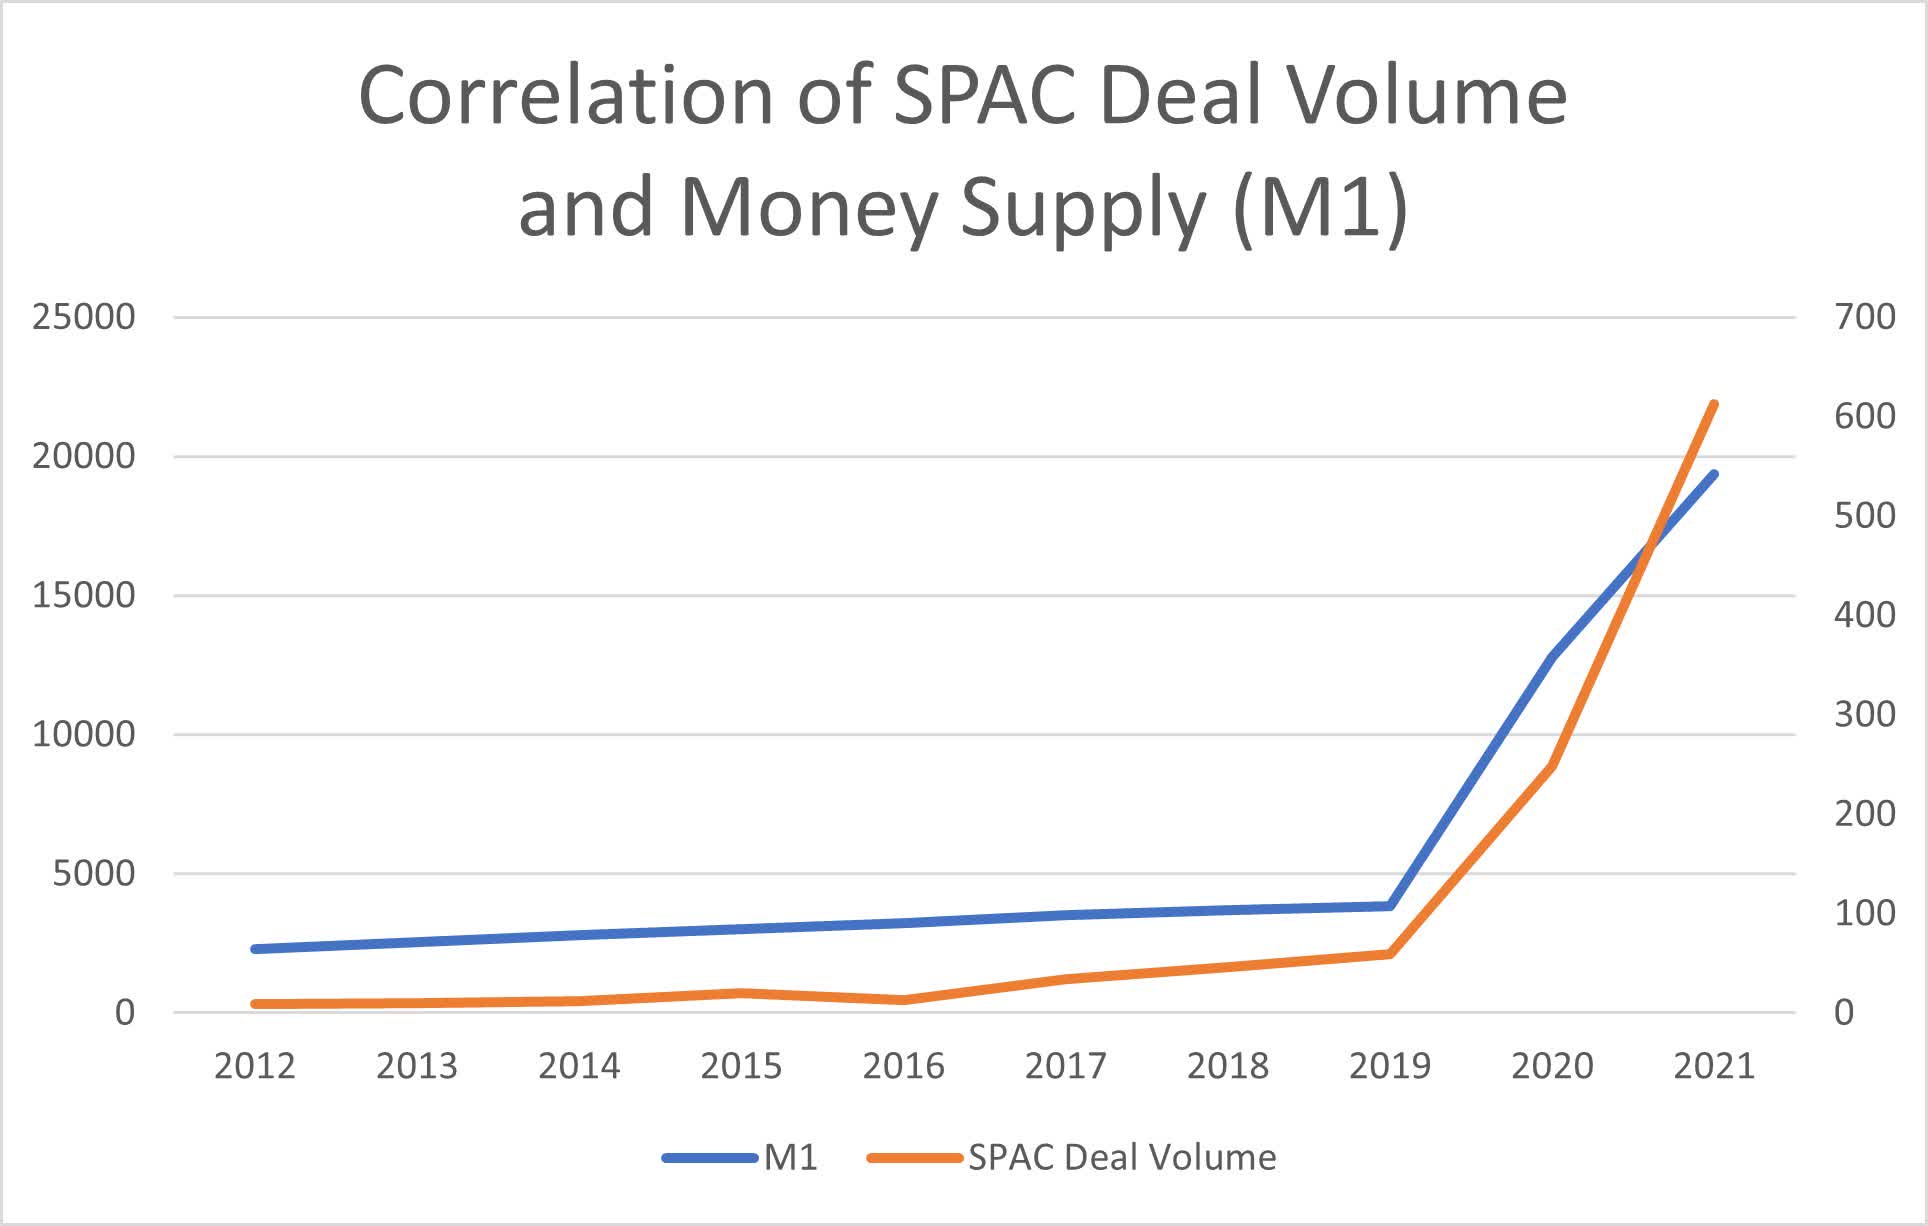
Yet even during the peak frenzy period of late 2020, amid ultra-low interest rates, a boom in speculative stocks (when the ARK Innovation ETF (ARKK) soared 156%), COVID vaccines on the horizon and inflation living only in the memory of decades past, the Harvard Law School Forum on Corporate Governance was already encouraging us to take “A Sober Look at SPACs.”
Post-SPAC Returns Are Horrendous
Check out the dismal post-merger performance of de-SPACs during the go-go times of late 2020.
Harvard Law School Forum on Corporate Governance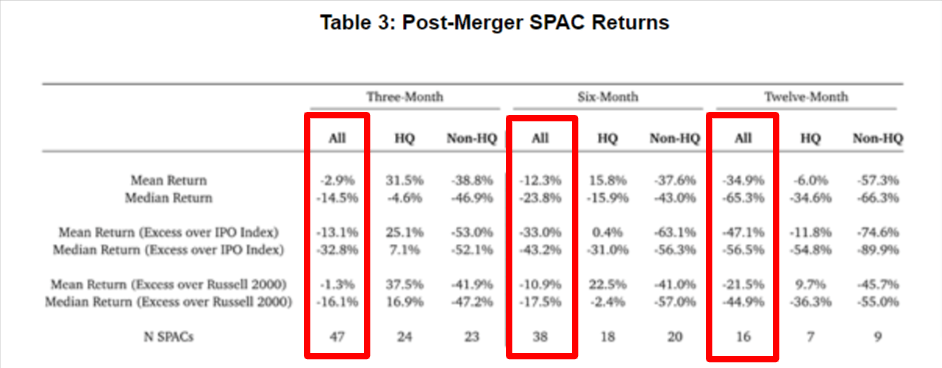
In case you missed it, as of November 2020 median returns were -14.5% in the three months after “de-SPACing,” -23.8% six months later, and -65.3% twelve months later.
Except for a brief but pronounced bubble between Dec 2020 and Feb 2021 (coinciding with meme-stock-mania) de-SPAC performance in 2021 was no better.
CNBC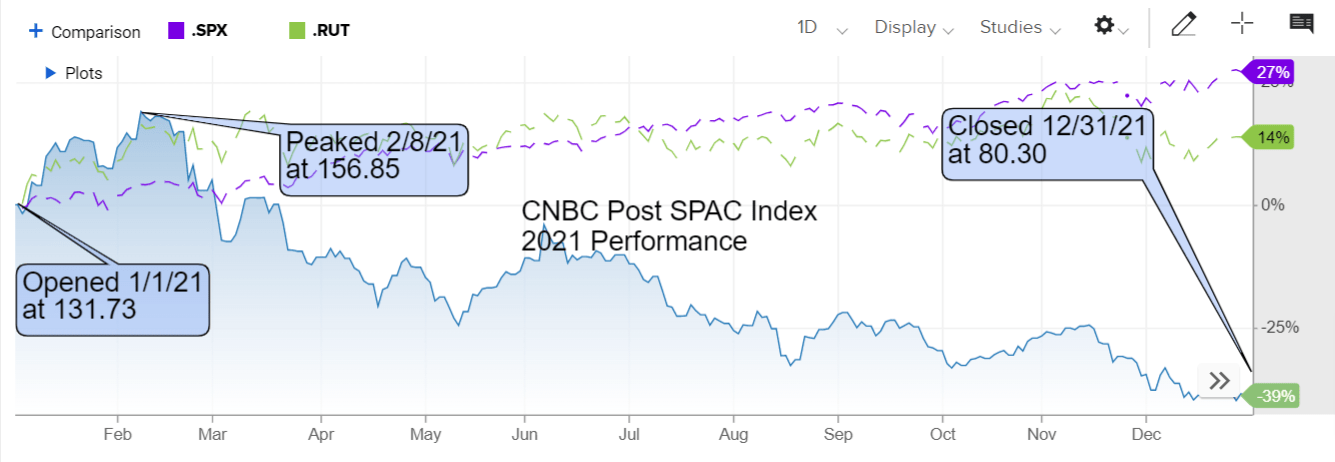
With the optimism of the “reopening trade” in full force throughout 2021, the Russell 2000 went up 14% and the S&P 500 shot up 27% for the year. As hard as it was to lose money in 2021, de-SPACs did. CNBC’s proprietary SPAC Post Deal Index dropped 39%. That’s a -53% underperformance compared to the Russell 2000, and an unbelievable -66% underperformance compared to the S&P 500.
Why is Post-SPAC Performance so Bad?
The Harvard Law School Forum’s Sober Look at SPACs says “the primary source of SPACs’ high cost and poor post-merger performance is dilution built into the circuitous two-year route they take to bringing a company public.”
A similar look into the legal aspects of the SPAC process by the Bloomberg Law Center shows an entire table of problems:
Bloomberg Law Center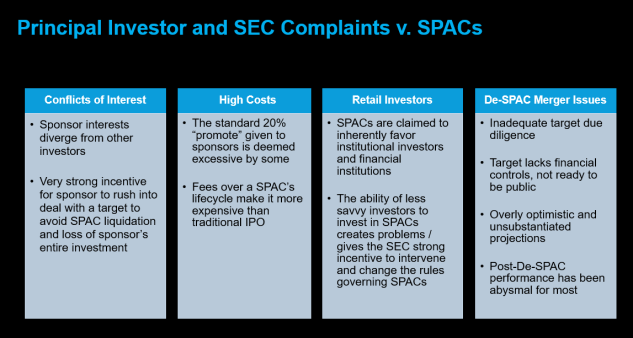
Bloomberg Law Center categorizes the four areas of concerns as follows:
First, conflicts of interest can arise when the interests of the SPAC’s sponsors and management are at odds with other investors. Second, fees and other costs in SPAC transactions and advisory matters are high, yet often opaque. Third, retail investors get short shrift compared to sponsors and large investors. Last, many de-SPAC merger transactions have significant due diligence, disclosure, accuracy, and post-merger performance issues.
For more on problems with SPACs, there are several good analyses, including one in an April 7 Bloomberg Opinion piece, and an April 2021 statement by then Acting Director of the SEC’s Division of Corporation Finance John Coates.
..And Then Came 2022
2022 brought three more -ions:
- Inflation: No longer considered ‘transitionary,’ the Fed has turned very hawkish. Interest rate increases have started (not finished), and QT is just getting underway.
- Regulation: March brought new proposed SEC rules for SPACs designed to improve disclosures and increase liability for everyone involved with the SPAC IPO and merger process.
- Recession: Amid market malaise, slumping sentiment and eroding expectations (The Agile Agent applies alliteration when able) recession is the watchword of the day.
Between the ongoing horrible performance of SPACs, plus 2022’s added woes of inflation, regulation, and recession, being a de-SPAC is almost a curse. Things can only drop so much though, right? Wrong.
Switching to Solactive’s De-SPAC Index to gauge YTD performance, we see the De-SPAC Index is down another 68% YTD 2022.
Solactive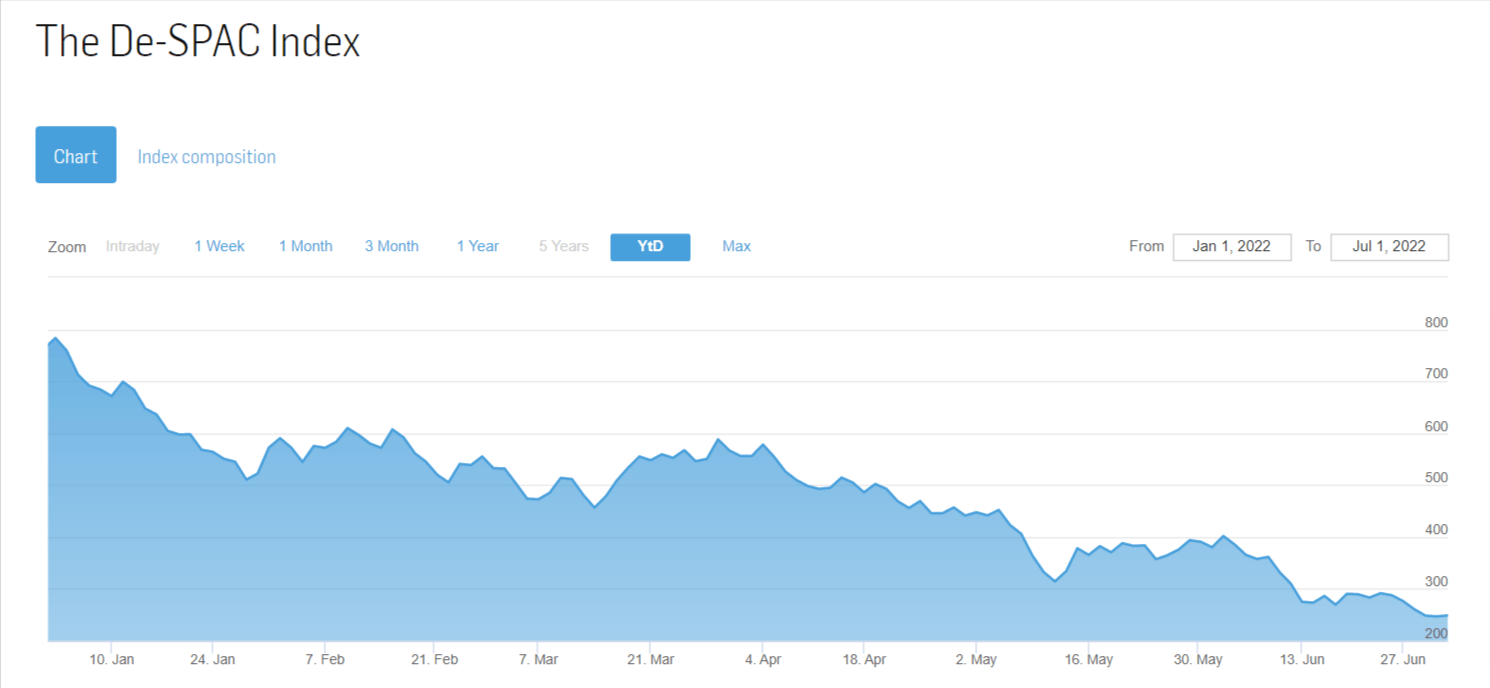
I can almost hear “buy-the-dip” traders mumbling about how it can’t go any cheaper. But that’s what they said in 2020. And in 2021. And at various points today. And they’ve been wrong every time.
In a May 12, 2022, interview on Bloomberg TV, veteran dealmaker Martin Franklin (who has sponsored six SPAC deals going back to 2006) was asked if the performance of post-SPAC companies is going to continue to get worse from here. He stressed (emphasis mine):
The reality is, we’re not finished because you’ve got a lot of companies that went public that had no business being public. They generate no cash flow, and with the collapse in their equities, the opportunity for them to raise additional capital to see out their business plans is going to be far more limited. I think there’s another round of.. revaluation that’s going to take place, and a lot of these companies are going to disappear.
So, how can savvy investors take the opposite side of the post-SPAC crash, in order to profit? With SOGU.
SOGU Tracks the “DeSPAC Index”
The Short De-SPAC ETF (SOGU), offered by advisor Tuttle Capital Management, describes itself as:
The first ETF to offer pure-play short exposure to private companies that come public as the result of a merger with a Special Purpose Acquisition Company (or SPAC). It seeks to achieve the inverse (-1x) of the daily return of The DeSPAC Index, an equally-weighted index of 25 companies that have de-SPAC’d over the past 12-months on a rolling basis.
Therefore, to understand the SOGU ETF we have to understand the index it tracks.
The DeSPAC Index
The DeSPAC Index (ticker symbol DESPACTR) is provided by The Herculoid Group and maintained by index provider Solactive. (As a less-followed index it is not found across many brokerage and stock charting platforms. Other than a Bloomberg terminal, the index listing on Solactive’s website is the best available source of info.)
Herculoid describes the rolling 12-month equal-weighted index as “a rules-based pure-play portfolio of 25 of the largest U.S.-listed companies to come public as the result of a merger with a special purpose acquisition company (SPAC).” Monthly rebalancing does the following:
- Starts with a rolling 12 month look-back period (e.g. June 2022 rebalancing considers only SPAC mergers completed May 2021 – May 2022);
- Includes only the top 25 De-SPAC (i.e. post-SPAC) companies, by market cap; then
- Assigns an equal 4% weighting to each of the top 25 holdings.
As of June 2022, the DeSPAC Index’s equal weighted index components are:
- Alight (ALIT)
- Astra Space (ASTR)
- Aurora Innovation (AUR)
- Celularity (CELU)
- Core Scientific (CORZ)
- Dave (DAVE)
- Embark Technology (EMBK)
- Ginkgo Bioworks Holdings (DNA)
- Grab Holdings (GRAB)
- Hyzon Motors (HYZN)
- IonQ (IONQ)
- Lucid Group/Lucid Motors (LCID)
- Matterport (MTTR)
- Microvast Holdings (MVST)
- Mirion Technologies (MIR)
- Navitas Semiconductor (NVTS)
- Rigetti Computing (RGTI)
- Sema4 Holdings (SMFR)
- SES AI (SES)
- Sonder Holdings (SOND)
- SoundHound AI (SOUN)
- Super Group SGHC (SGHC)
- Tritium DCFC (DCFC)
- Virgin Orbit Holdings (VORB)
- WeWork (WE)
SOGU Profile
Here’s a quick look at SOGU:
- Launch Date: May 19, 2021
- AUM: approximately $25 million as of 6/30/22
- Expense Ratio: 0.95% (though the Prospectus states fee waivers and reimbursements reduce this to 0.75% “through at least Jan 31, 2023.”)
- Average volume: 31,000
- Dividend yield: N/A
- YTD Return: 117%
- 1 Year Return: 185%
- Return Since Inception (5/19/21): 139%
SOGU Risks
As good as its results are, it’s important to understand SOGU’s risks.
Thinly Traded
Daily average volume is a mere 31,000 shares. Quieter days will see a mere 10,000 shares trade hands. The wider bid-ask spreads can significantly affect order execution prices which can make a big difference in the returns you get. (Note: I strongly recommend using Limit Orders here, to ensure your order price.) This also means the fund may trade below NAV from time to time.
Expense Ratio
At 0.75% it’s higher than passive ETFs but within the range of many active ETFs, but is anticipated to rise to 0.95% in Feb 2023 or later. I don’t take this to be excessive fee-taking by the advisor as much as the higher cost of options and swap agreements used to most closely track the daily inverse performance of an index. And of course, the astounding returns to date more than compensates.
Options Risk
Because SOGU’s objective is to return the daily inverse of the index, it cannot simply short the companies in the index (as that would return the inverse of the index over time.) Therefore, it “attempts to achieve the inverse return of the Index by purchasing option contracts on the individual securities in the Index and entering into swap agreements on the Index.” Among other things, options have greater risk because of their high use of leverage, and because time (via expiration date) is introduced as an additional factor determining price and return for options.
Swap Agreements
Swap agreements are complex investments that the Prospectus disclaims “are subject to tracking risk because they may not be perfect substitutes for the instruments they are intended to hedge or replace. Over the counter swaps are subject to counterparty default. Leverage inherent in derivatives will tend to magnify the Fund’s losses.”
Daily Rebalancing
In bold lettering the Prospectus states “Because of daily rebalancing and the compounding of each day’s return over time, the return of the Fund for periods longer than a single day will be the result of each day’s returns compounded over the period, which will very likely differ from -100% of the return of the Index over the same period.” In essence, this means greater volatility to both the upside and downside.
High Volatility
This should be obvious, due to the index that SOGU tracks. The DeSPAC Index comprises only 25 names, during only the first 12 months post-SPAC merger, and with an average market cap of $2.4 billion as of 3/31/22 (right around the $2B threshold separating the common definition of small-cap and mid-cap companies). And of course, the overall market is having a volatile year as well. SOGU’s standard deviation is 57% vs. 16% across all ETFs rated by SA.
Using Sharpe Ratio to Understand Risk/Reward
However, it’s important to see SOGU’s risk in context of its reward. The Sharpe Ratio is perhaps the best way to do this, as it looks at a security’s return above the risk-free rate (treasury yields) as a ratio of its risk/volatility (using standard deviation). While SOGU’s short history limits the usefulness of the ratio, by my calculations the Sharpe Ratio since 5/21 inception is 2.45 (or (139-2)/56) and the 1 year Sharpe Ratio is 3.26 (185-2.2/56%). Compared to the (SPY) Sharpe Ratio of 0.74 to 0.95 over the last 3 and 5 year periods respectively, SOGU’s risk/return ratio is still amazing.
There’s a reason SOGU is the #1 2022 YTD performer among all unleveraged ETFs.
SOGU Technicals & Performance
Despite the above risks, SOGU receives a Strong Buy rating (4.99 out of 5) from SA’s Quant Rating (learn more about SA’s Quant Ratings and performance here, available to SA Premium subscribers)
Seeking Alpha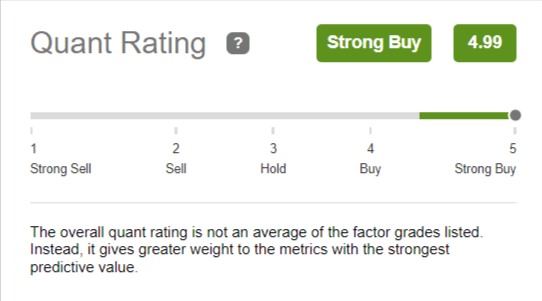
.. which places it as the #1 overall ranked security in the entire 2,088 ETFs in its’ coverage universe.
Seeking Alpha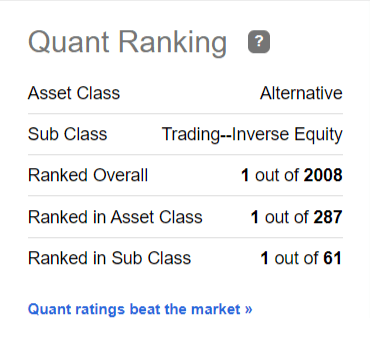
The YTD chart from Finviz includes the near perfect technical levels across metrics, including:
- RSI 66.4
- MFI 64.0
- ULT 63.61
FinViz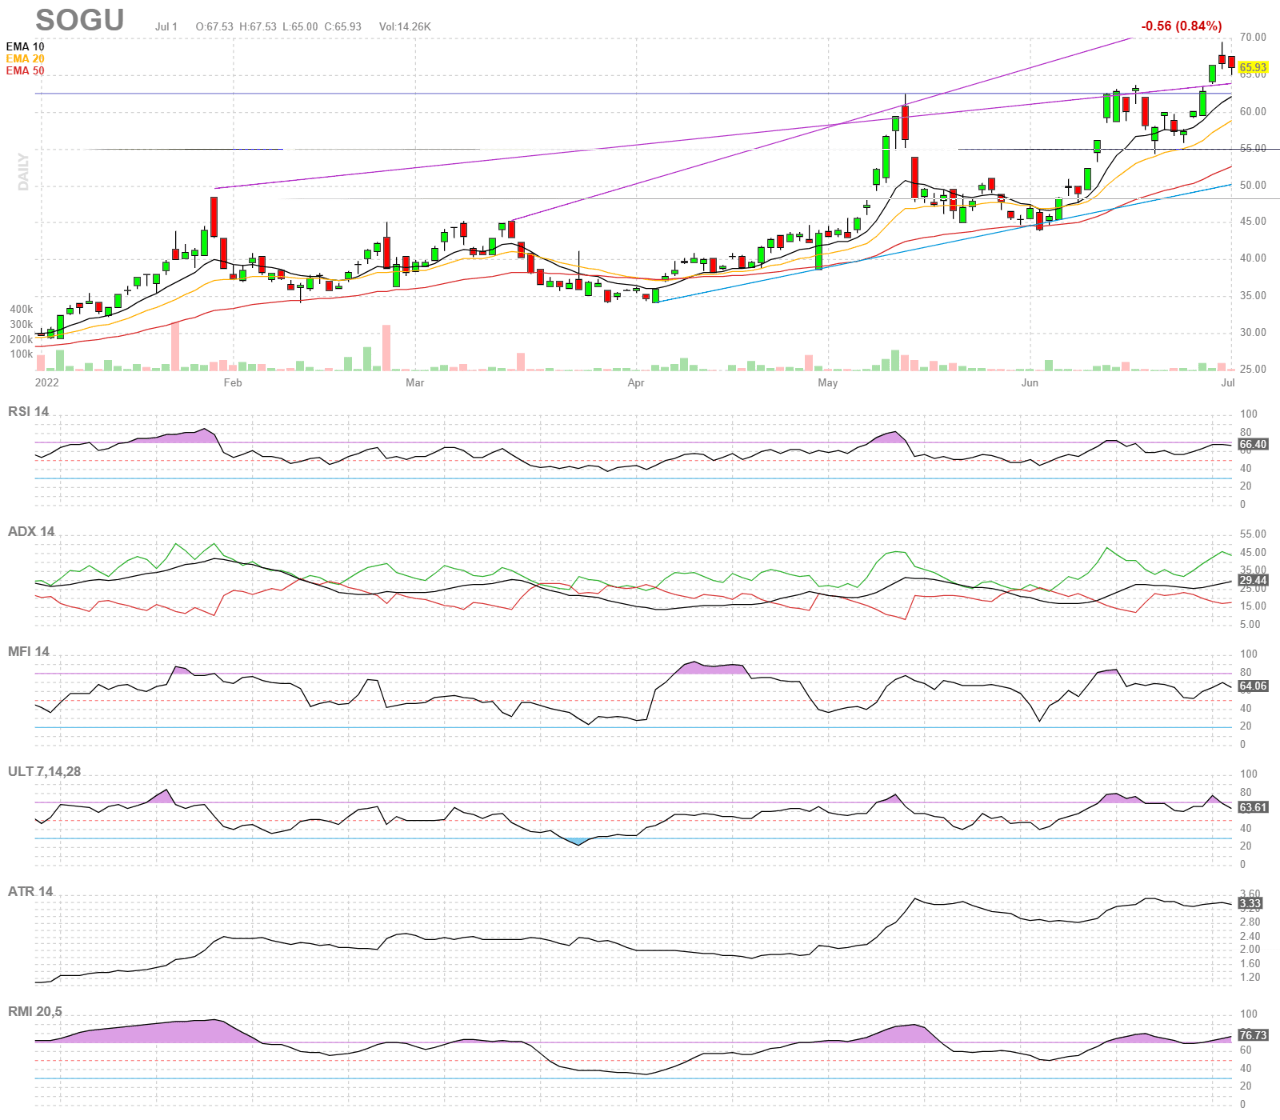
I say near perfect, because they’re all high (>50) but not yet extended (>70).
Unsurprisingly, price performance is strong across every possible time scale.
Seeking Alpha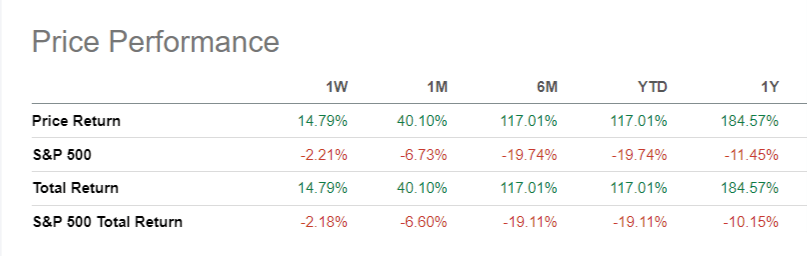
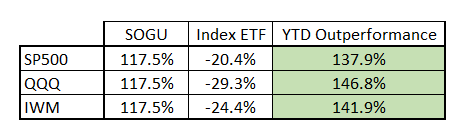
and here’s how that YTD compares to S&P 500 (SP500), Nasdaq 100 (QQQ) and Russell 2000 (IWM):
Seeking Alpha Data from Seeking Alpha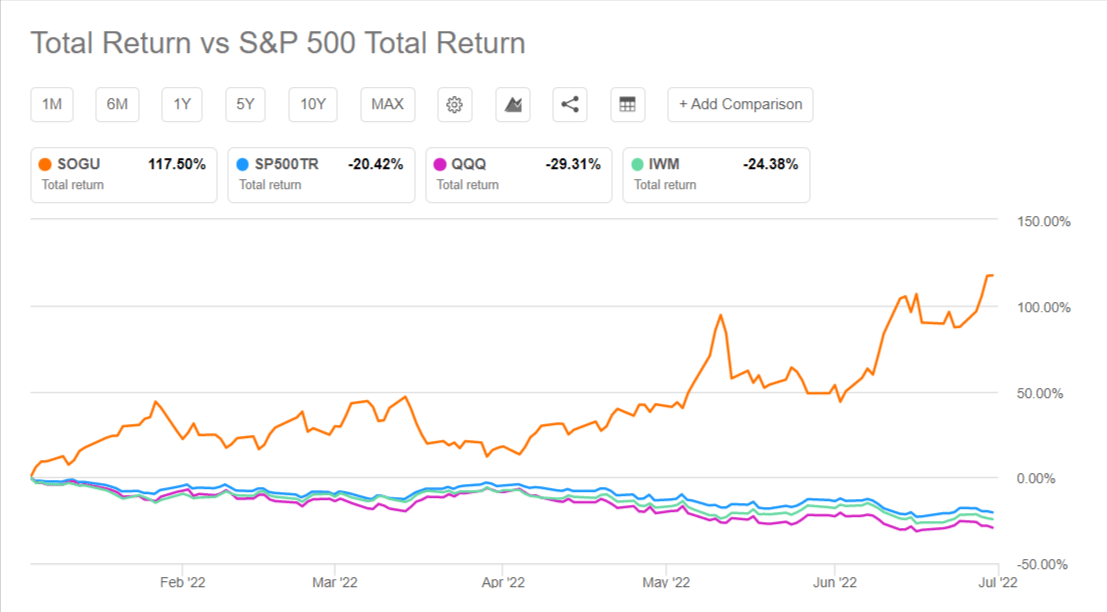
Conclusion
As discussed at the top of the article, the well-documented problems with SPACs have caused their post-SPAC merger performance as de-SPAC companies to be awful the last few years, even before the added challenges of inflation, rising rates and recessionary concerns took hold in 2022. In short, de-SPACs as a group face an even more daunting future ahead.
If you can handle the risks of low liquidity, high bid-ask spreads, and higher volatility, you will be rewarded with amazing returns that can do a lot to repair your embattled 2022 portfolio.
I held shares of SOGU before, but preparing this analysis convinced me to buy even more. I am very bullish on SOGU’s continued performance and rate it a Strong Buy. Let me know your thoughts in the comments below, thank you!
Be the first to comment