

Thank you for your assistant
Intangible assets are the new gold
In 2020 the percentage of intangible assets of the total assets in the S&P 500 reached 90% for the first time. As the world keeps getting more digitalized, real assets like buildings, equipment and land could lose value, while technology patents, customer data and brand value could keep increasing in importance. In a time where strong brands dominate, NIKE is in a pristine position to capitalize on the opportunity.
According to Kantar BrandZ Most Valuable Global Brands 2022 Study, NIKE is the world’s 13th most valuable brand at an estimated $109 billion, gaining 31% compared to 2021 and jumping 4 positions up. This dominant position is underlined by the gigantic gap to the closest competitors in the apparel category: Zara at rank 83 ($25 billion) and adidas (OTCQX:ADDYY) at rank 89 ($23 billion).
Kantar BrandZ Most Valuable Global Brands 2022 (Kantar)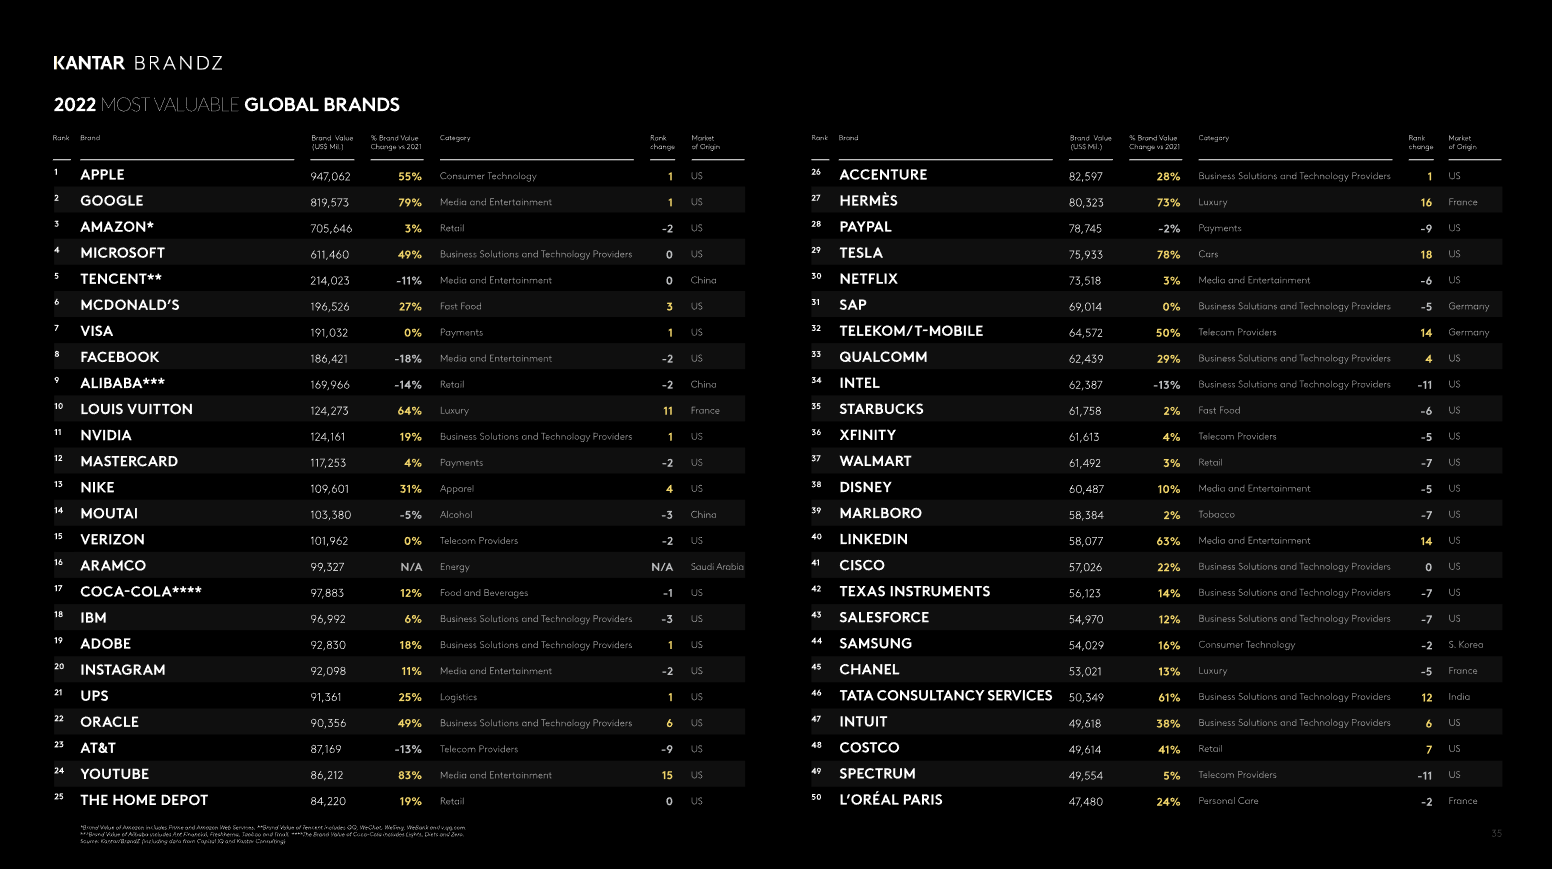
Brand sponsorships enjoy high trust
According to Nielsen Sports, brand sponsorship, especially in sporting events, is some of the best advertising channels. The only channel more trusted is direct recommendations by a close person. NIKE is one of the biggest players in this segment, with over 650 sponsorships in over 140 different leagues or associations.
Nielsen 2022 Global Sports Marketing Report (Nielsen Sports)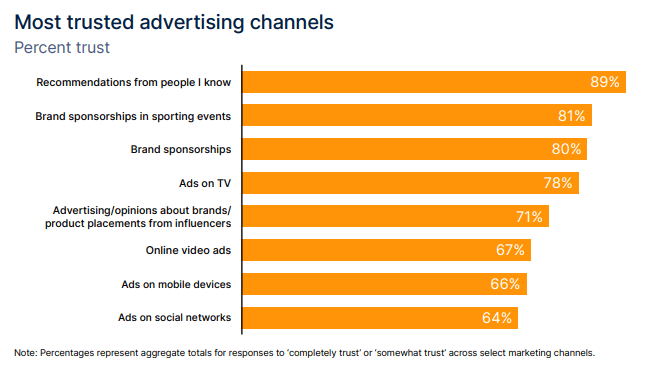
Especially, direct sponsorships in professional athletes have a high appeal, benefiting from a deeper connection to their fans than other players in the sports industry. According to SportsPro Media, NIKE generated over 8.77 billion engagements in its social media posts via its over 15,000 sponsored Athletes.
Nielsen 2022 Global Sports Marketing Report (Nielsen Sports)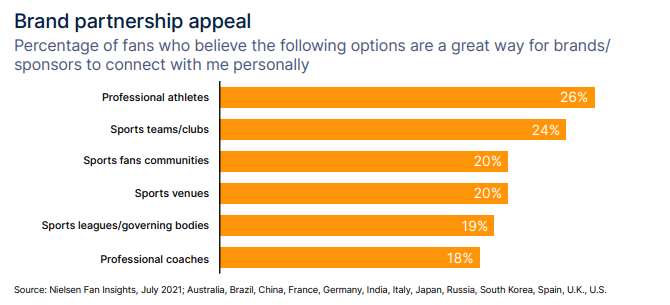
NIKE fundamental analysis
Let’s take a look at NIKE’s fundamentals. We’ll take a look at the profitability, growth, capital reinvestment, capital returns and balance sheet of the company, followed by a look at the valuation.
Steady profitability
NIKE has shown steady profitability, except in 2020 due to lockdowns and vastly reduced demand for athletic wear, with a very slight uptrend in the bottom line over the last 10 years. The gross margin has stayed very stable between 43 and 46%.
NIKE Profitability (Koyfin)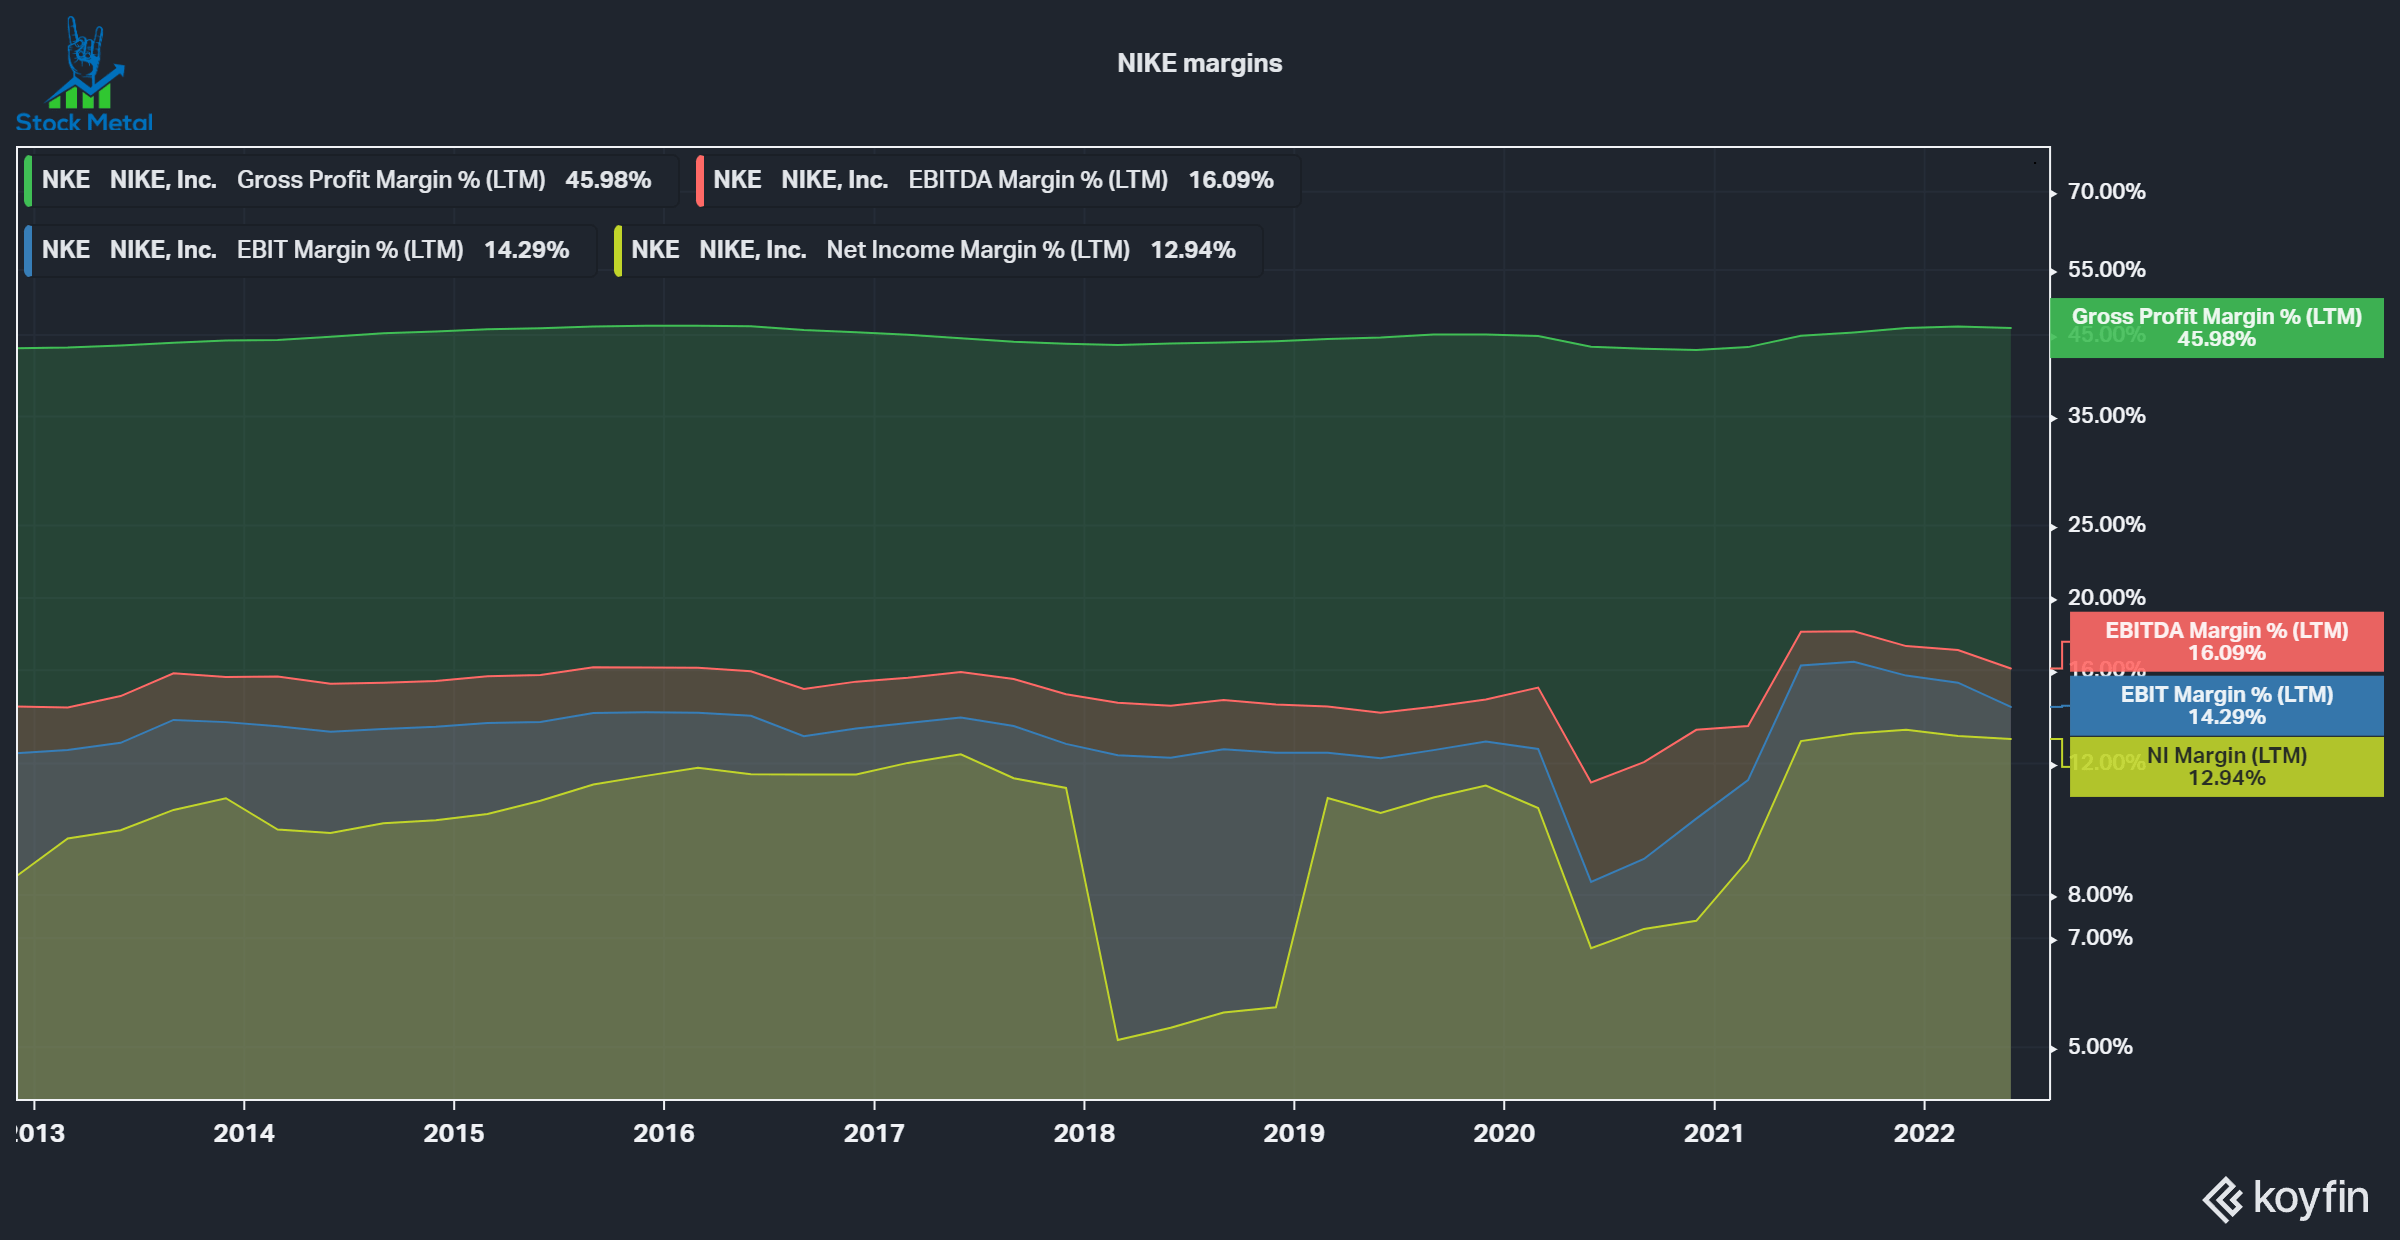
These margins should continue to trend up in the future because NIKE is putting more emphasis on direct-to-consumer (D2C) sales. This transition has especially hurt retailer Foot Locker (FL), which used to have 65% of its revenue from the sale of NIKE shoes. In the table below, you can see that D2C has rapidly taken revenue share for NIKE, growing 60% in the last 3 years. I see this trend continuing with NIKE’s excellent network of athletes, leaving room for further margin improvements.
| Year | 2019 | 2020 | 2021 | 2022 | Growth 19-22 |
|---|---|---|---|---|---|
| Wholesale revenue in $billion | $25.4 | $23.2 | $25.9 | $25.6 | 0.8% |
| D2C revenue in $billion | $11.7 | $12.4 | $16.4 | $18.7 | 60% |
Consistent growth
Over the last decade, NIKE has seen steady growth, with the bottom line growing slightly faster than the top line. Revenues averaged a 5-year CAGR of 7%, while net income and cash from operations averaged around 9%. This is solid growth, considering the size of NIKE and the dominant leadership in its segments.
NIKE Growth (Koyfin)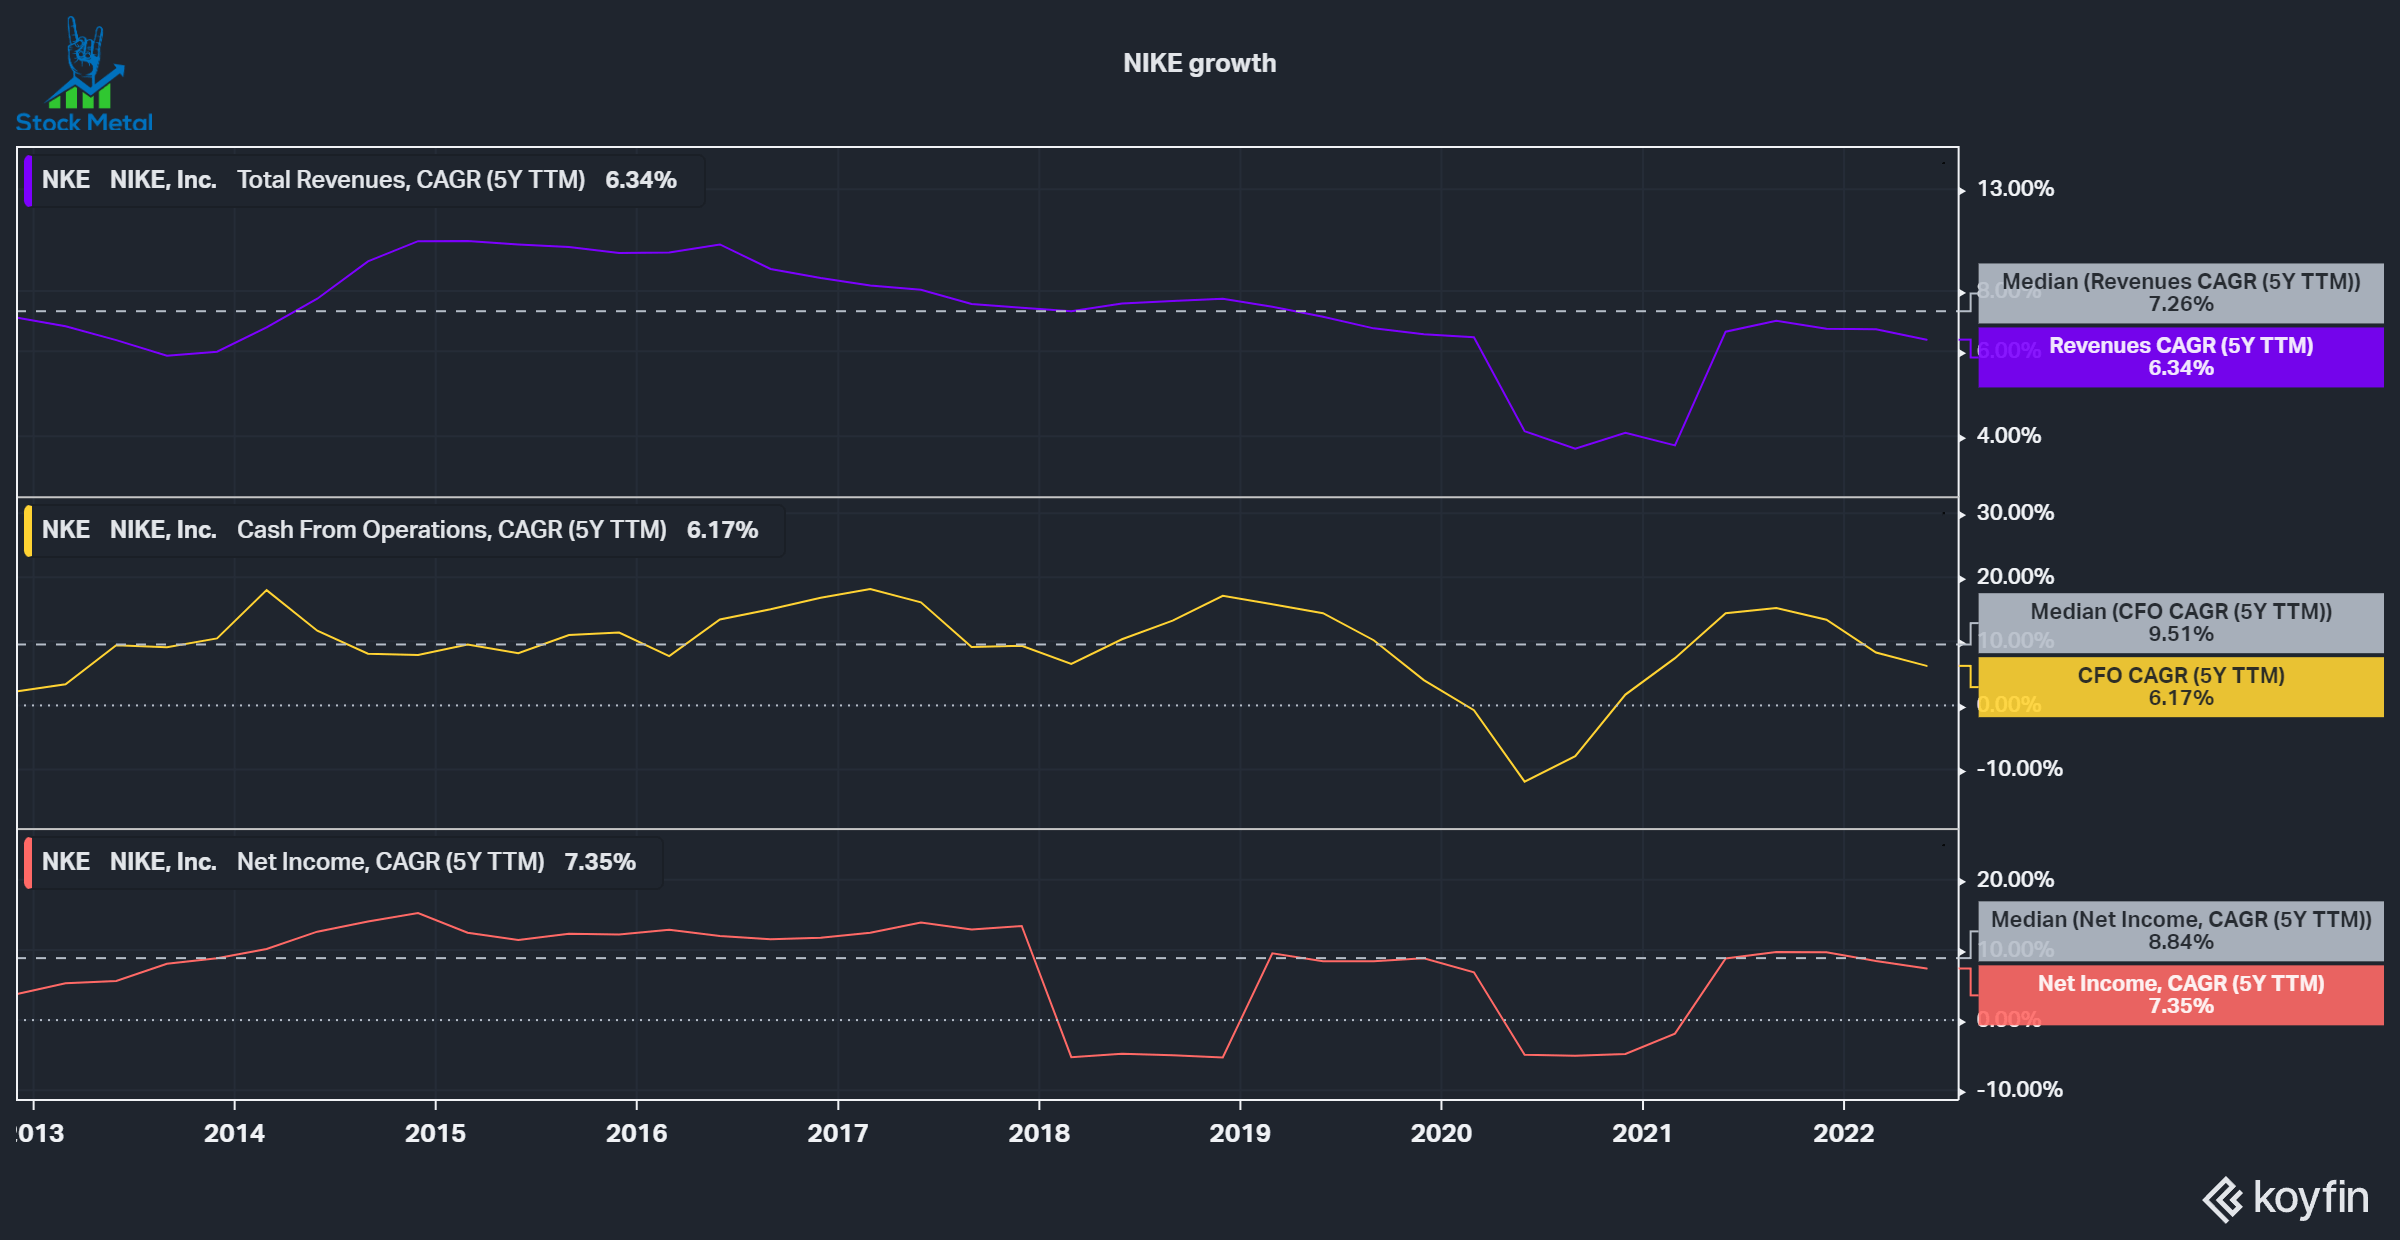
Capital reinvestment
Over the long term, Capital Allocation is one of the most important differentiators for the performance of a company. This means how the cash flows generated by the company are reinvested. Companies have six options:
- Invest in the existing operations of the business
- Acquire new businesses
- Buy back shares
- Pay out dividends
- Pay down debt
- Sit on the cash
The result of these reinvestments can be roughly measured by Return on Equity, Return on Assets and Return on Capital. We can see that NIKE had consistently high returns on its assets, capital and equity. A ROC of over 15% on average is considered very good, with a median ROC of 19% NIKE shows excellent reinvestment into its business.
NIKE Capital Reinvestment (Koyfin)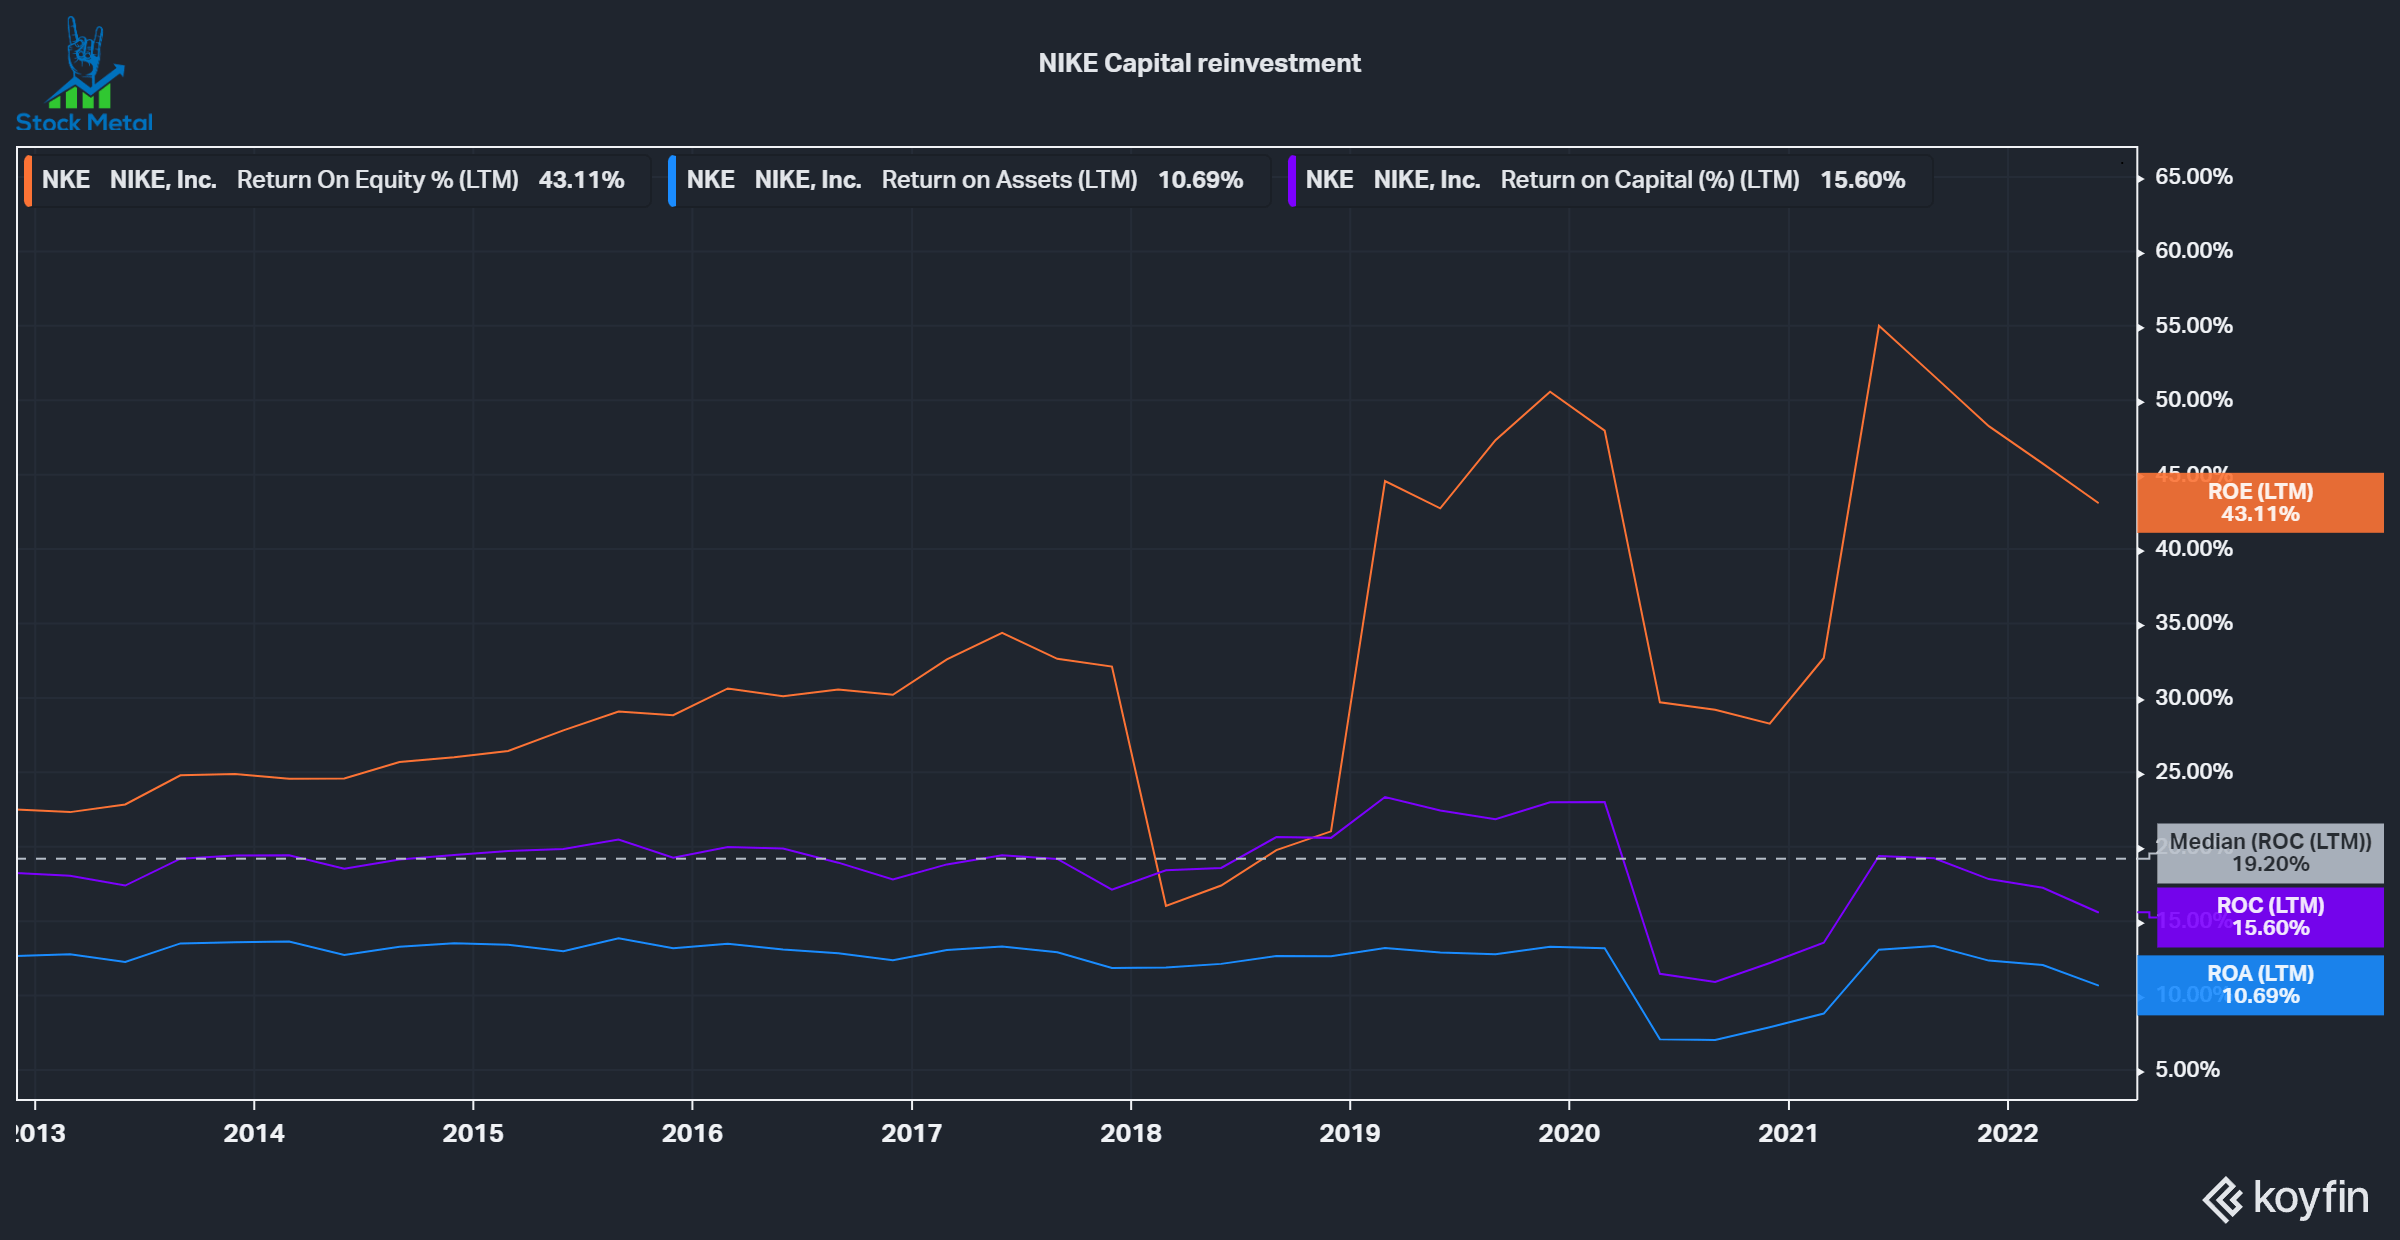
Capital returned to shareholders
To assess how a company returns money to shareholders I look at 4 different aspects: Dividends, share buybacks, debt issuance/down payment and cash acquisitions.
Over the last 10 years, NIKE returned on average 3.55% to shareholders via dividends (1.11%) and buybacks (2.44%). As a result, the share count declined by almost 16% over the last decade. The company hasn’t done a lot of acquisitions, but it did have to take on a lot of additional debt in 2020, due to the Covid pandemic (around $6 billion).
The company has consistently grown the amount of money spent on buybacks over the years, until 2020. The company has reaccelerated buybacks with the business going back to normal. Even during the crisis in 2020 the company stayed disciplined and didn’t dilute shareholders.
NIKE Returned Capital (Koyfin)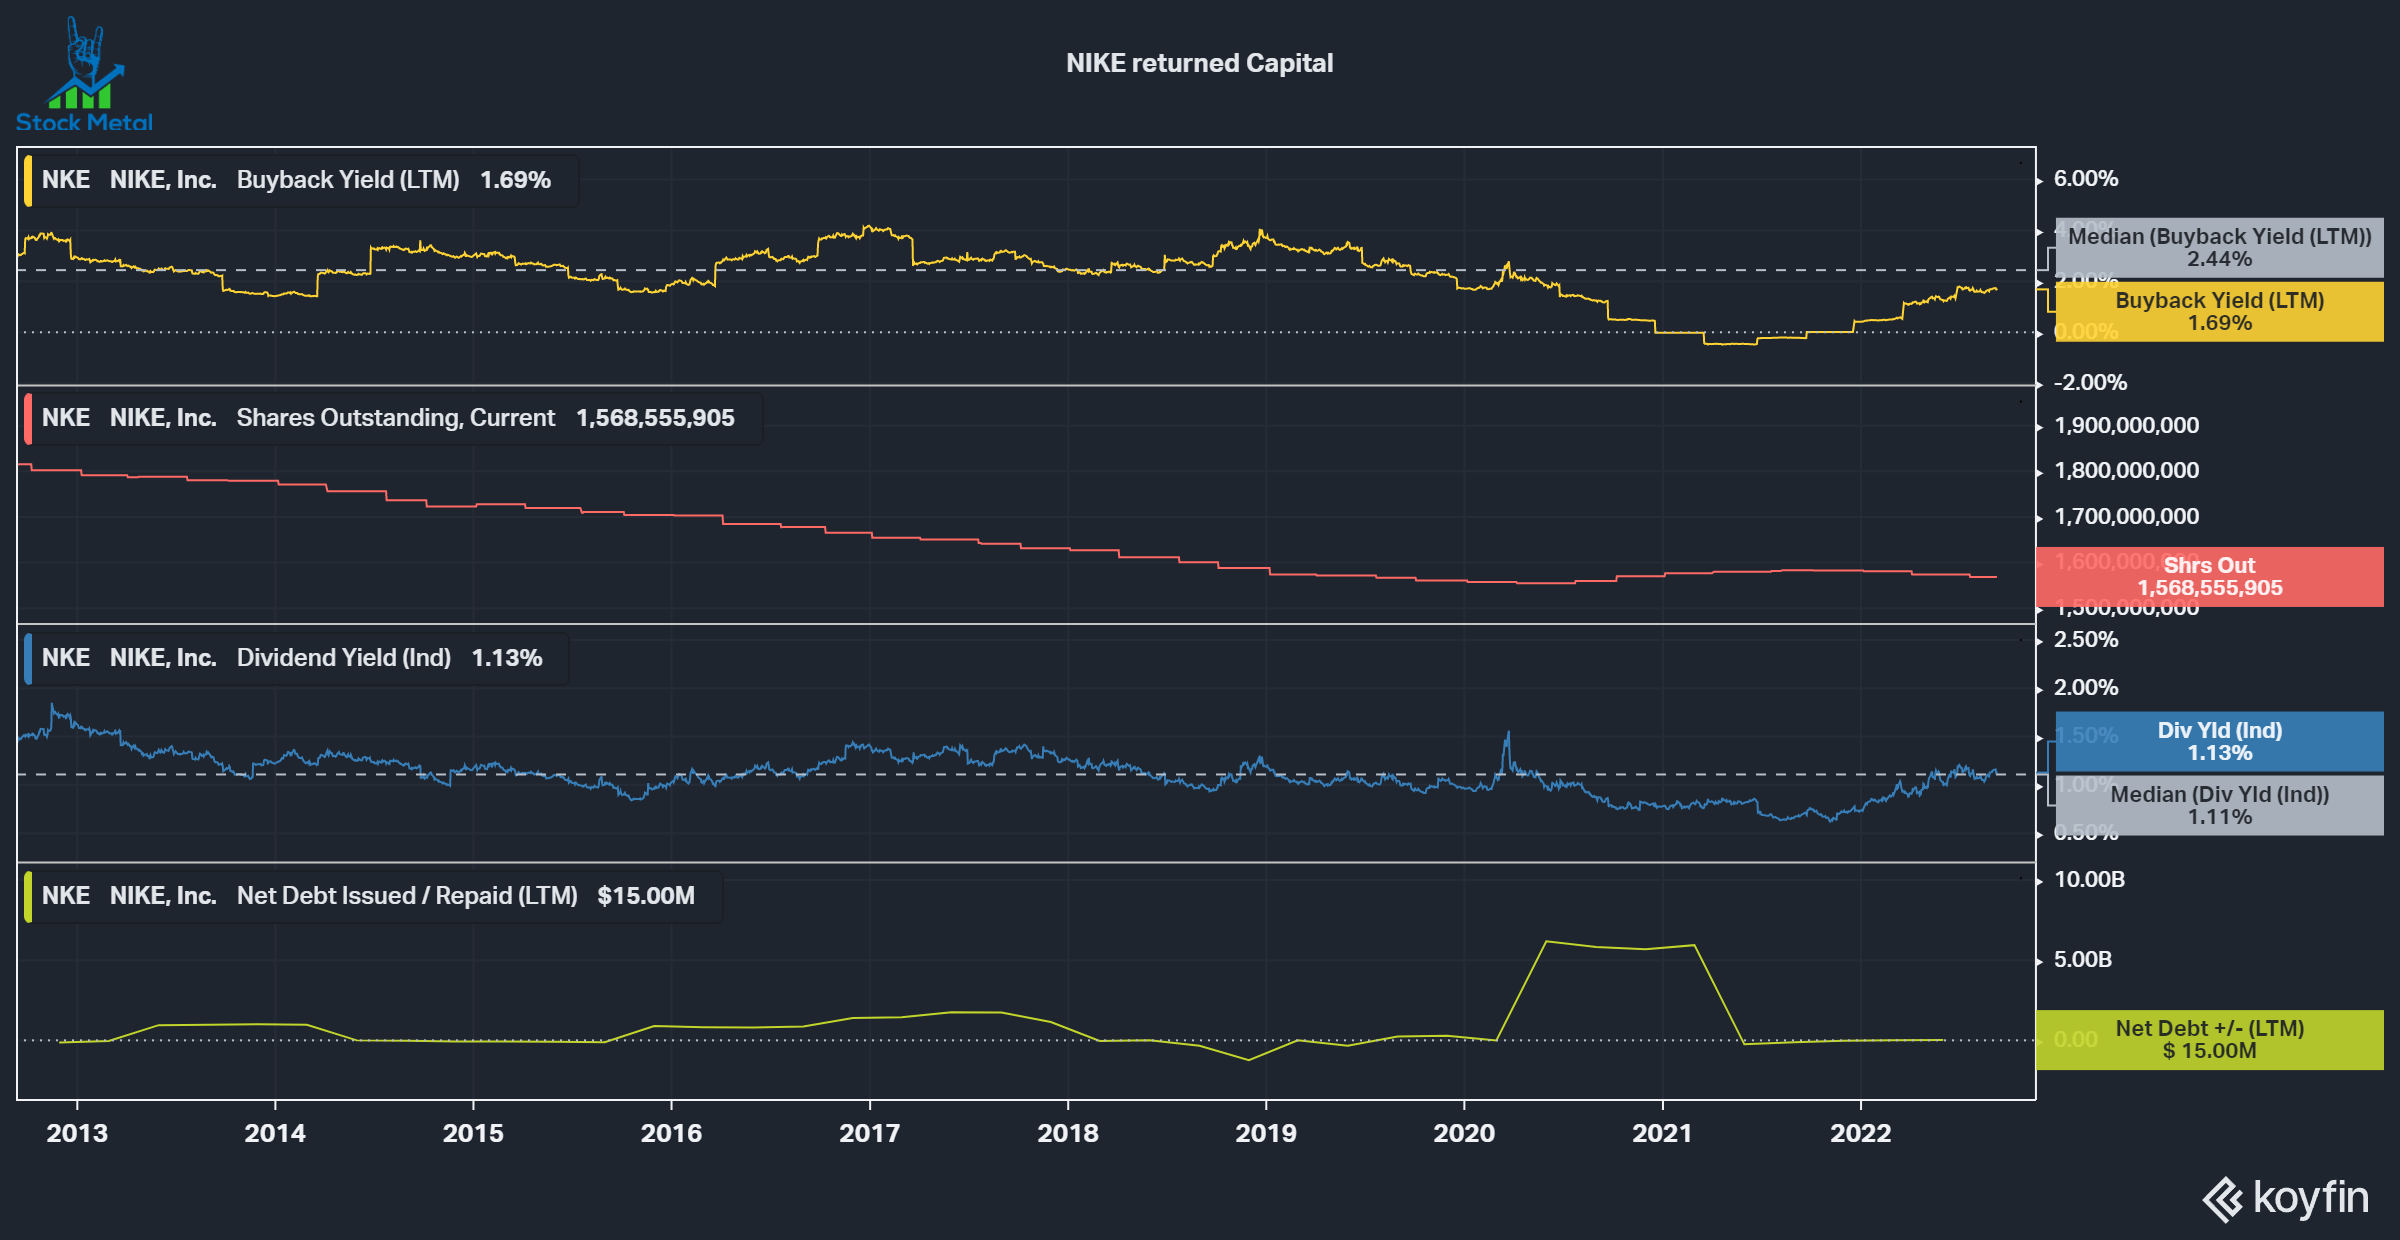
A clean balance sheet
NIKE managed to keep its balance sheet clean over the last decade. The company isn’t leveraged at a 0x net debt/EBITDA ratio, due to its high cash and short-term investment positions. The company could pay off its entire debt right now, if it wished to do so, putting it in a great position against any sort of crisis that could hit the company.
NIKE Balance Sheet Health (Koyfin)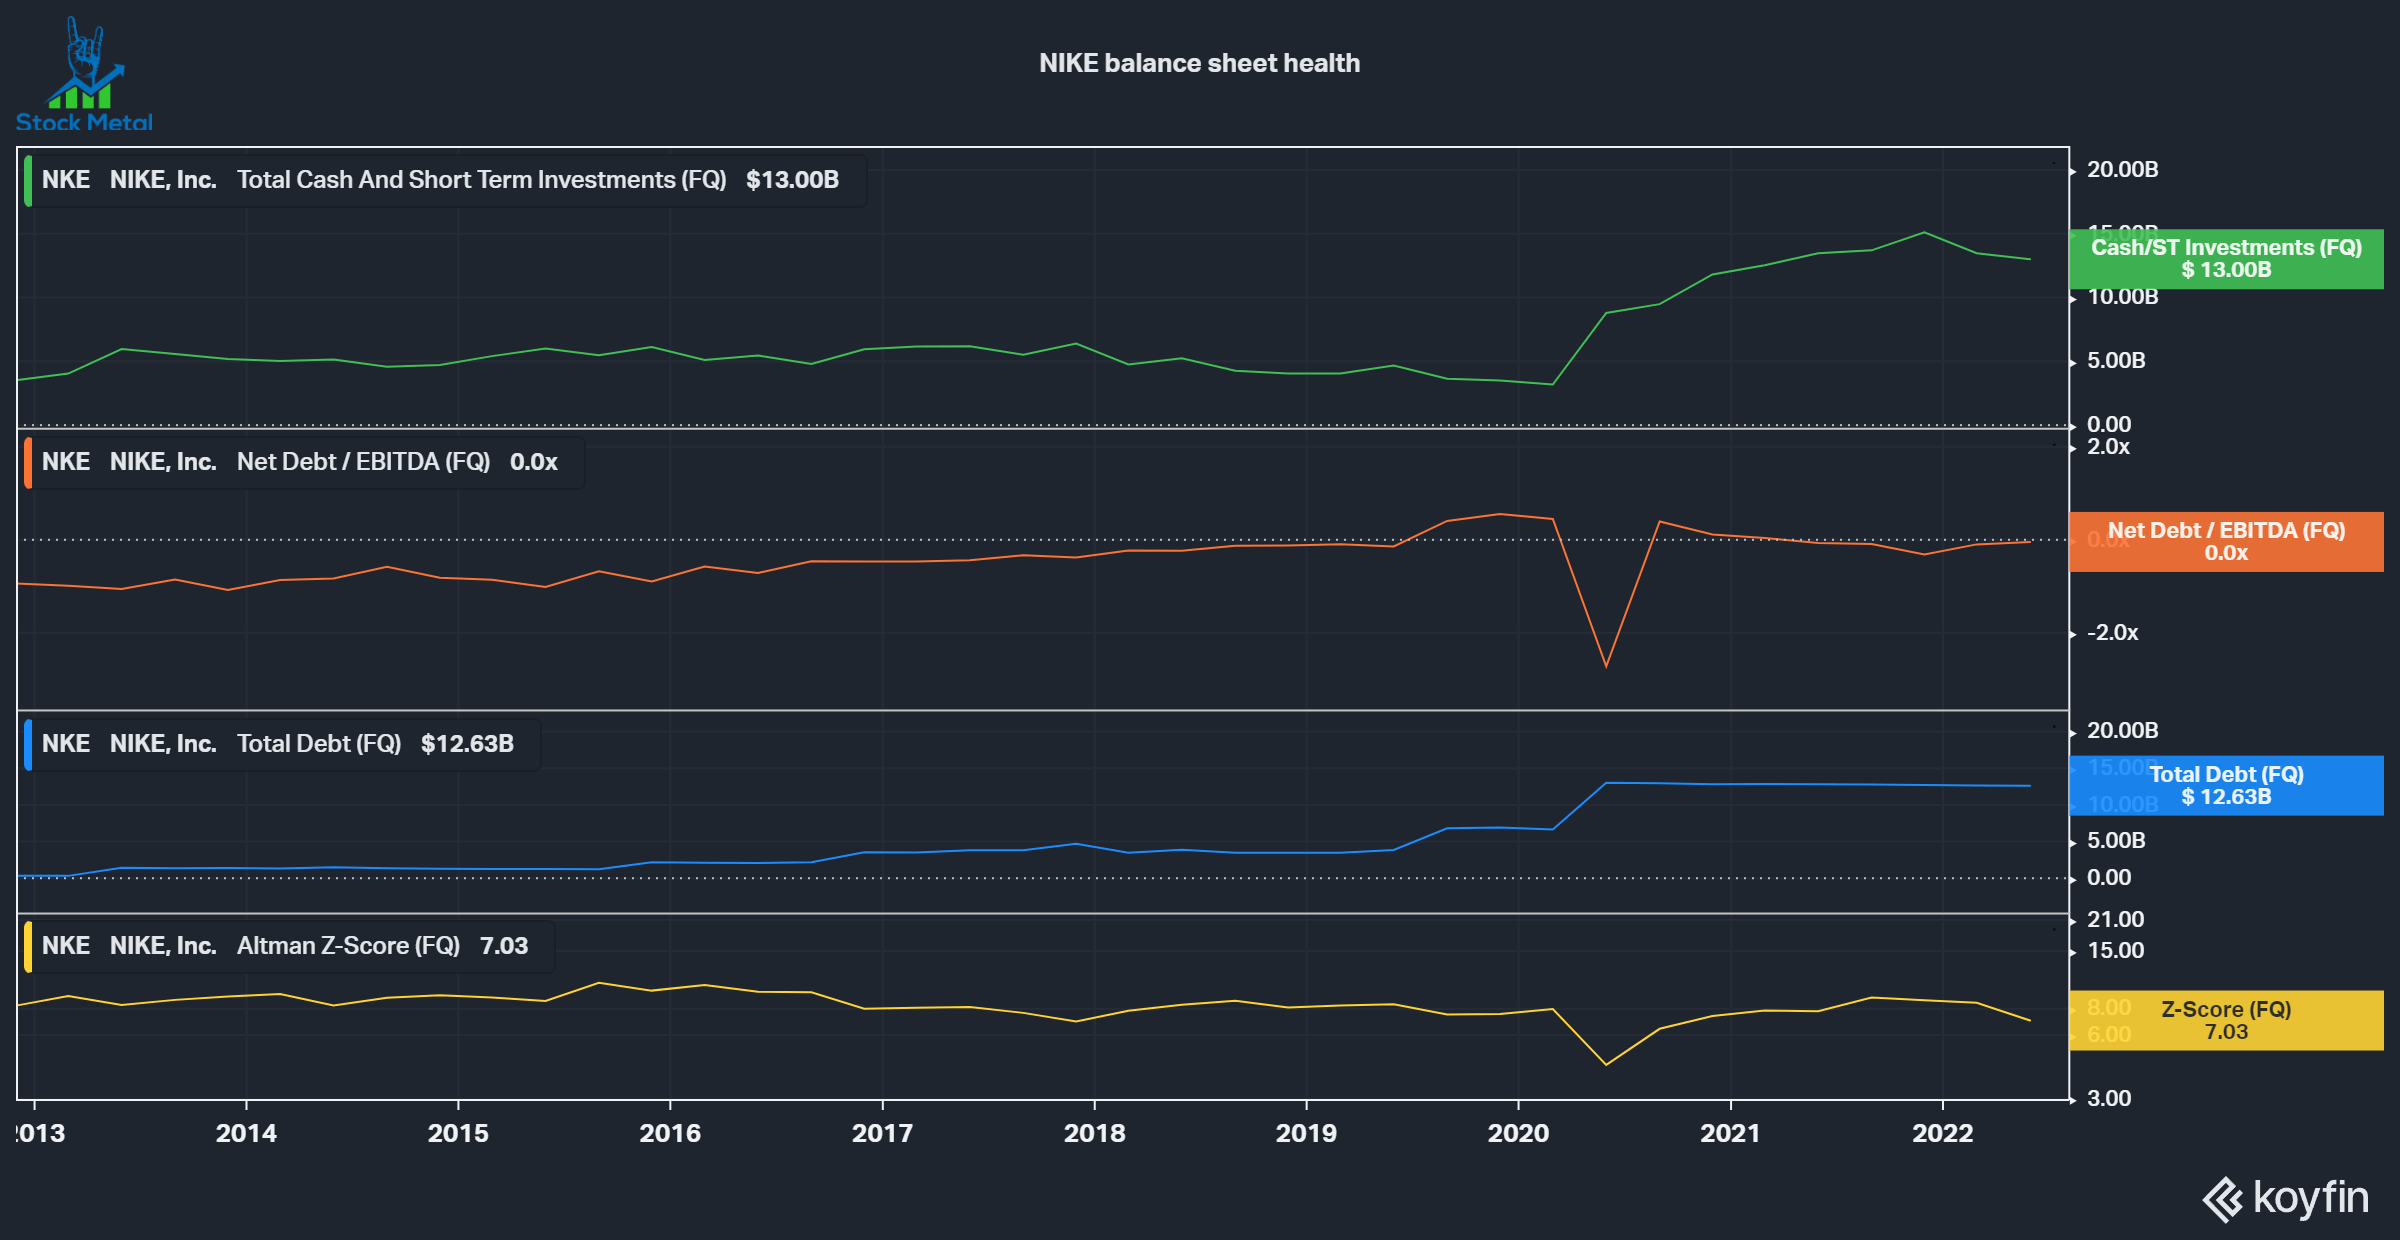
An expensive valuation
To value the company, I’ll take a look at an inverse DCF model to assess what free cash flow growth rate the market is pricing into the stock, and I’ll look at the Seeking Alpha consensus EPS estimates as a proxy for expected profit growth. Analysts are expecting an explosion in profits from 2022 to 2026 growing from $3.8 to $6.26, followed by a slower growth rate of around 10% for the next 5 years. For revenues, expectations are a lot smaller, averaging around 8% for the next decade. If we look at the current share price, and we’re assuming a 2% buyback yield per year, the company is expected to grow FCF at 12-13% a year to generate a 10% return. This is above the 10.7% FCF per share growth of the last 10 years.
NIKE Inverse DCF Analysis (Author’s Model)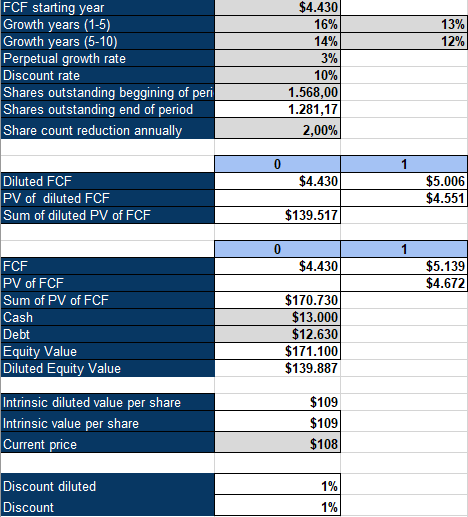
NIKE is a cautious buy
NIKE is a beautiful business with a deep moat, due to its high brand value and network of athletes. The company is expensive though, according to the priced-in FCF per share growth of 12-13%. During 2020 and 2021 the company was quite overpriced, trading at all-time highs and a forward PE of 40 even though its business was struggling. This excessive valuation has come down a lot, but I still wouldn’t call it a bargain. I’ll give it a cautious buy, given that it’s a proven compounder with a clean balance sheet.
Be the first to comment