

In this article, we examine the significant weekly order flow and market structure developments driving NG price action.
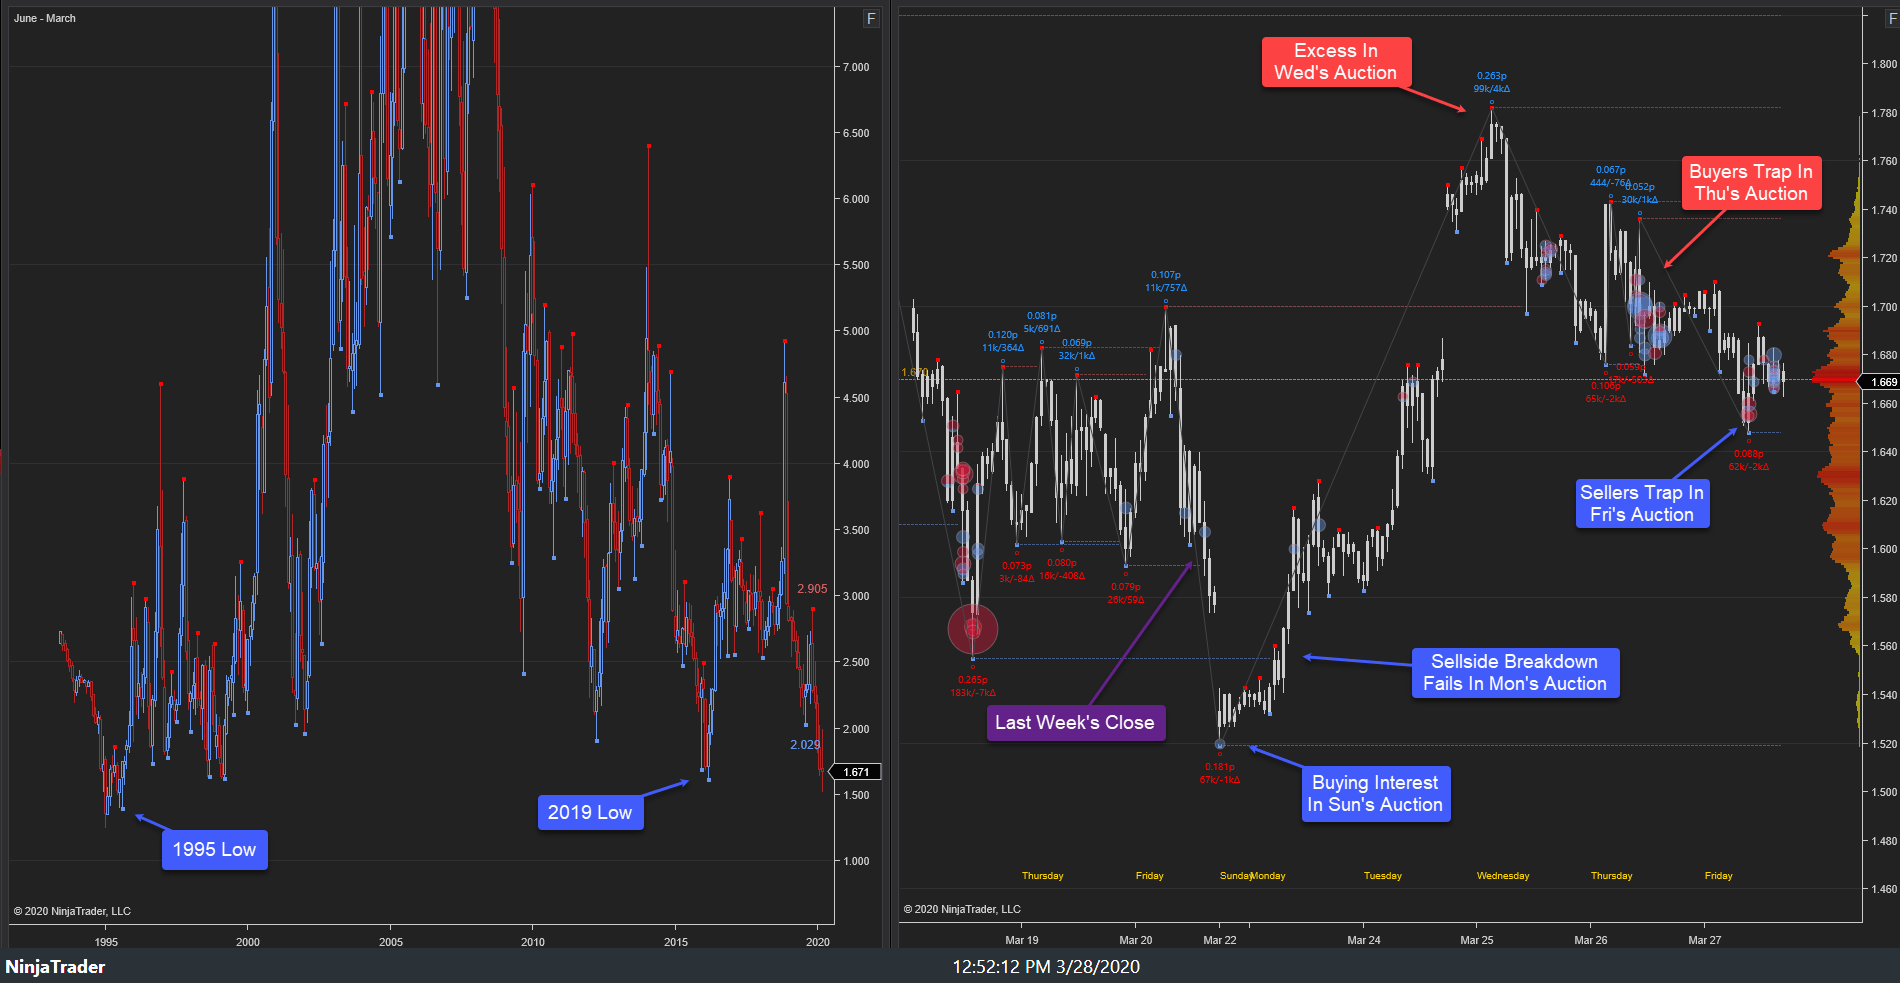
As noted in last week’s NG Weekly, the highest probability path for this week was for price discovery lower barring failure of 1.70s as resistance. This probability path did play out as a failed breakout above key resistance to 1.73s resulted in price discovery lower to 1.52s, testing key support in Thursday’s trade. Buy excess developed there, halting the sell-side sequence, developing balance, 1.52s-1.59s, before an aggressive rally developed to 1.65s ahead of Friday’s close, settling at 1.62s.
29 March-03 April 2020:
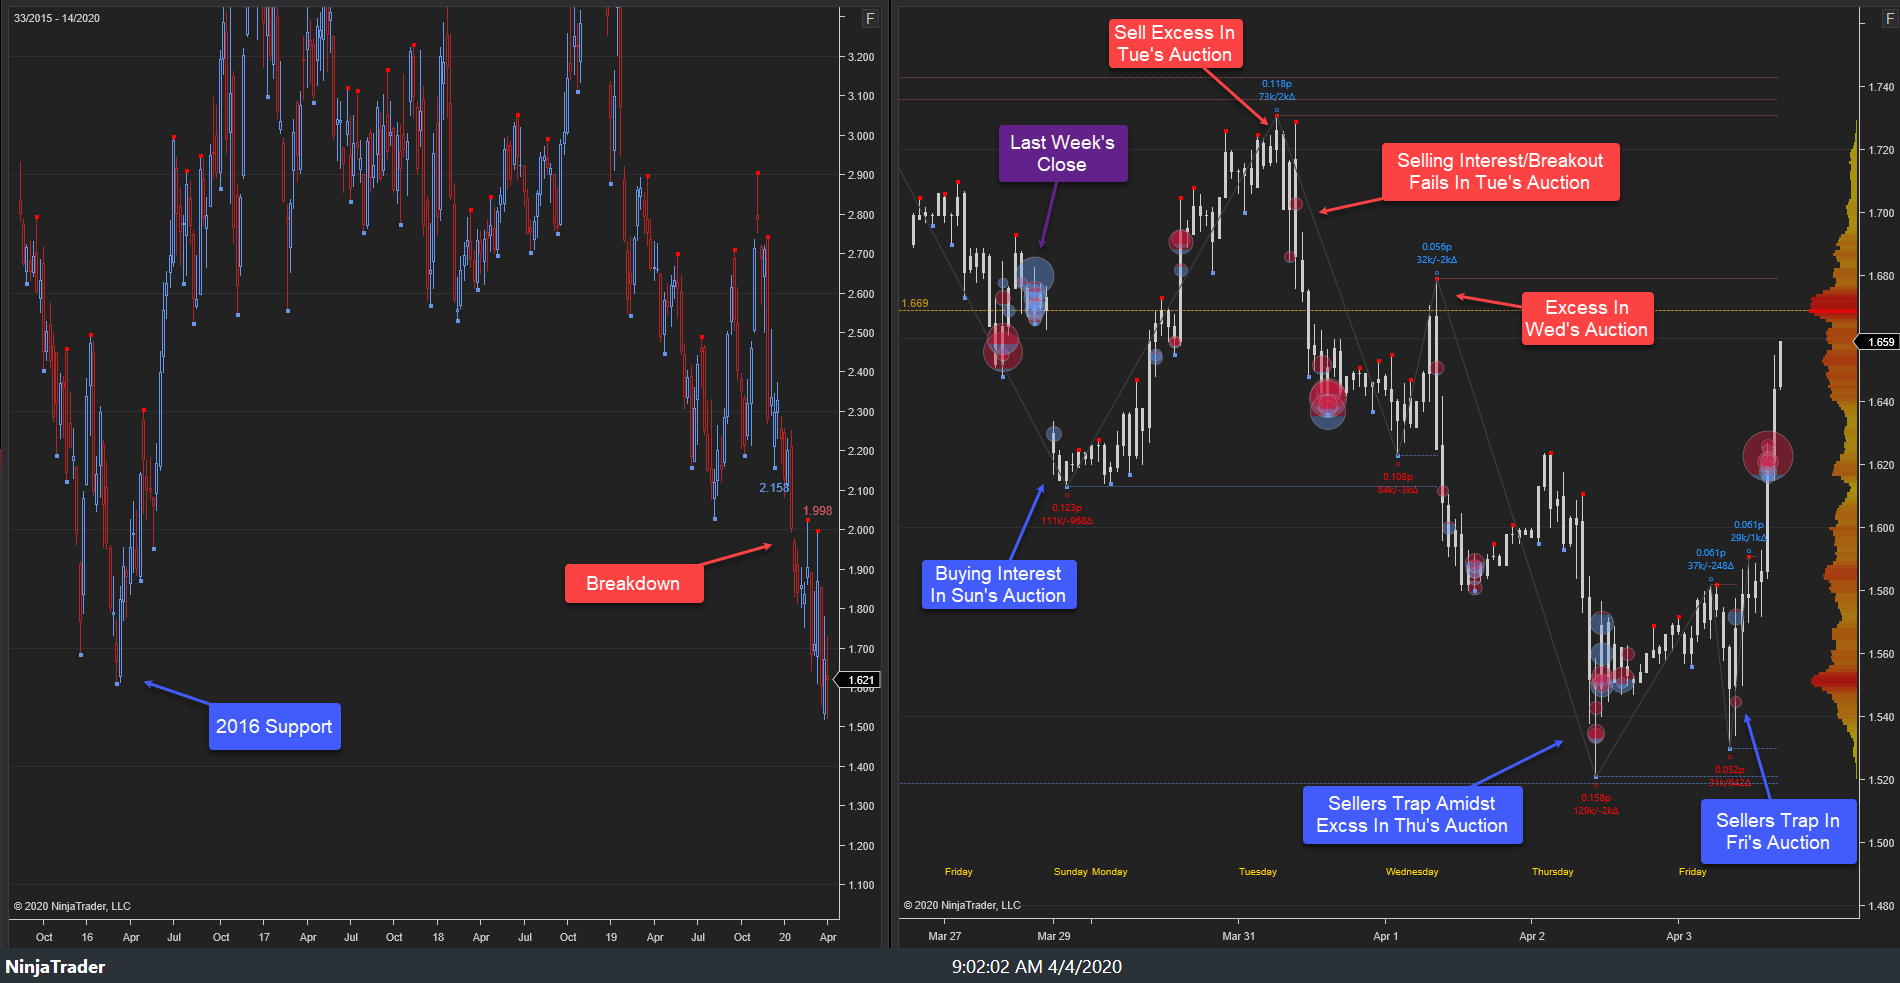
This week’s auction saw price discovery lower in Monday’s auction as last Friday’s late buyers failed to hold the auction. A stopping point developed, 1.61s, as buying interest emerged before a buy-side rally ensued to test key resistance, 1.70s, where selling interest emerged into Monday’s NY close. Monday’s late sellers failed to hold the auction as minor price discovery higher continued, achieving the weekly stopping point high, 1.73s, into Tuesday’s auction. Minor excess developed there before selling interest emerged, 1.70s/1.68s, as the breakout failed. Price discovery lower developed to 1.63s where selling interest emerged, 1.63s, into Tuesday’s NY close.
Sell excess developed, 1.68s-1.65s, in Wednesday’s auction as sell-side continuation to 1.58s developed into Wednesday’s NY close where buying interest emerged. Balance developed, 1.57s-1.62s, before sell-side continuation resumed through the EIA release (-19 bcf vs. -24 bcf expected) achieving the weekly stopping point low, 1.52s, at/near major support. Sellers trapped there amidst buy excess, halting the sell-side phase into Thursday’s NY close. Balance developed, 1.52s-1.59s, before an aggressive rally developed to 1.65s ahead of Friday’s close, settling at 1.62s.
This week’s primary expectation of price discovery lower did develop after a breakout through key resistance, 1.70s, failed. Price discovery lower then ensued to 1.52s, testing key support into the week’s end. This week’s auction saw the market trade slightly higher to 1.73s toward a large option “Wall” at the 1.75-1.85 strikes before rotation lower resumed to 1.52s near the current option “Wall” at 1.50s below.
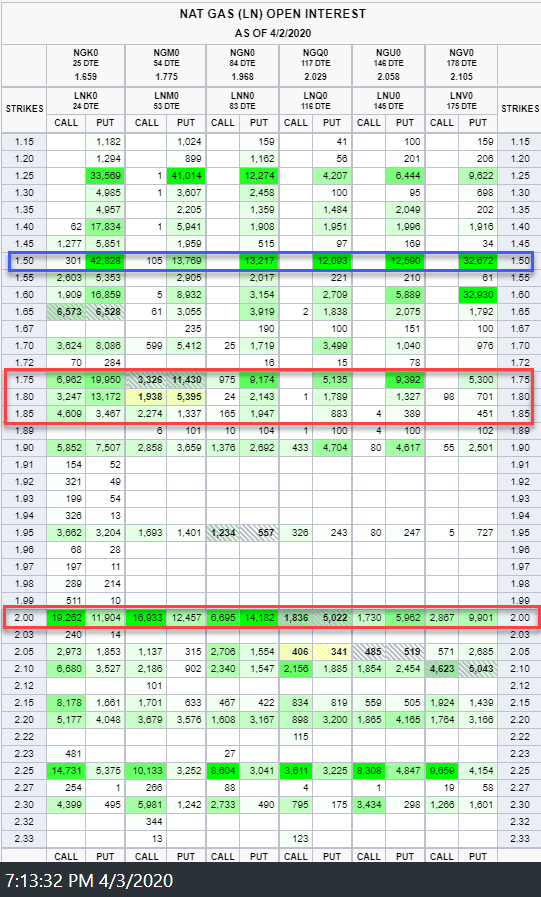 Source: CME/QuikStrike
Focus into next week rests upon the market response to this week’s key support area, 1.55s-1.52s. Sell-side failure to drive price lower from this area will target key supply clusters above, 1.70s-1.73s/1.78s-1.82s, respectively. Alternatively, buy-side failure to drive price higher from this area will target all-time lows (1995), 1.25s. The highest probability path, near-term, is neutral, barring failure of 1.52s as support. The four-year demand cluster, 2.20s-1.50s, which we have noted for months and which the market revisited, remains key to the larger structural view. In the intermediate term (3-6 month) context, conditions in the leveraged capital posture reflect signs of potential structural low formation as the market trades to this major demand area.
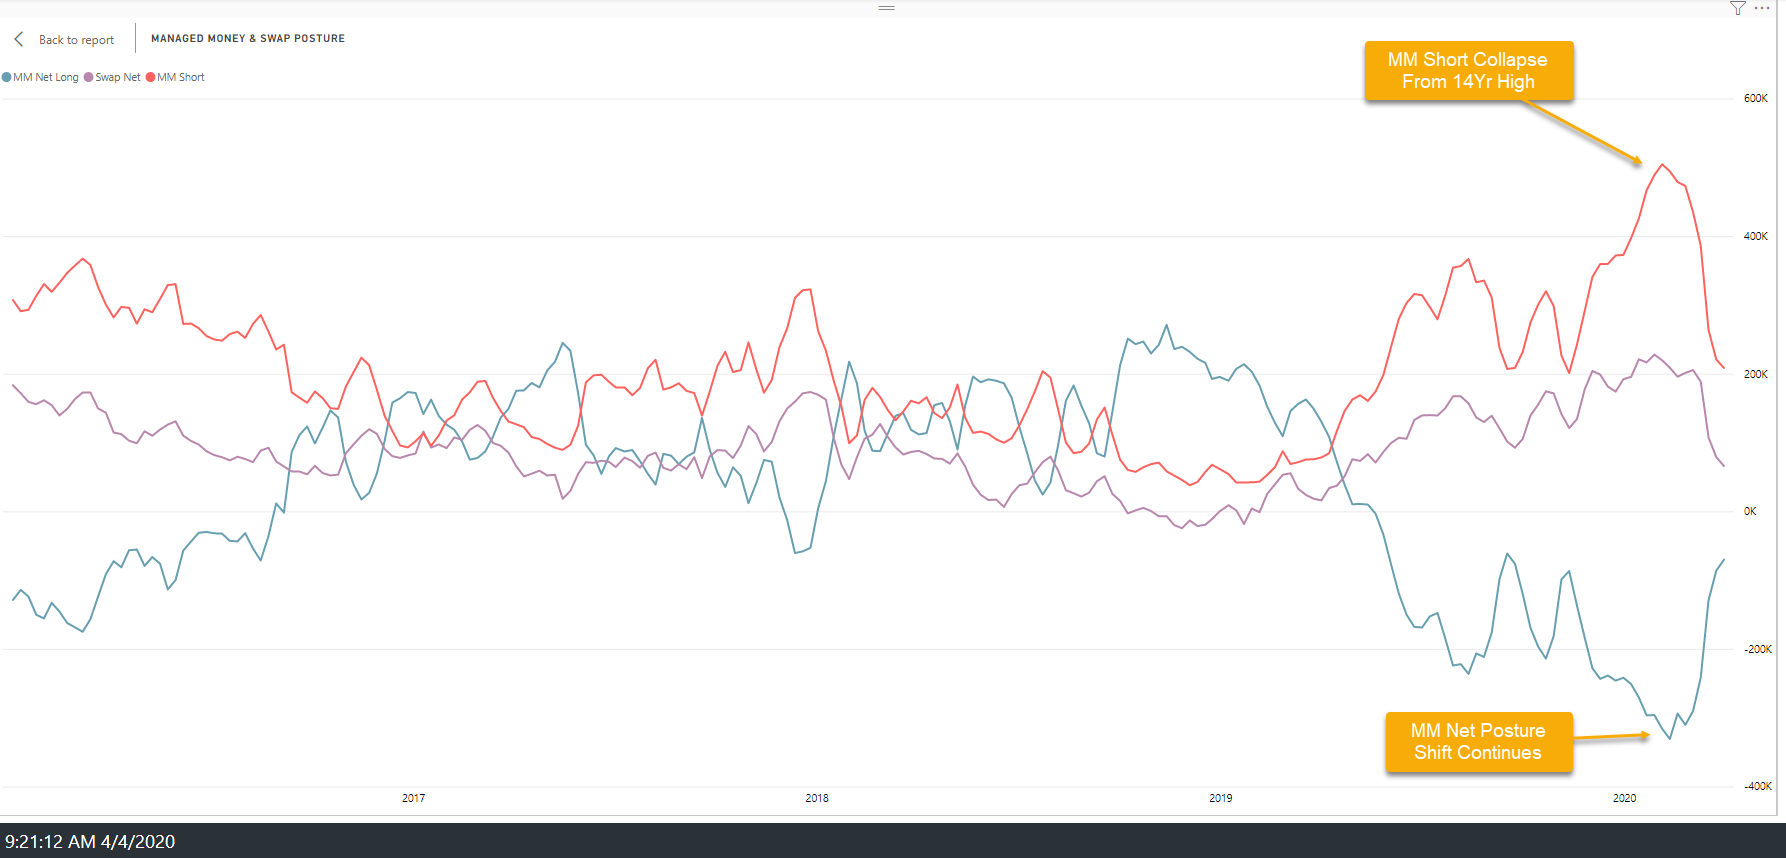
It is worth noting that despite the approximately 59% decline from the November 2018 high to the August 2019 low, only from June through early September 2019 had the Managed Money (MM) short posture begun to reach levels consistent with structural low formation (typically 300-350k contracts). MM short posture peaked the week of 13 August (-367k contracts) declining into mid-November (-201k contracts). This development implied that MM sentiment reached extreme bearishness as price reached lows resulting in the rally from 2.02s to 2.90s. In the last 2 instances of this development (March 2016 and December 2017), NG subsequently rose from 1.70s to 3.25s and 2.65s to 4.5s, respectively. This week’s data shows MM net short posture decreased (-69k contracts), an approximately 261k contract shift, from the fourteen-year low developed on 11 February.
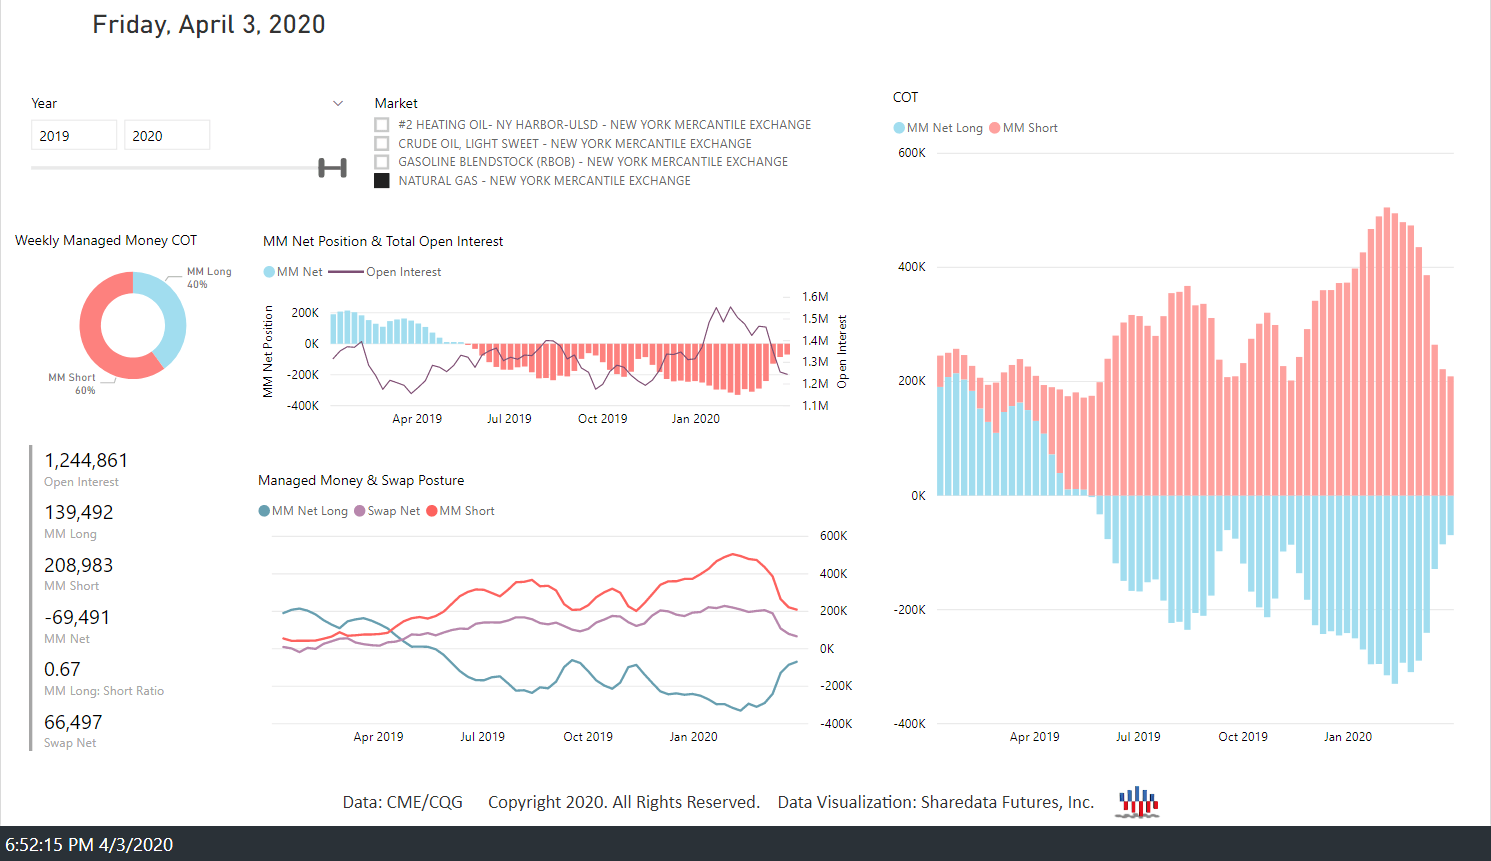
The MM short posture stands at -208k contracts as the trend lower continues since the 04 February high (-505k contracts). The MM long:short ratio and MM net long position as % of open interest remain at levels typically consistent with structural low formation. MM posture reached quantity needed to develop structural lows from July-September 2019 and current levels are more extreme. MM posture is now reflecting extreme pessimism with leveraged capital having materially shifted net posture at/near major lows. This type of development warrants caution on the sell-side as this type of herding behavior generally creates potential for abrupt price movement in the opposite direction. The large asymmetry in MM posture on the sell-side persists as the market trades into the 2016 secular low support area, 1.60s-1.85s.
 Source: Sharedata Futures, Inc.
The market structure, order flow, and leveraged capital posture provide the empirical evidence needed to observe where asymmetric opportunity resides.
Disclosure: I/we have no positions in any stocks mentioned, and no plans to initiate any positions within the next 72 hours. I wrote this article myself, and it expresses my own opinions. I am not receiving compensation for it (other than from Seeking Alpha). I have no business relationship with any company whose stock is mentioned in this article.
Be the first to comment