

Solskin
Investment summary
As we’ve repeated many times to our audience here on Seeking Alpha, when it comes to the remainder of FY22, balanced portfolios with an allocation to alternatives are still an inexpensive defender of alpha. Those investors who rotated into a cash-weighting have also flourished this year, given its embedded optionality. Not to mention, the money markets and short-dated treasuries now offer respectable yields on cash maturing less than 12 months from now.
We’ve covered several names within the defensive pocket of healthcare as our analysis points to the sector performing modestly through any upcoming recessionary cycle.
Moreover, should we ride through the coming 12 months relatively unscathed, broad healthcare exposure offers access to tremendous upside on the rebound. In that vein, we’ve decided to examine the defensive characteristics of NextGen Healthcare, Inc (NASDAQ:NXGN), the provider of clinical and financial solutions across the domain. Now well into its mature growth phase, we’ve got a potential stabilizer of portfolio returns that trades at a trailing 5% earnings yield and is priced at 2x book value, with a trailing return on equity of 4.6%. Our findings demonstrate that NXGN has potential to act as a part of a defensive overlay in equity portfolios for those seeking diversified exposure to healthcare. Rate buy on this accord.
Fair view of fundamentals
It would be unwise to recommend the name in the absence of a long history of growth in revenue distribution and market share.
If we scale back 10-years, note that NXGN’s top-line fundamentals continue to stretch up on a sequential basis. This adds to the predictability of future cash flows.
Moreover, the company has grown its revenue clip at this pace whilst the average YoY growth in CapEx has remained cyclical. Hence, income is being generated at good leverage and stable capital intensity.
Exhibit 1. Sequential revenue upsides as CapEx YoY growth remains contained within range. Good operating leverage at bay.
Data: HBI, Refinitiv Eikon, Koyfin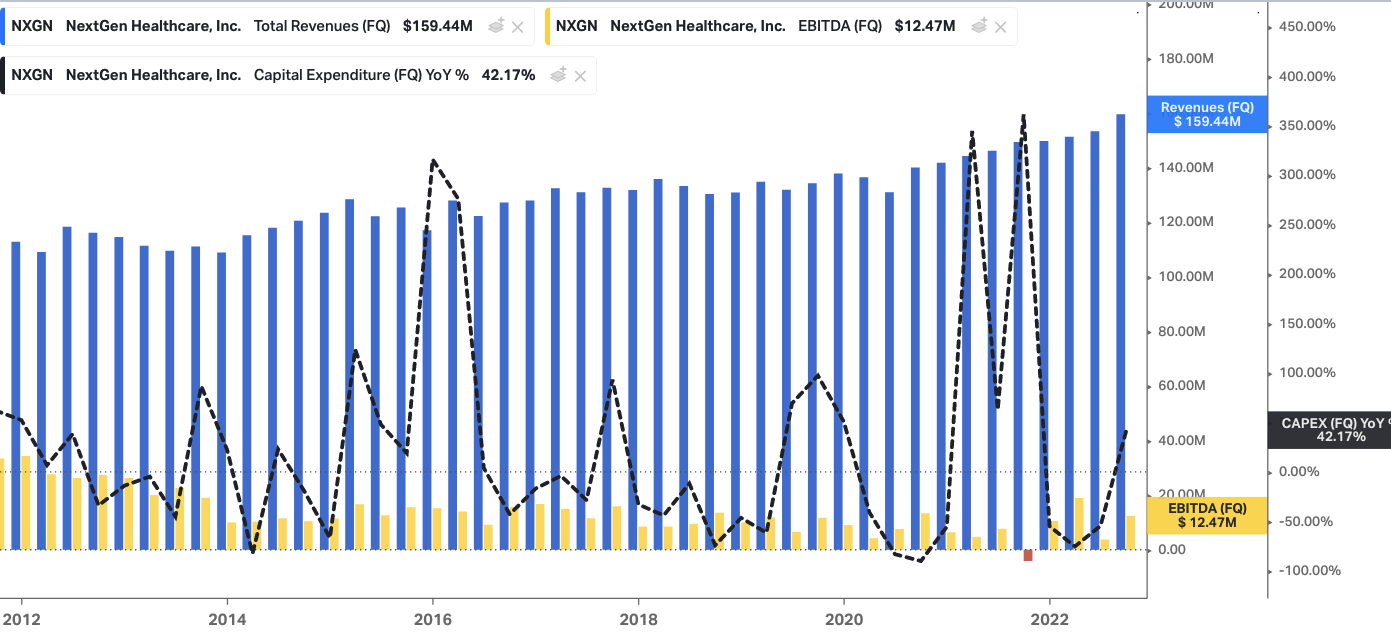
Looking at the value creation for shareholders, and we noted that EPS and FCF/share have held within range over the 10-year time frame as well. In fact, both measures have pushed above 5-year highs, demonstrating the company’s fundamental resiliency in an otherwise tight and costly market. Similar to above, the consistency in NXGN’s bottom-line fundamentals adds to the predictability of future cash flows, and gives certainty on the market’s equilibrium on its share price.
Exhibit 2. Resiliency in bottom-line fundamentals holding the line through several market cycles
Data: HBI, Refinitiv Eikon, Koyfin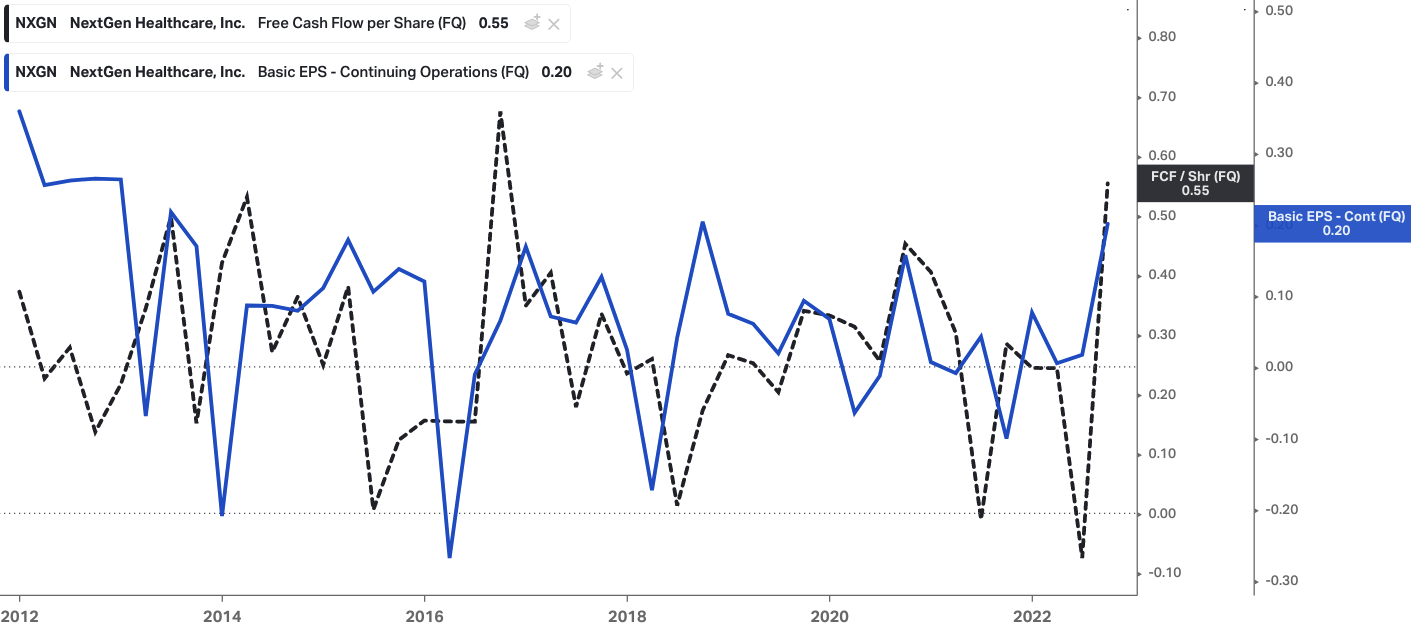
It would come as no surprise then, that, during the last two market cycles [pandemic era, bear market of FY22], that NXGN trades within range of longer-term support and resistance levels. Moreover, throughout the entirety of the past 8 years, there’s been strong accumulation of shares, evidenced by the long-term uptrend in on-balance volume. All this whilst holding a relatively low covariance to the benchmark.
The fact these patterns have been repeated for so long throughout the various distribution of market outcomes again adds that resiliency factor that a defensive, liquid diversifier that has uncorrelated alpha embedded into the risk/reward profile. You can see these characteristics below, [Exhibit 3] with special notice to the S&P 500’s correction back to NXGN’s longer-term range.
Exhibit 3. NXGN continues to hold repeated market patterns through various market cycles.
Data: Updata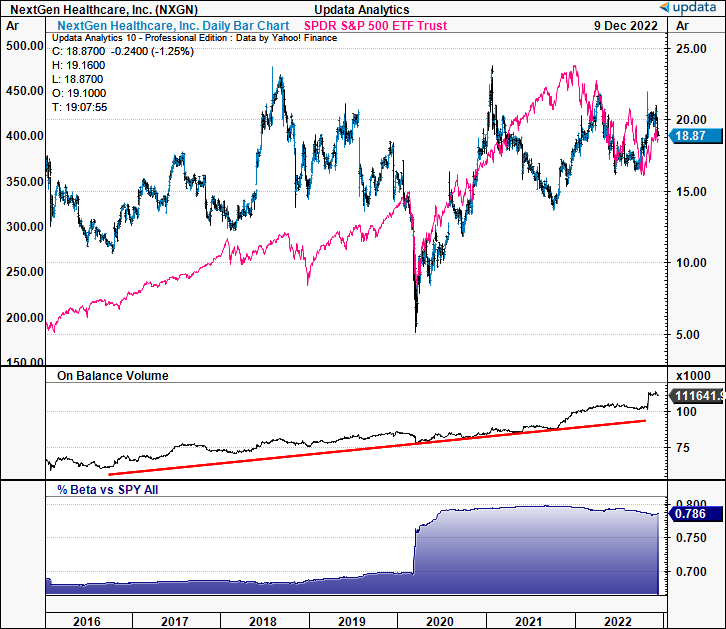
Market factors supportive as well
Turning to the available market data, we’ve found ample supportive evidence of our investment thesis.
First, you can see in Exhibit 4 that shares are wedging up in an ascending triangle. Difference from the last few attempts is the volume trend. We note the large spike above the average. Point is, there continues to be strong buying support for the stock, as mentioned.
Exhibit 4. NXGN Weekly price evolution since 2020
Data: Updata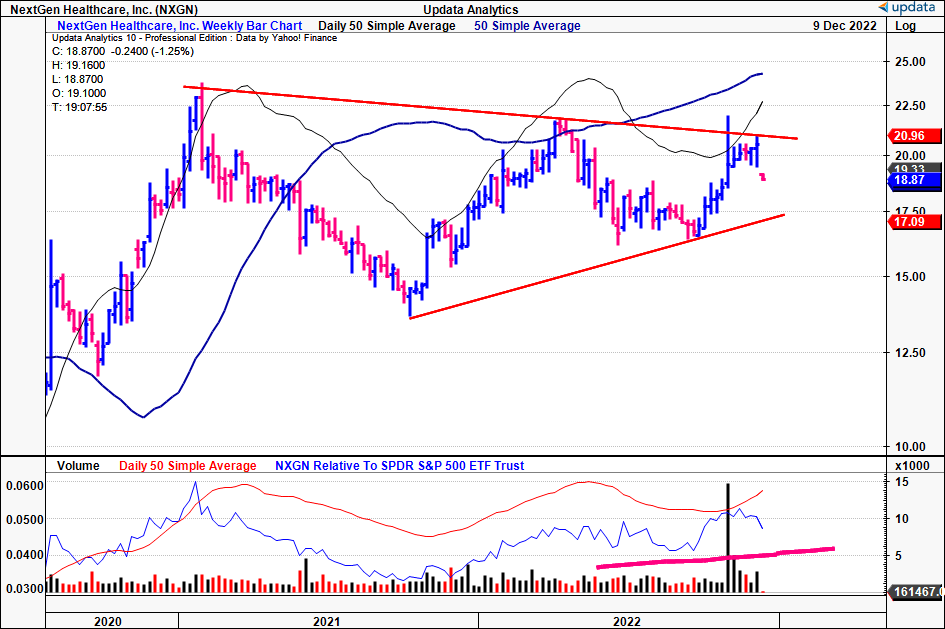
Looking at trend indicators, we see shares trading above cloud support, and this is bullish momentum for us. Again, the volume support is there with shorter-term on balance volume. This corroborates the direction and strength of the longer-term uptrend in our opinion.
Exhibit 5. Shares trading above cloud support with buyers in the market. It pulled back to range a few weeks back but has held the general sideways channel for the past 2 years.
Data: Updata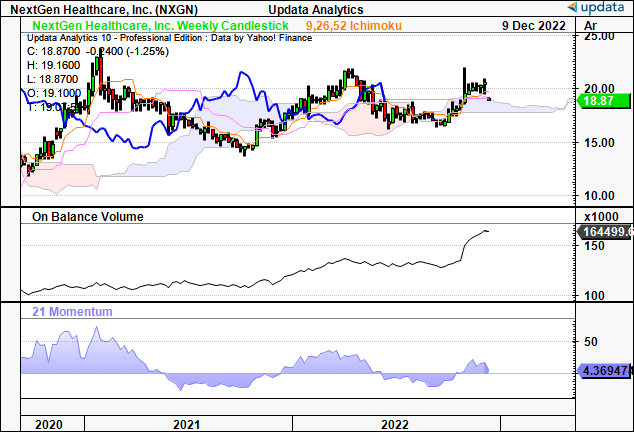
With respect to price targets obtained from the market data, you’ll notice that trading activity has been heavy in the stock since 2020 [Exhibit 6]. As a result, it has continued pushing back to pre-2020 ranges on the point and figure analysis below. As a result of the latest activity, we’ve got upside targets pushing above $22 up to $23. Price distribution has held above the longer-tern support lines shown. This corroborates our previous findings. It also suggests that, in the event of a broad market turndown, there is strong buying support to these levels – again, a resilient factor.
Exhibit 6. Multiple upside targets pointing to $22-$23
Data: Updata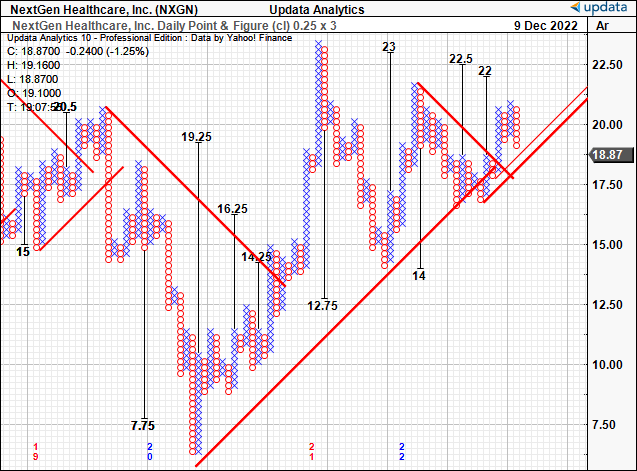
Portfolio Backtesting Illustrates thesis in action
We then checked NXGN’s inclusion into the equity risk budget of a balanced portfolio that’s performed well this year. If you believe the coming 6 months will resemble anything like the past, as we do, then the following tests have validity.
We constructed a series of equity focused, cross-asset portfolios with an equal weight across asset classes. From there, we included NXGN into the equity risk at various allocations.
We then regressed the series in a wide panel regression to observe each portfolio’s performance along the efficient frontier at a multitude of various weightings. This was performed against data from the nearly 12 months to date in 2022.
It was apparent to us from the results that a cash allocation NXGN had substantial benefits to immunizing downside volatility in a weighting of 16.66% down to 2% of the equity budget [Exhibit 7, 8].
In fact, baseline portfolio performed the best [shown by portfolio 2, below] with the highest total return and max drawdown of just 9.16%, standard deviation of 8.44%. Meanwhile, Sortino ratio was 0.05 and a beta of 0.78.
Exhibit 7.
Data: HBI, PortfolioVizualiser Data: HBI, PortfolioVizualiser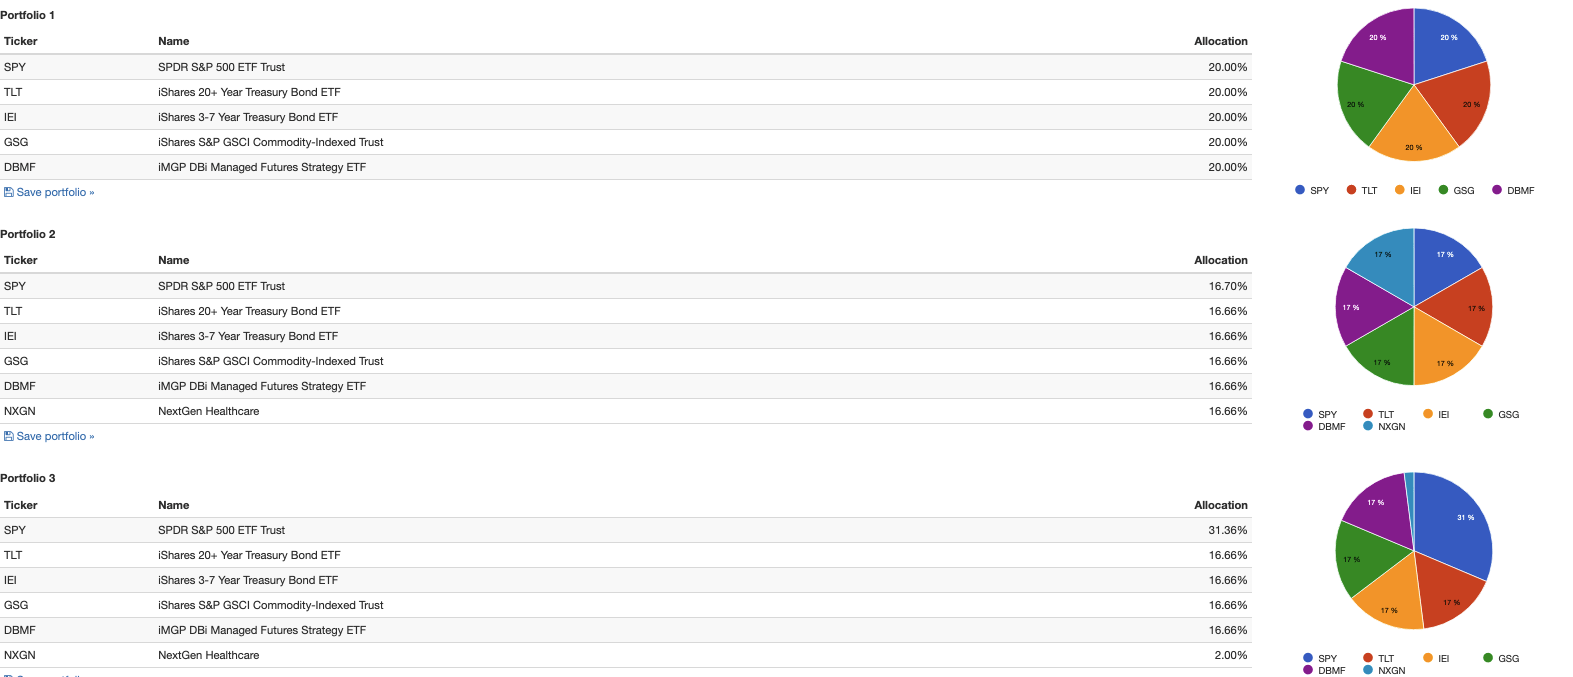

Exhibit 8. Portfolio testing time series
Data: HBI, PortfolioVizualiser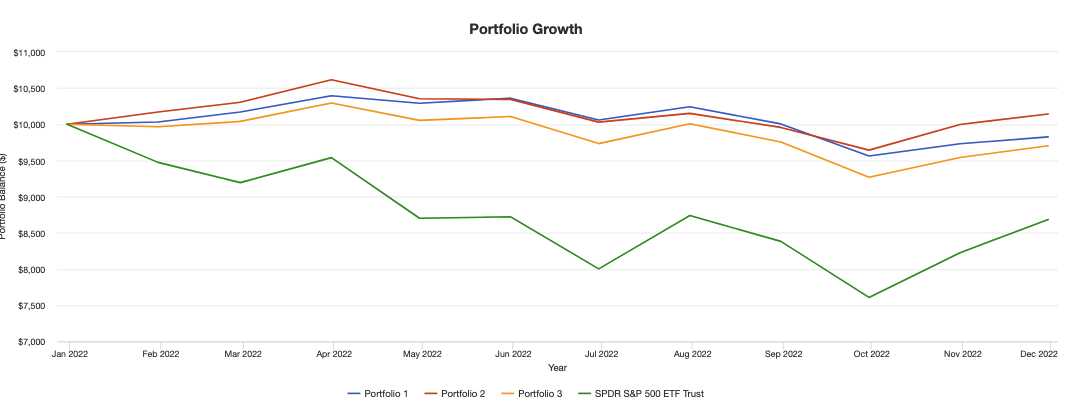
In short
Our longitudinal analysis of NXGN’s fundamental and technical data suggests that the inclusion of this stock in the equity risk budget of a balanced, cross-asset portfolio can help to reduce downside volatility.
The distribution of potential outcomes of its share price appears to offer an immunizing effect on the risk/reward ratio, by clamping equity beta and trading within a tight pricing range. Our findings indicate that a weighting of 2%-16.66% of the equity risk in a 5-asset, equal weight portfolio is sufficient to capitalize on the resilient properties of this stock. We also recommend diversifying the allocation to similarly resilient equities to generate a liquid, uncorrelated portfolio immunizer, providing optimal protection against market fluctuations. That being said, there is key risk to this thesis is NXGN does not conform to its previous market cycles. We would encourage investors to factor this in heavily to the investment debate.
Be the first to comment