

chonticha wat/iStock via Getty Images
By The Valuentum Team
In light of elevated geopolitical tensions stemming from the Ukraine-Russia crisis along with the sizable inflationary pressures seen in recent months, having exposure to the gold mining industry is desirable, in our view. Expectations that Newmont (NYSE:NEM) will grow its production base while reducing its per unit costs support its cash flow outlook. We continue to be big fans of Newmont and view its dividend growth outlook quite favorably in the current gold pricing environment.
For starters, Newmont’s recent merger with Goldcorp has facilitated material pre-tax run rate synergies, much higher than its original estimates. Additionally, Newmont’s Nevada JV with Barrick Gold (GOLD) may generate additional upside (the JV was established back in 2019). Newmont paid out a special dividend of $0.88 per share in 2019, and its core quarterly dividend has grown at a healthy clip since then. Newmont’s balance sheet strength has improved materially in recent years as management has allowed cash to build up on the company’s balance sheet, aided by Newmont’s impressive free cash flow generating abilities.
On the basis of our discounted cash flow valuation analysis, we value shares of Newmont Mining at $71 each, which is meaningfully above where shares are currently trading (~$60). As noted previously, we like its dividend quite a bit with the company boasting a Dividend Cushion ratio of 2 (the higher the ratio above 1, the better). We’ll talk more about the Dividend Cushion later in this article, showing how we come up with this ratio. Shares of Newmont yield a lofty ~3.6% at the time of this writing.
Newmont Mining’s Key Investment Considerations
The key investment considerations we look at with respect to Newmont Mining. (Valuentum)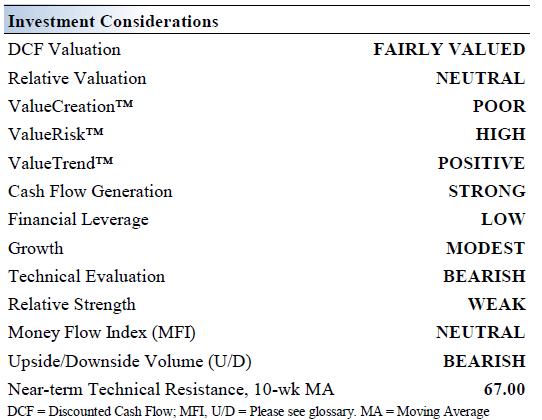
Newmont merged with Goldcorp in 2019 through an all-stock deal worth ~$10 billion. The enlarged gold miner has captured meaningful synergies. The lion’s share of its gold reserves and potential resources are located in the Americas and Australia. Newmont has exploration ventures on six continents searching for new gold resources to develop.
Newmont has captured hundreds of millions in run rate pre-tax synergies from the merger with Goldcorp thanks to G&A take-outs and supply chain efficiencies. Its credit rating was recently upgraded by S&P Global Ratings to a BBB+ from BBB with a stable outlook.
Newmont sees itself sitting on the largest gold reserves in the gold sector. The gold miner’s future rests on its ability to develop its existing resource base while utilizing exploration activities to uncover additional resources to develop. In 2019, Newmont Goldcorp entered into a JV with Barrick Gold to reduce costs at their Nevada mining operations.
Newmont expects its capital expenditures (sustaining plus development) will fall from ~$1.65 billion in 2021 to ~$1.1-$1.3 billion in 2025. This offers key support to its free cash flow generation in the out-years of our valuation model, supporting our fair value estimate. The company’s gold output is forecasted to grow marginally during this period while its other metals output (copper, zinc, lead, and silver) is expected to grow moderately.
Investing in a gold miner is largely a speculative bet on the direction of gold prices. The yellow metal exhibits many ‘greater fool’ tendencies in that it relies mostly on speculative demand for its price to move higher. That dynamic is unlikely to change. Right now, for example, gold futures have fallen to their lowest level since February, with many pointing to rising interest rates and a strong U.S. dollar as the most recent driver behind the weakness.
Newmont Mining’s Cash Flow Valuation Analysis
Newmont Mining has been a strong cash flow generator, supporting its dividend growth outlook. (Valuentum)
At the end of December 2021, Newmont had $5.0 billion in cash and cash equivalents on hand (excluding $0.1 billion in current ‘investments’ and $3.2 billion in non-current ‘investments’) versus $0.2 billion in short-term debt (inclusive of ‘current lease and other financing obligations’) and $5.6 billion in long-term debt. The firm’s $0.8 billion net debt position at the end of last year is manageable, in our view, given Newmont’s ample liquidity on hand and its nice free cash flow generating abilities in the current environment.
In 2021, Newmont generated $2.6 billion in free cash flow and spent $2.0 billion covering its total dividend obligations (dividends to common shareholders and distributions to noncontrolling interests) along with an additional $0.5 billion buying back its stock. These measures were fully funded by its free cash flows.
We think Newmont Mining is worth $71 per share with a fair value range of $46-$96. The margin of safety around our fair value estimate is driven by the firm’s HIGH ValueRisk rating, which is derived from an evaluation of the historical volatility of key valuation drivers and a future assessment of them.
Our near-term operating forecasts, including revenue and earnings, do not differ much from consensus estimates or management guidance. Our model reflects a compound annual revenue growth rate of 3.1% during the next five years, a pace that is lower than the firm’s 3-year historical compound annual growth rate of 19%. We’re being somewhat conservative with our growth rates given the volatile nature of gold prices.
Our valuation model reflects a 5-year projected average operating margin of 31.8%, which is above Newmont Mining’s trailing 3-year average. We think cost take-outs will continue. Beyond year 5, we assume free cash flow will grow at an annual rate of 0.1% for the next 15 years and 3% in perpetuity. For Newmont Mining, we use a 9.6% weighted average cost of capital to discount future free cash flows.
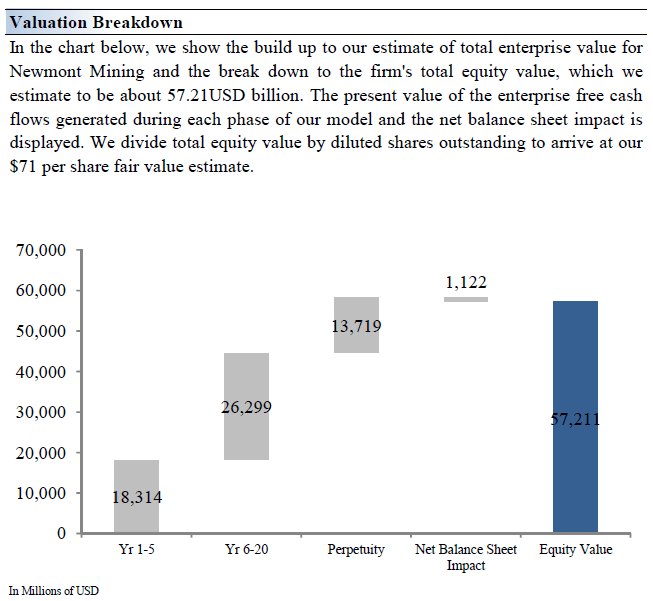
The summary valuation assumptions within our discounted cash flow model for Newmont Mining. (Valuentum) The valuation breakdown that shows the duration of value composition for Newmont. (Valuentum)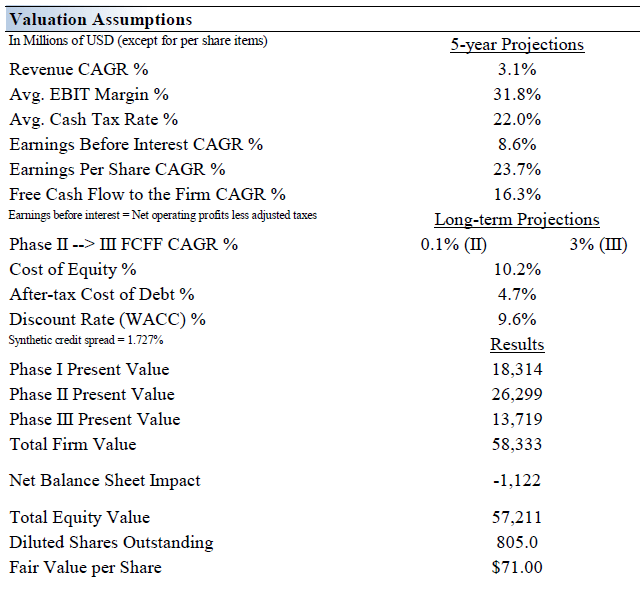
Newmont’s Margin of Safety Analysis
The margin of safety we ascribe to our fair value estimate of Newmont. The highest point on the distribution is the most likely ‘true’ fair value for Newmont. (Valuentum)
Our discounted cash flow process values each firm on the basis of the present value of all future free cash flows. Although we estimate the firm’s fair value at about $71 per share, every company has a range of probable fair values that’s created by the uncertainty of key valuation drivers (like future revenue or earnings, for example). After all, if the future were known with certainty, we wouldn’t see much volatility in the markets as stocks would trade precisely at their known fair values.
This is an important way to view the markets as an iterative function of future expectations. As future expectations change, so should the company’s value and its stock price. Stock prices are not a function of fixed historical data but rather act in such a way to capture future expectations within the enterprise valuation construct.
Our ValueRisk rating sets the margin of safety or the fair value range we assign to each stock. In the graph above, we show this probable range of fair values for Newmont Mining. We think the firm is attractive below $46 per share (the green line), but quite expensive above $96 per share (the red line). The prices that fall along the yellow line, which includes our fair value estimate, represent a reasonable valuation for the firm, in our opinion.
Newmont’s Variable Dividend Policy
Newmont provides an overview of its variable dividend program in the upcoming graphic down below, which is based primarily on where the price of gold is trading and how that impacts its incremental free cash flows over a certain gold pricing threshold. Last year, Newmont had an average realized gold selling price of $1,788 per troy ounce, which is below where near-term gold futures are trading at as of this writing. Expectations that Newmont’s production levels will grow while its per unit production costs shift lower in the medium-term combined with the uplift provided by rising gold prices support Newmont’s cash flow outlook, though we caution that its capital expenditure expectations are also rising in the medium term.
An overview of Newmont’s variable dividend program. (Newmont – March 2022 IR Presentation) The Dividend Cushion Cash Flow Bridge (Valuentum)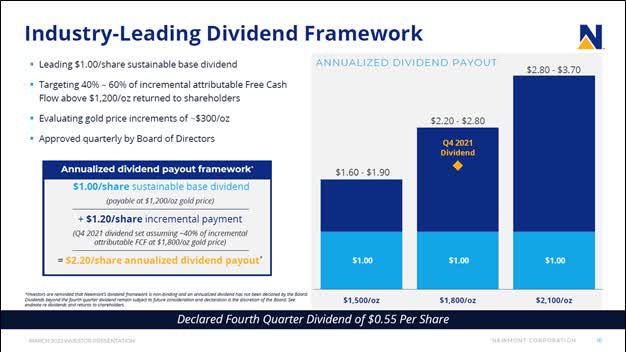
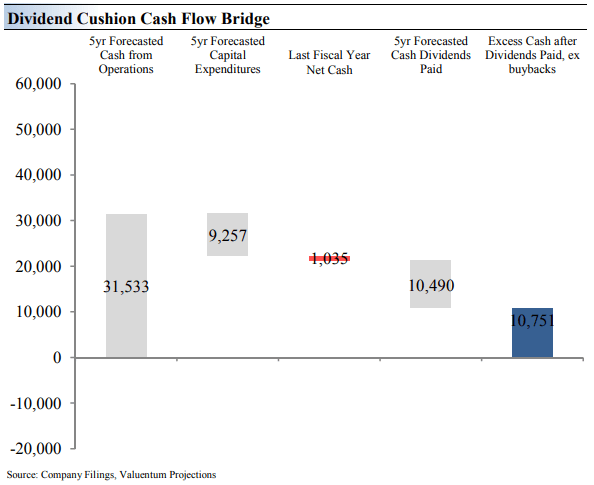
The Dividend Cushion Cash Flow Bridge, above, illustrates the components of the Dividend Cushion ratio and highlights in detail the many drivers behind it. Newmont Mining’s Dividend Cushion Cash Flow Bridge reveals that the sum of the company’s 5-year cumulative free cash flow generation, as measured by cash flow from operations less all capital spending, plus its net cash/debt position on the balance sheet, as of the last fiscal year, is greater than the sum of the next 5 years of expected cash dividends paid. Because the Dividend Cushion ratio is forward-looking and captures the trajectory of the company’s free cash flow generation and dividend growth, it reveals whether there will be a cash surplus or a cash shortfall at the end of the 5-year period, taking into consideration the leverage on the balance sheet, a key source of risk. On a fundamental basis, we believe companies that have a strong net cash position on the balance sheet and are generating a significant amount of free cash flow are better able to pay and grow their dividend over time. Firms that are buried under a mountain of debt and do not sufficiently cover their dividend with free cash flow are more at risk of a dividend cut or a suspension of growth, all else equal, in our opinion. Generally speaking, the greater the ‘blue bar’ to the right is in the positive, the more durable a company’s dividend, and the greater the ‘blue bar’ to the right is in the negative, the less durable a company’s dividend.
Dividend Cushion Ratio Deconstruction (Valuentum)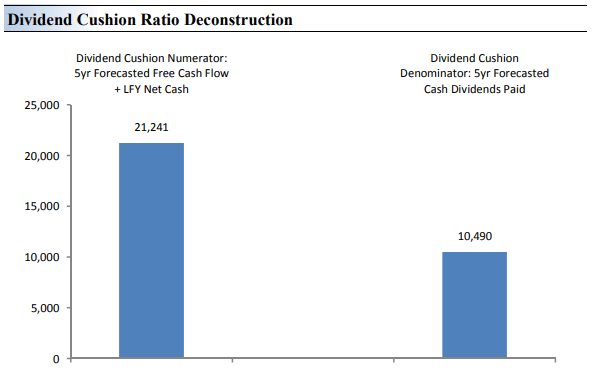
The Dividend Cushion Ratio Deconstruction above reveals the numerator and denominator of the Dividend Cushion ratio. At the core, the larger the numerator, or the healthier a company’s balance sheet and future free cash flow generation, relative to the denominator, or a company’s cash dividend obligations, the more durable the dividend. In the context of the Dividend Cushion ratio, Newmont Mining’s numerator is larger than its denominator suggesting strong dividend coverage in the future. The Dividend Cushion Ratio Deconstruction image puts sources of free cash in the context of financial obligations next to expected cash dividend payments over the next 5 years on a side-by-side comparison. Because the Dividend Cushion ratio and many of its components are forward-looking, our dividend evaluation may change upon subsequent updates as future forecasts are altered to reflect new information.
Concluding Thoughts
Newmont took advantage of strong gold prices seen in recent years to restore its balance sheet strength, though the firm’s total debt load is still quite sizable. At the end of March 2022, Newmont had a net debt-to-adjusted EBITDA ratio of ~0.3x, however, which isn’t poor by any stretch. Its dividend obligations have become significantly larger since 2019 in the wake of numerous payout increases, though its impressive free cash flow generating abilities and relatively modest net debt load underpin its stellar Dividend Cushion ratio.
As we wrap up, it’s worth reiterating that Newmont and its dividend are exposed to fluctuations in gold prices, which can be unpredictable at times, and operational execution will be key to keep things moving in the right direction. However, with a Dividend Cushion ratio of ~2, there isn’t much that could stop the firm from growing its dividend going forward, in our opinion. With shares trading at ~$60 each, our fair value estimate implies there may be more upside potential for those seeking capital appreciation with their dividend growth considerations. Newmont is our favorite gold miner, and we think the firm should be on your radar. Shares pay a very nice dividend yield of ~3.6%.
This article or report and any links within are for information purposes only and should not be considered a solicitation to buy or sell any security. Valuentum is not responsible for any errors or omissions or for results obtained from the use of this article and accepts no liability for how readers may choose to utilize the content. Assumptions, opinions, and estimates are based on our judgment as of the date of the article and are subject to change without notice.
Be the first to comment