

New Zealand Dollar Talking Points
NZD/USD appeared to be on track to test the 50-Day SMA (0.6738) as it cleared the opening range for February, but recent price action casts a bearish outlook for the exchange rate as it extends the series of lower highs and lows from the monthly high (0.6733).
New Zealand Dollar Under Pressure After Testing Former Support
NZD/USD falls back from the former support zone around the December low (0.6701) as the larger-than-expected rise in the US Consumer Price Index (CPI) generated a bullish reaction in the Greenback, and the US Dollar may continue to outperform against its New Zealand counterpart as the Russia-Ukraine tensions appear to be triggering a flight to safety.
At the same time, developments coming out of the US may sway NZD/USD as the Retail Sales report is anticipated to show sharp rebound in private-sector consumption, with household spending expected to increase 2.0% after contracting 1.9% in December.
A positive development may spur a bullish reaction in the US Dollar as the Federal Reserve prepares to normalize monetary policy, and it remains to be seen if the Federal Open Market Committee (FOMC) Minutes will reveal a further adjustment in the forward guidance for monetary policy as the central bank emphasizes that “the federal funds rate is our primary means of adjusting monetary policy and that reducing our balance sheet will occur after the process of raising interest rates has begun.”
In turn, the advance from the January low (0.6529) may continue to unravel as NZD/USD falls back from the former support zone around the December low (0.6701), while the tilt in retail sentiment looks poised to persist as traders have been net-long the pair since mid-November.
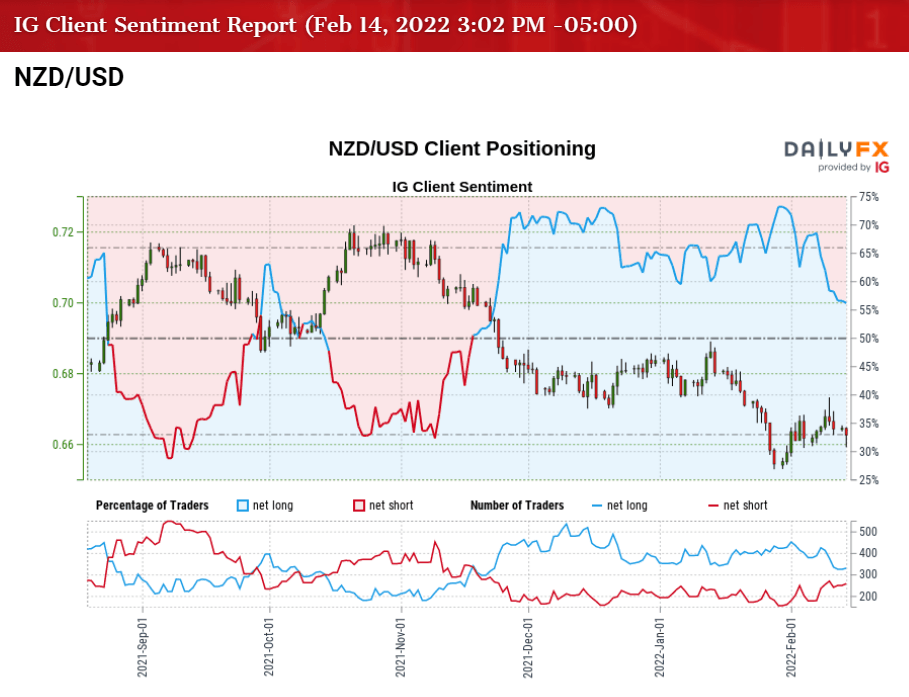
The IG Client Sentiment report shows 56.48% of traders are currently net-long NZD/USD, with the ratio of traders long to short standing at 1.30 to 1.
The number of traders net-long is 15.74% higher than yesterday and 7.41% lower from last week, while the number of traders net-short is 16.06% higher than yesterday and 16.06% higher from last week. The decline in net-long position comes as NZD/USD extends the series of lower highs and lows from the monthly high (0.6733), while the rise in net-short position has helped to alleviate the crowding behavior as 61.94% of traders were net-long the pair last week.
With that said, the rebound from the January low (0.6529) may turn out to be a correction in the broader trend as the former support zone around the December low (0.6701) appears to be acting as resistance, and the shift in risk appetite along with expectations for an imminent change in Fed policy may keep NZD/USD under pressure as the US Dollar benefits from the flight to safety.
NZD/USD Rate Daily Chart
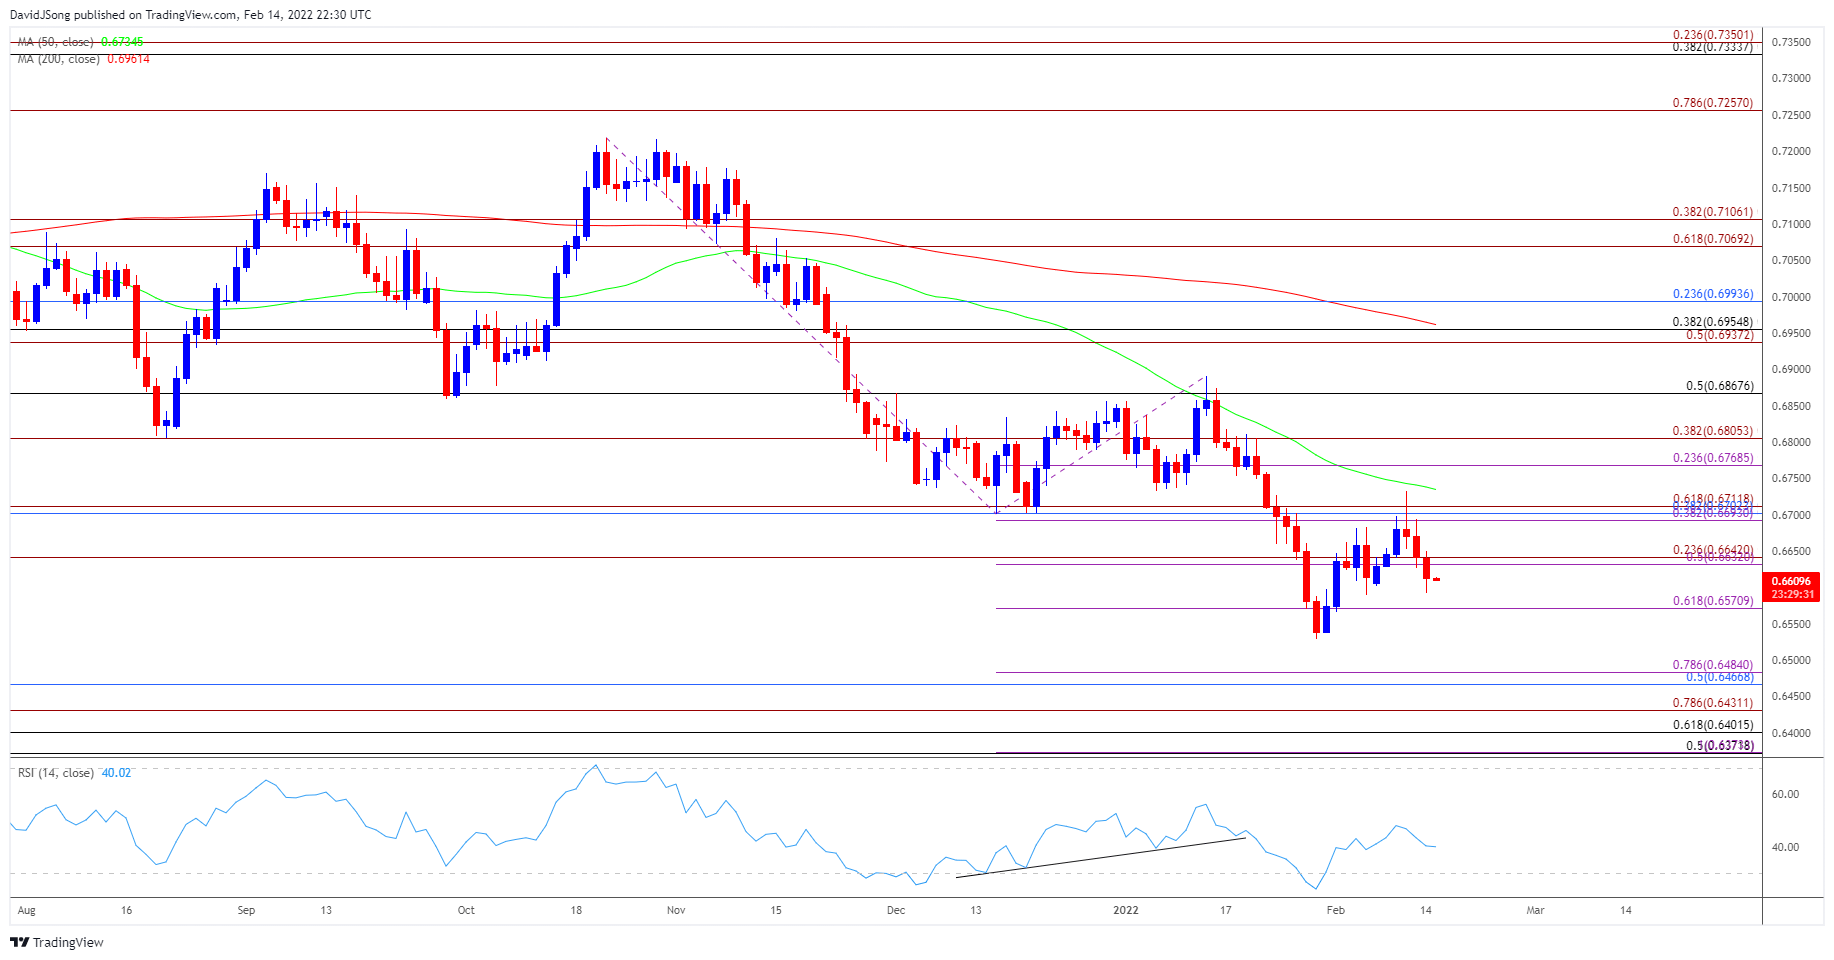
Source: Trading View
- NZD/USD reversed ahead of the September 2020 low (0.6512) as advance from the January low (0.6529) pulled the Relative Strength Index (RSI) out of oversold territory, but the recovery may turn out to be a correction in the broader trend as the former support zone around the December low (0.6701) appears to be acting as resistance.
- NZD/USD extends the series of lower highs and lows from the monthly high (0.6733) following the failed attempt to close above the Fibonacci overlap around 0.6690 (38.2% expansion) to 0.6710 (61.8% expansion), with the break/close below the 0.6630 (50% expansion) to 0.6640 (23.6% expansion) region opening up the 0.6570 (61.8% expansion) area.
- A break of the January low (0.6529) brings the September 2020 low (0.6512) back on the radar, with the next region of interest coming in around 0.6470 (50% retracement) to 0.6480 (78.6% expansion).
— Written by David Song, Currency Strategist
Follow me on Twitter at @DavidJSong
Be the first to comment