

Bet_Noire/iStock via Getty Images
New Jersey Resources (NYSE:NJR) is an energy services holding company. It has regulated and non-regulated operations. New Jersey Natural Gas is a regulated utility that delivers natural gas to 570,000 customers in New Jersey. The NJR non-regulated operations include retail gas supply and solar investments, primarily in New Jersey. Furthermore, NJR has equity investments in several large midstream gas projects.
As a quick overview
NJR remains a largely regulated utility provided, with much of the net financial earnings per share derived from the New Jersey Natural Gas utility (Figure 1). In the Q3 earnings presentation, NJR notes that the utility added 1695 customers during the quarter. However, there is also a reasonable level of earnings from the Clean Energy Ventures (for example, with over 675MW of projects under construction or contract through to 2027). The Adelphia Gateway for storage and transportation should be on track to reach completion soon.
Together, these sources of revenue provide a reasonably diversified gas utility option with good growth potential.
Figure 1. NJR’s fiscal 2022 NFEPS guidance, by segment (Q3 Earnings Presentation)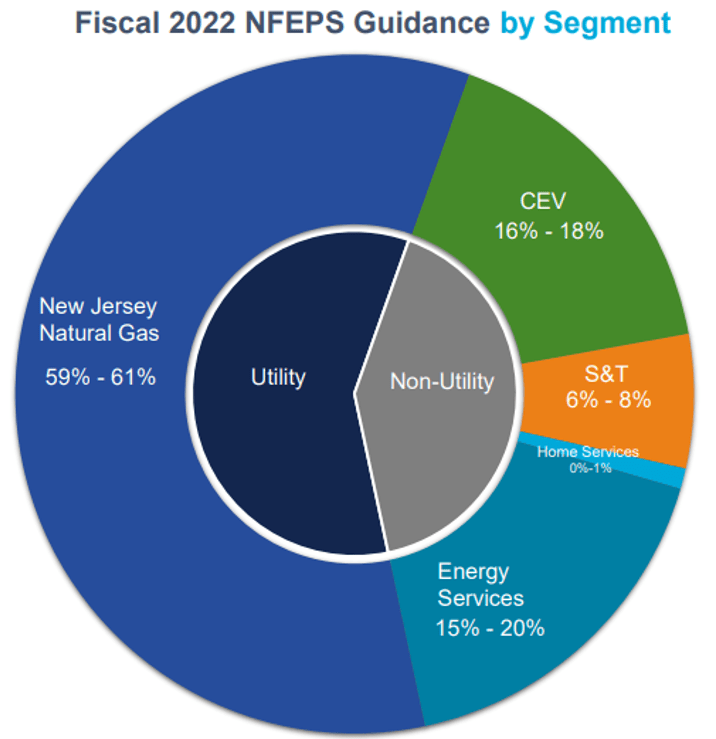
Recent results and operations
NJR released news a couple of weeks ago that its quarterly dividend would be raised from $0.36 per share quarterly to $0.39, a 7.6% increase. A raised dividend is often a safe one, as we might assume that a raise would be tempered or avoided if there were future financial concerns.
On the Q3 earnings call in early August, they noted:
As a result, we are increasing our previously announced guidance for fiscal 2022 by $0.10. This marks our second guidance increase for this year. To summarize a few highlights, New Jersey Natural Gas added nearly 1,700 new customers. In July, Clean Energy Ventures placed an 8-megawatt project into service. Energy Services reported significant improvement in NFE in the third quarter as a result of our asset management agreement.
NJR notes that the NFEPS expects to grow by 7% to 9%, along with the dividend.
Concerns to monitor for NJR
While I fundamentally like this company, I note that they have had several recent years with declining sales figures, coupled with several years now of steadily increasing long-term debt levels. Heading into more tricky economic periods, this type of additional leverage is probably going to seem manageable now but will, I expect, begin to bite and force allocation decisions later that may limit the long-term dividend increases.
What does this mean for NJR? The debt level has lifted considerably since 2015 (Figure 2). The impact since 2020 has also lifted the financial debt-to-equity ratio to a level higher than any in the last twenty years. I suspect they may have used the 202 and 2021 issuances, with long-term maturities, and taken advantage of the favorable rates, as suggested in the 2021 annual report. It does, however, leave them in a position with a more sizable long-term debt than they had previously, but also with the opportunity to continue to invest and diversify their revenue further in the future.
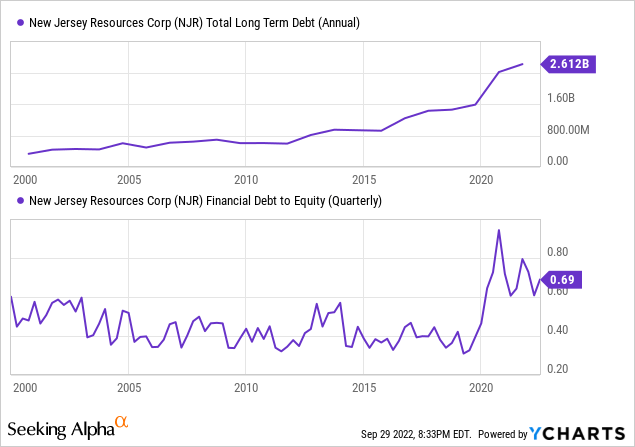
Figure 2. Visualizations of debt and debt to equity highlighting my concerns (Source: YCharts)
Income and dividend opportunities when investing in NJR
I often look at utilities for reasonable income and lower volatility. Seeking Alpha gives NJR a Dividend Safety score of “B-” and growth of “B+” with a strong “A+” for consistency. These values seem reasonable, but the safety score of “B-” is one to monitor if the dividend income from utilities will be important as a core part of the portfolio. NJR expects to continue to grow the dividend by 7% to 9% (Source: Q3 earnings presentation). Whether this is achievable depends, in part, on the management of the long-term debt levels.
Evaluating NJR relative to peers
To evaluate the valuation of NJR relative to peers and to get a sense of the income and value opportunity here, I’ve selected other comparable peers in gas utilities, with a fairly comparable set of companies:
- Chesapeake Utilities (CPK)
- New Fortress Energy (NFE)
- NiSource Inc (NI)
- Northwest Natural Holding Company (NWN)
- ONE Gas, Inc. (OGS)
- RGC Resources, Inc. (RGCO)
- Southwest Gas Holdings (SWX)
- Spire Inc. (SR)
- UGI Corp. (UGI)
From this list, how does NJR stack up against the peers in terms of valuation? In general, NJR remains reasonably valued and appears to have been less affected, perhaps, by the recent market sell-offs (Table 1). The EV/Sales (trailing 12 months) puts it below the middle of the pack; the P/S and P/E ratios are slightly below the averages as well. The EV/EBITDA remains slightly elevated and NJR is one of the more richly valued firms amongst its peers on this metric.
Table 1. NJR relative to peers in terms of valuation metrics.
| Ticker | EV / Sales (‘TTM’) | EV / EBITDA | P/S | P/E |
| RGCO | 3.9 | -22.3 | 2.2 | – |
| SWX | 2.4 | 13.8 | 1 | 30.5 |
| OGS | 3.6 | 15.2 | 1.7 | 18.4 |
| NJR | 2.6 | 14.4 | 1.4 | 17.5 |
| NWN | 3.1 | 11 | 1.5 | 18.6 |
| SR | 3.5 | 12.1 | 1.5 | 16.5 |
| NFE | 6.7 | 35.9 | 4.6 | 43.2 |
| NI | 4.1 | 11.2 | 2.1 | 17 |
| CPK | 4.5 | 13 | 3.3 | 23.5 |
| UGI | 1.4 | 4.9 | 0.7 | 5.2 |
| Summary | 3.6 | 10.9 | 1.6 | 21.5 |
Source: Author, with data from Stock Rover
Is it a good option? The dividend yield is marginally over the peers with the five-year DGR being about average for the group (Table 2). The Piotroski F-Score is one I often rely on to get a quick assessment of how the firm is doing. The score of 6 is on average and a good score, providing some assurances, particularly coupled with the ROIC values of 6.2%, above the average for the peers.
Table 2. NJR relative to peers in terms of dividend and ROIC
| Ticker | Div. Yield | Div. 5Y Avg (%) | Piotroski F Score | ROIC |
| RGCO | 3.7% | 6.1% | 4 | -6.7% |
| SWX | 3.5% | 4.6% | 3 | 3.3% |
| OGS | 3.4% | 8.1% | 6 | 4.1% |
| NJR | 3.7% | 5.9% | 6 | 6.2% |
| NWN | 4.3% | 0.5% | 5 | 5.0% |
| SR | 4.3% | 5.5% | 6 | 4.7% |
| NFE | 0.9% | – | 7 | 6.0% |
| NI | 3.6% | 6.1% | 6 | 5.8% |
| CPK | 1.8% | 10.5% | 6 | 7.0% |
| UGI | 4.4% | 7.6% | 6 | 13.2% |
| Summary | 3.4% | 6.1% | 6 | 4.9% |
Source: Author, with data from Stock Rover
Valuation of New Jersey Resources and my thoughts on the investment opportunity
To assess investment opportunities and the impact of the present valuation, I frequently use FAST Graphs as it brings in analysts’ estimates of earnings allowing future projects of returns. We can use a target P/E multiple to assess likely returns if prices achieve the required level for the multiple. The estimated price based on the projected earnings then enables us to evaluate the rate of return. For this approach to be useful, we need reasonable P/E multiples and analysts’ estimates.
To assess the likelihood of analysts’ estimates being accurate, we can turn to the FAST Graphs’ analyst scorecard which shows that the analysts’ two-year forward estimate (with a 20% margin for error) is a hit 75% of the time, a beat 25% of the time, with no misses. The one-year forward estimate is a beat 23% of the time, a hit 77% of the time, with no misses. This level of accuracy from analysts shows the stability of the company and the effectiveness with which the earnings can be estimated. Further, we can examine the lower panel in Figure 3 to get a sense of how the consensus estimate has changed over the prior six months. The stability in these changes again provides assurance of the reliability of these earnings estimates, coupled with the historic proportion of times that NJR has beat estimates, giving us a sense that the estimates are going to be conservative and reasonable.
We can use the FAST Graphs forecasting calculator to assess the likely future returns (Figure 3). If we take the September 2024 as the target, and consider the valuation assessments provided earlier, we can select a reasonable P/E multiple we might expect in 2024. Given that NJR is, in my mind, a well-run utility, but the market has been volatile and NJR has some challenges with debt, I’ve opted to use what I think is a conservative 15x P/E as a target for 2024. The ‘normalized’ P/E provided by FAST Graphs of 19.11x, as achieved over the last five years, appears too high in the present environment. A 15x would, therefore, be a solid and reasonable multiple for this utility.
At the 15x multiple, we might expect relatively low levels of price appreciation and most of the gain coming through dividends. The FAST Graphs forecasting calculator (Figure 3) suggests a 9.82% total rate of return until the end of September 2024 or a total annualized RoR of 4.79%. This is going to be largely driven by the expectation of 9.35% improvement in the earnings through to the end of September 2024.
Figure 3. Analysts’ estimates and a 15x P/E used to calculate a target price and the rate of return for an investment in New Jersey Resources (FAST Graphs)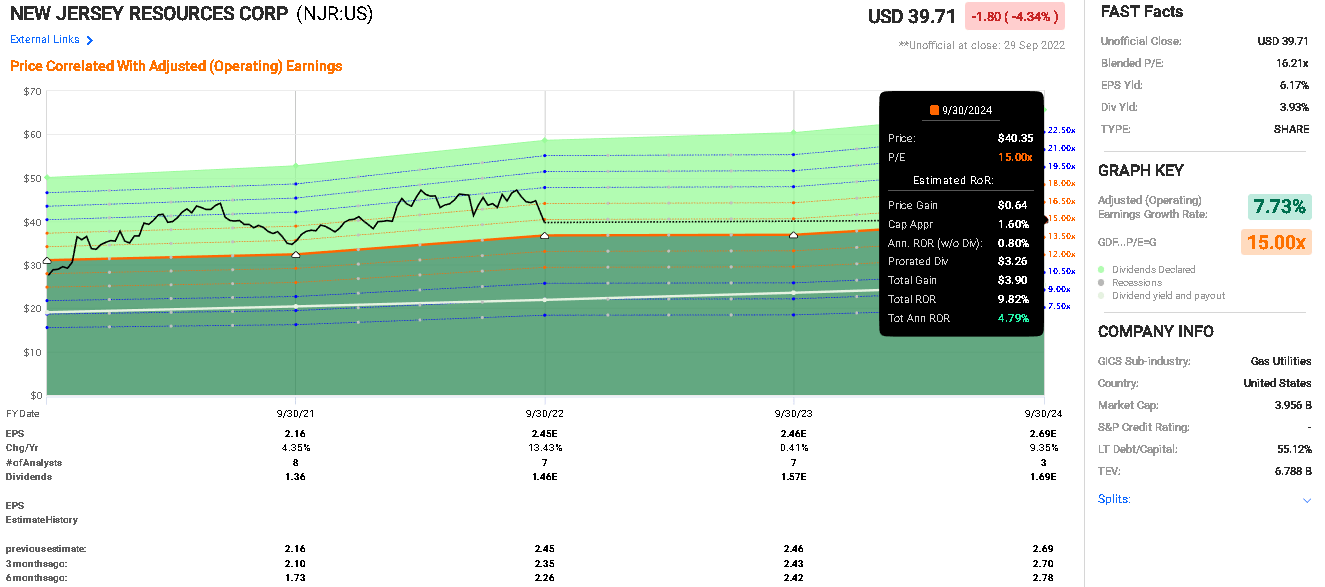
As a check, Finbox.io reports eight analysts following New Jersey Resources with an average target of $46.63 and a range from $41 (marginally above the present price) through to $56. Given the consistently optimistic nature of the analysts’ targets and taking the lower end of the range as a reasonable target, it suggests that the present price has some upside potential but is more or less reasonably priced.
For new investors, a better entry point at a lower price with a higher dividend yield and more upside potential is worth waiting for. Entering at a lower price will allow the investor to participate more fully in NJR’s growth as it increases its earnings.
To evaluate the potential downside, there have been a few times where the P/E has declined far below the 15x level (Figure 4). Most notably was two years ago in 2020, when the multiple hit about 12.85x. Using the FAST Graphs forecasting calculator, if we expected a 12x multiple in September 2024, it would imply a total RoR of -10.5% or an annualized RoR of -5.4%. This seems to be an extreme case, suggesting a reasonable margin of safety here against precipitous declines at this price, but with the potential for better prices in the coming months if prices continue to decline further.
As a final check of the potential downside, I used the lower EPS estimates from Finbox.io and a 12x P/E multiple to project (with the FAST Graphs forecasting calculator) a potential downside of -12.24% RoR to September 2024, or an annualized RoR of -6.3%.
Figure 4. NJR historical performance of price and earnings, showing the steady compounding nature of both earnings and dividends (FAST Graphs)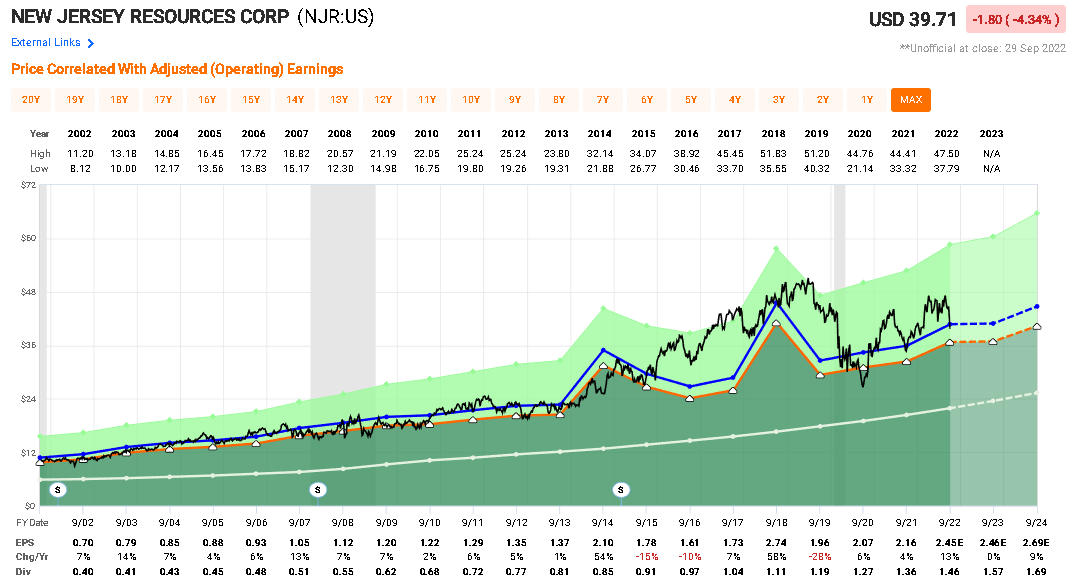
A summary of my thoughts on New Jersey Resources
I have included a summary section that might be useful when my thoughts were for a Hold or tentatively edging into a Buy or Sell.
Business: Solid business with strong revenue growth. Some concerns around debt levels going forward.
Valuation: Good margin of safety as it remains reasonably valued. Little opportunity here for upside. If P/E multiples return to more reasonable levels, this will deliver capital losses. Presently below the lower end of analysts’ price targets, representing a reasonable opportunity.
Financial safety: Secure financial position and operations in regulated sectors.
Dividend: A reasonable 3.7% yield is about the average amongst peers with average DGRs and a strong historical record for dividend increases.
My investment thesis for New Jersey Resources
When I started looking at NJR, I thought that this would be a conservative hold. While my analysis has strengthened my belief that this is a strong pick, I remain concerned about the debt levels in this investment environment, and I suspect that the valuation opportunity may improve, though I note there is limited likely downside risk here based on historical perspectives (Figure 4).
For these reasons, I suggest that investors already in New Jersey Resources continue to Hold this investment.
For investors considering adding NJR to the portfolio, consider adding this firm to the watch list and there is the potential to start a position here if you are comfortable with some further downside risk. However, given the present environment, prices may decline further, presenting better buying opportunities closer to 15x P/E multiples.
Be the first to comment