

USD/JPY ANALYSIS
JAPANESE YEN FUNDAMENTAL BACKDROP
The Yen has been steadily depreciating against the U.S. Dollar since late April 2021, as the greenback continues to climb on the back of favorable fundamental factors. This makes the Yen one of the worst performing currencies against the dollar year-to-date (see comparison chart below).
Source: Reuters
USD/JPY has also been reacting to the recent rise in treasury yields which is showing resolve in its persistent grind higher. With the Yen being the most correlated G10 currency to U.S. treasury yields, this is always a key metric to consider when analyzing JPY pairs.
USD/JPY ECONOMIC CALENDAR
Earlier this week Japanese unemployment data was worse than expectations (2.8%) as actual figures printed at 3% which supplemented the JPY decline. The rest of the week is firmly fixated on U.S. PMI data as well as Friday’s Non-Farm Payrolls (NFP). Both sets of data have held significant influence over financial markets this year but after much talk around the importance of sustained positive jobs data, any deviation from estimates may result in large price swings on the USD/JPY pair. Proper risk management should be incorporated on all open positions as an increase in volatility pre and post-NFP is expected.
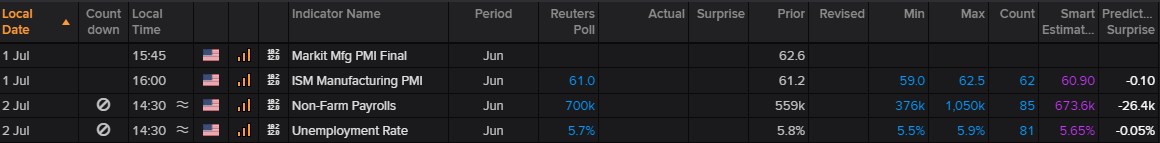
Source: Refinitiv
USD/JPY TECHNICAL ANALYSIS
USD/JPY Weekly Chart:
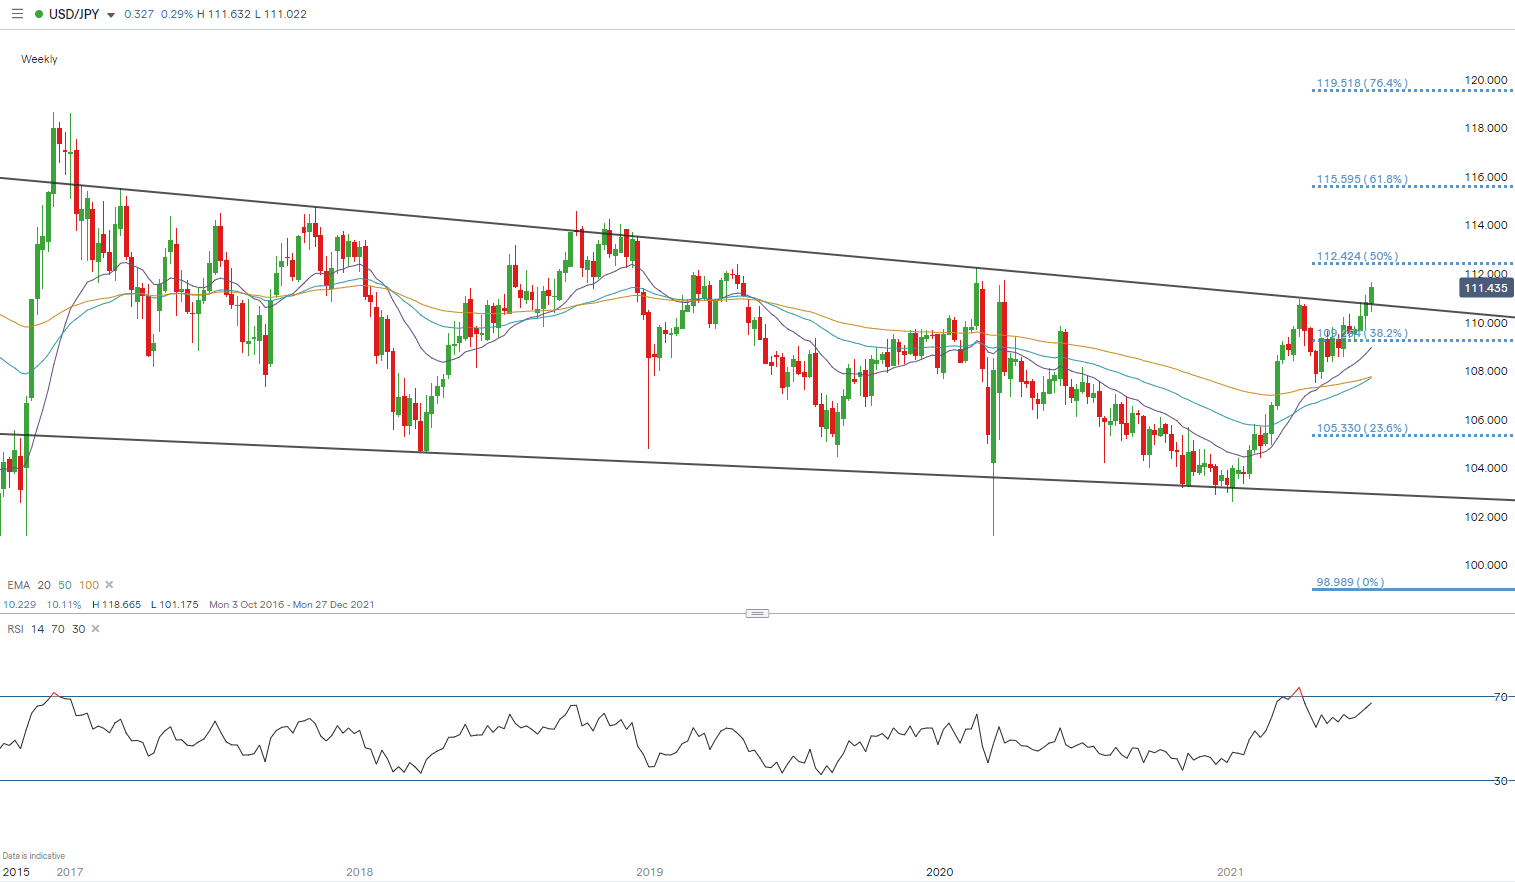
Chart prepared by Warren Venketas, IG
The long-term trendline resistance (black) on the weekly USD/JPY chart has been breached this week but will only be confirmed as a breakout should the weekly candle close above resistance. With upcoming economic announcements, there may still be room for a pullback within the resistance zone.
The Relative Strength Index (RSI) indicates possible bearish divergence as USD/JPY pushes higher while the RSI shows slowing bullish momentum. Divergence simply refers to the opposing movement between price action and the RSI.
USD/JPY Daily Chart:
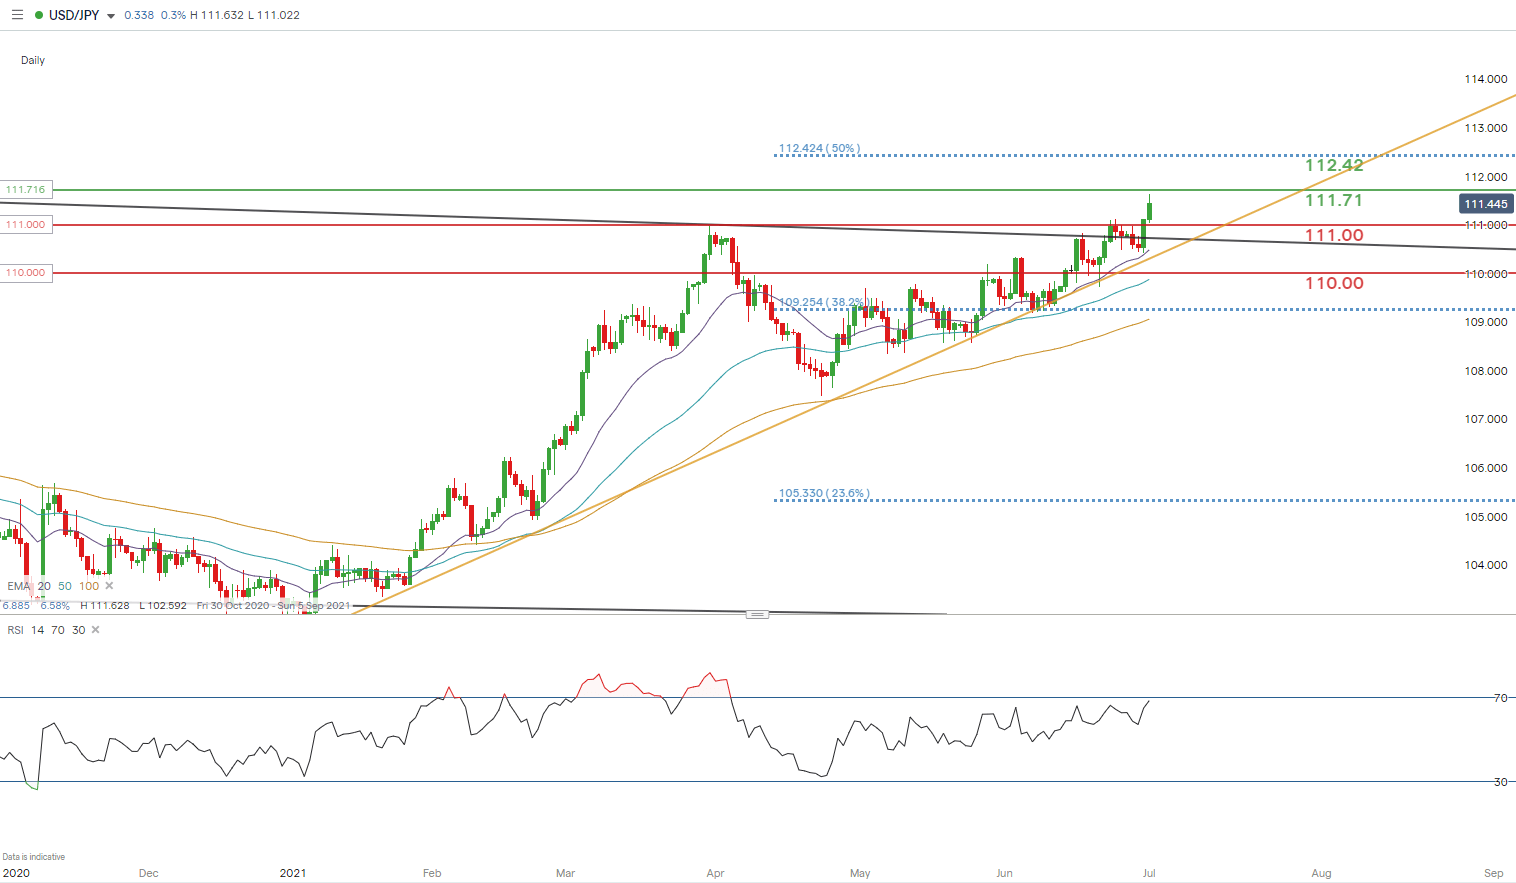
Chart prepared by Warren Venketas, IG
Fixing in on the daily chart we notice dollar bulls pushing toward the March 2020 swing high at 111.71 after the 111.00 psychological breach. Should the swing high be cleared, the 50% Fibonacci resistance zone at 112.42 will serve as a subsequent target.
From the bearish perspective, the 111.00 key level will provide initial support. The daily RSI echoes the weekly RSI with the March 2021 high printing higher than current levels – bearish divergence.
IG CLIENT SENTIMENT DOES NOT FAVOR BULLS NOR BEARS
IGCS shows retail traders are currently net short on USD/JPY, with 60% of traders currently holding short positions (as of this writing) however, traders are further net-long than yesterday and last week, and the combination of current sentiment and recent changes gives us a mixed bias.
— Written by Warren Venketas for DailyFX.com
Contact and follow Warren on Twitter: @WVenketas
Be the first to comment