

PeopleImages
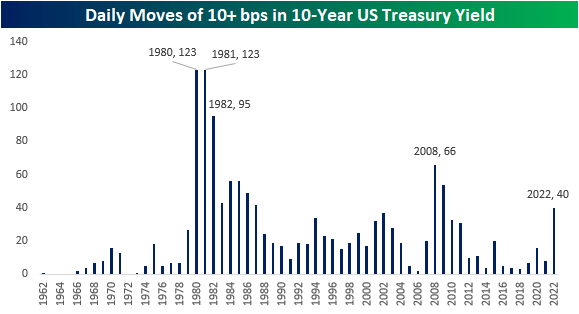
The 10-year is having another one of those days. After trading up near 4.3% intraday yesterday, the yield got as low as 4.05% this morning and is currently resting at 4.09% for a decline of 14 basis points on the day. In a normal year, we’d be talking about a move of that magnitude as a volatile day, but in 2022, it has become commonplace. Today is actually the 40th trading day this year that the 10-year yield has moved 10 bps or more relative to the prior day’s close. Relative to history, this year’s total of daily 10 bps moves (through 10/25) ranks as the highest since 2009 when there were 54. As shown in the chart below, there have been plenty of other years where the 10-year yield had a much larger frequency of 10 bps daily moves, including 2008 (66) and the early 1980s when both 1980 and 1981 had a total of 123, or roughly once every other trading day.
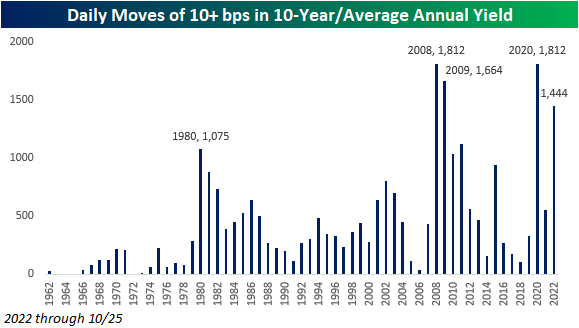
Based on the chart above, 2022 may look unremarkable in terms of daily volatility, but it’s leaving out a key variable and that’s the actual level of the yield on the 10-year at the time of the move. A 10 bps daily move is a lot more significant when the average yield on the 10-year is 2.8% as it has been this year compared to a year like 1980 or 1981 when the average yields were 11.4% and 13.9%, respectively. In order to adjust for the level of yield, the chart below shows the ratio of the number of days where the 10-year yield moved 10 bps versus the average yield of the 10-year during the specific year. After making that adjustment, 2022 still isn’t at a record, but it’s close. In both 2008 and 2020, the ratio was 1,812, and in 2009 it was 1,664. At 1,444, the ratio for 2022 ranks as the fourth highest on record. Already this year, 2022 ranks as one of the most volatile, in terms of daily yield changes, but there are still over two months left in the year. If the current pace continues through year-end, we could revisit this chart in just over two months and find that the ratio for this year was higher than any other year on record.
Editor’s Note: The summary bullets for this article were chosen by Seeking Alpha editors.
Be the first to comment