

peshkov/iStock via Getty Images
Introduction
It is the third time I am writing about the NASDAQ. My first article appeared on Seeking Alpha carrying the title “Nasdaq Is Entering a Mighty Bubble” which was posted on 15 April 2021. By that time, NASDAQ had ascended to the 13,247 level, not far from its present peak. I was astonished by the fact that the trajectory of NASDAQ resembled much of such famous bubbles as the Great Depression (1929), Japan’s Asset Bubble (1990) and the US Subprime Mortgage Bubble (2008). Were they just chance happenings? Readers are advised to study the chart below to make their judgments.
Author’s “NASDAQ Is Entering A Mighty Bubble”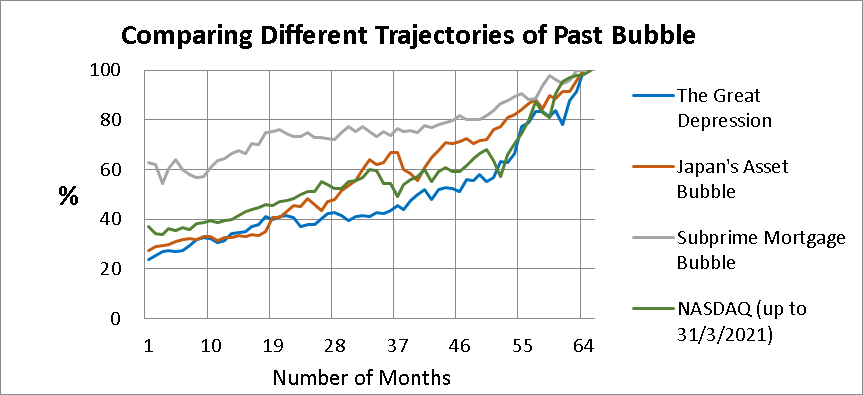
A few months and the NASDAQ finished at 15,645 points by the end of 2021. It was the highest close of the year and was also where the peak of NASDAQ located. Today, no one would deny NASDAQ has seen its peak and is heading for a bear market. There is little debate whether this downtrend is to persist for some time.
Market Bust In A Historical Perspective
Readers may be anxious to see how the four bubbles would have progressed after they busted. From what follows, the trajectories of three of the bubbles are extended from month 65 to month 100. Within this period, the Dow Jones Industrial Average had lost 88.75% from its peak (month 99). The Nikkei index appeared to be more resistant but still lost 59.12% from its peak (month 95). The Subprime Mortgage Bubble was the toughest among them. It was able to rebound swiftly after evaporating 49.30% from its peak (month 81).
Data from www.stooq.com; Chart plotted via Microsoft Excel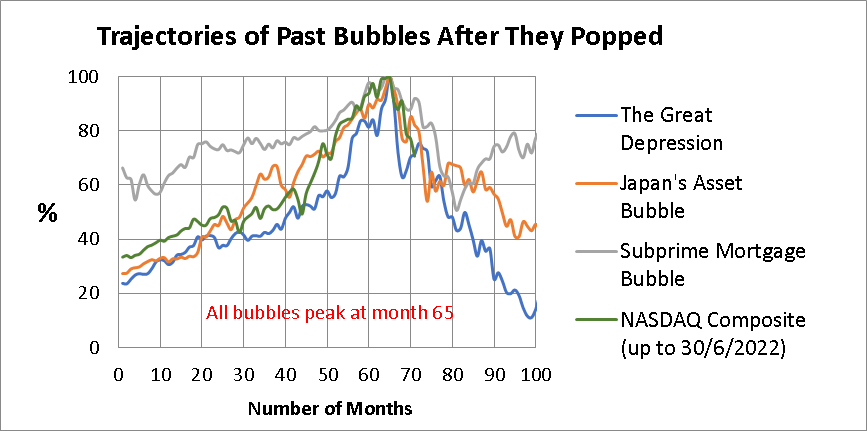
|
% Loss (from close to close) |
|||||
|
Months After Peak |
The Great Depression |
Japan’s Asset Bubble |
Subprime Mortgage Bubble |
Nasdaq Composite Index |
Months Since Start |
|
1 |
9.68 |
4.44 |
4.01 |
8.98 |
66 |
|
2 |
28.08 |
11.11 |
4.78 |
12.10 |
67 |
|
3 |
37.15 |
22.96 |
9.19 |
9.10 |
68 |
|
4 |
34.66 |
23.98 |
11.94 |
21.16 |
69 |
|
5 |
29.77 |
14.87 |
11.97 |
22.78 |
70 |
|
6 |
28.71 |
17.93 |
7.97 |
29.51 |
71 |
|
7 |
24.77 |
20.25 |
9.27 |
72 |
|
|
8 |
26.58 |
33.25 |
18.52 |
73 |
|
|
9 |
27.66 |
46.08 |
18.32 |
74 |
|
|
10 |
40.49 |
35.26 |
17.13 |
75 |
|
|
11 |
38.47 |
42.30 |
22.11 |
76 |
|
|
12 |
36.79 |
38.72 |
33.06 |
77 |
|
|
13 |
46.12 |
40.15 |
36.62 |
78 |
|
|
14 |
51.77 |
32.14 |
37.00 |
79 |
|
|
15 |
51.78 |
32.44 |
42.56 |
80 |
|
|
16 |
56.72 |
32.90 |
49.30 |
81 |
|
|
17 |
55.93 |
33.73 |
45.38 |
82 |
|
|
18 |
50.12 |
40.15 |
41.36 |
83 |
|
|
19 |
54.67 |
38.02 |
38.98 |
84 |
|
|
20 |
60.24 |
42.60 |
39.36 |
85 |
|
|
21 |
66.21 |
38.54 |
34.16 |
86 |
|
|
22 |
60.50 |
35.19 |
31.83 |
87 |
|
|
23 |
64.40 |
41.70 |
30.28 |
88 |
|
|
24 |
63.34 |
40.94 |
30.27 |
89 |
|
NASDAQ has just passed its sixth month after peaking. A lot of cells in the table have to be filled before a true bottom shall be in sight. The present moment is a bit premature to ask the question: “Where is the bottom?”
Besides the peak of all bubbles, month 65 is where a change of attitude toward the market originates. It is where an index reverses its trend. This reversal isn’t going to be brief. Price development after this supposed pivot bears a certain form of left-right symmetry. NASDAQ would certainly have its path, but one I think won’t be too different from the past three famous bubbles I cited.
The Expected Value
Before continuing with the present topic, I want to introduce the interesting concept of expected value. What is the most likely sum when you throw two dice together? The answer is 7, because it turns out with the largest frequency, as shown in the table underneath. We call it E[Sum] = 7. The expected value is some quantity that is most likely to occur. But in reality, the quantity E[Sum] infrequently occurs because the likelihood of a sum other than 7 is far greater.
|
Sum of Throwing 2 Dice |
||||||
|
1 |
2 |
3 |
4 |
5 |
6 |
|
|
1 |
2 |
3 |
4 |
5 |
6 |
7 |
|
2 |
3 |
4 |
5 |
6 |
7 |
8 |
|
3 |
4 |
5 |
6 |
7 |
8 |
9 |
|
4 |
5 |
6 |
7 |
8 |
9 |
10 |
|
5 |
6 |
7 |
8 |
9 |
10 |
11 |
|
6 |
7 |
8 |
9 |
10 |
11 |
12 |
Similarly, we can describe the progress of NASDAQ as a random variable Y that varies with the passage of time. For each point in time, it has a most probable value, say E[Y], that can be estimated. We shall address the derivation of E[Y] in the next section.
Statistical Modeling of NASDAQ
Let’s tackle the problem in an alternative way. In another article with the name “Modeling Nasdaq’s Mighty Bubble” posted on 26 April 2021, I put forward an exponential model to describe the progress of the Nasdaq Composite Index. It took the form of Y = 4.379*EXP(0.0076X), which was formulated using the whole history of NASDAQ from January 1938 to March 2021.
Should you want to know more about this model, please consult the article “Modeling Nasdaq’s Mighty Bubble” from Seeking Alpha. Below is a pictorial representation of NASDAQ with the fitted model. The fitted exponential model has an R2 of 98.5%, more than satisfactory from a statistical point of view.
Author’s “Modeling Nasdaq’s Might Bubble”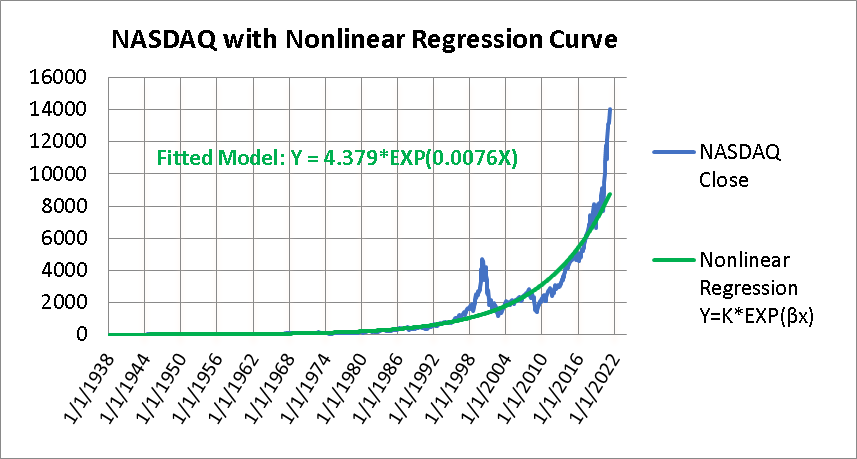
Here Y is the realized monthly close of the Nasdaq Composite index. Periodic highs and lows are excluded from the model because they are noise. Readers might suspect the validity of the fitted model. I must say an educated prediction is more reliable than any subjective guesswork. Below is a tabulation of Y and E[Y] from 31/1/2021 to 31/12/2023 that readers should consider for any serious financial action they may take.
The level of E[Y] has an important implication on the future trend of Y. While Y might be inflated or deflated most of the time, E[Y] follows its track free from market psychology. In a sense, Y above E[Y] is a state of overvaluation, and Y below E[Y] is a state of undervaluation. Thus E[Y] provides a useful point of reference for entry into the NASDAQ.
|
Date |
Y |
E[Y] |
Months Since Peak |
|
31/1/2021 |
13071 |
8553 |
|
|
28/2/2021 |
13192 |
8618 |
|
|
31/3/2021 |
13247 |
8684 |
|
|
30/4/2021 |
13963 |
8750 |
|
|
31/5/2021 |
13749 |
8817 |
|
|
30/6/2021 |
14504 |
8884 |
|
|
31/7/2021 |
14673 |
8952 |
|
|
31/8/2021 |
15259 |
9020 |
|
|
30/9/2021 |
14449 |
9089 |
|
|
31/10/2021 |
15498 |
9158 |
|
|
30/11/2021 |
15538 |
9228 |
|
|
31/12/2021 |
15645 |
9299 |
|
|
31/1/2022 |
14240 |
9370 |
1 |
|
28/2/2022 |
13751 |
9441 |
2 |
|
31/3/2022 |
14221 |
9513 |
3 |
|
30/4/2022 |
12335 |
9586 |
4 |
|
31/5/2022 |
12081 |
9659 |
5 |
|
30/6/2022 |
11029 |
9732 |
6 |
|
31/7/2022 |
9807 |
7 |
|
|
31/8/2022 |
9882 |
8 |
|
|
30/9/2022 |
9957 |
9 |
|
|
31/10/2022 |
10033 |
10 |
|
|
30/11/2022 |
10109 |
11 |
|
|
31/12/2022 |
10187 |
12 |
|
|
31/1/2023 |
10264 |
13 |
|
|
28/2/2023 |
10343 |
14 |
|
|
31/3/2023 |
10421 |
15 |
|
|
30/4/2023 |
10501 |
16 |
|
|
31/5/2023 |
10581 |
17 |
|
|
30/6/2023 |
10662 |
18 |
|
|
31/7/2023 |
10743 |
19 |
|
|
31/8/2023 |
10825 |
20 |
|
|
30/9/2023 |
10908 |
21 |
|
|
31/10/2023 |
10991 |
22 |
|
|
30/11/2023 |
11075 |
23 |
|
|
31/12/2023 |
11159 |
24 |
The above table is computed according to my fitted exponential model. You will see an interesting feature: Y is sinking while E[Y] is rising. Somehow the two curves will converge, whence the appropriate time to load up. If you don’t have any financial instrument in mind, consider QQQ.
Buying into a bear market is always a challenging maneuver. If you still choose to do so, calculate an adequate wager each time you buy. Go through my earlier article “Thoughts on Reward/Risk Ratio” on Seeking Alpha if you haven’t seen it yet.
Conclusion
Now readers are provided with two sets of tools at their disposal to judge the market. One is based on the historical progress of renowned past bubbles after they passed their peaks. Another is an exponential model that fitted to more than a thousand points of historical data. I prefer the mathematical model because it is scientifically sound and has stood the test of time, though many of the normal theory assumptions may be difficult to fulfill.
Overshoot might appear in deep bear markets. For example, the 1929 Great Depression had taken a long series of falls that squeezed almost 90% out of its peak value. NASDAQ, having a strong foundation, is unlikely to replicate in that manner nowadays. Since 2008, the FED has invented the powerful QE instrument that was missing in the previous century.
Author’s calculations via Microsoft Excel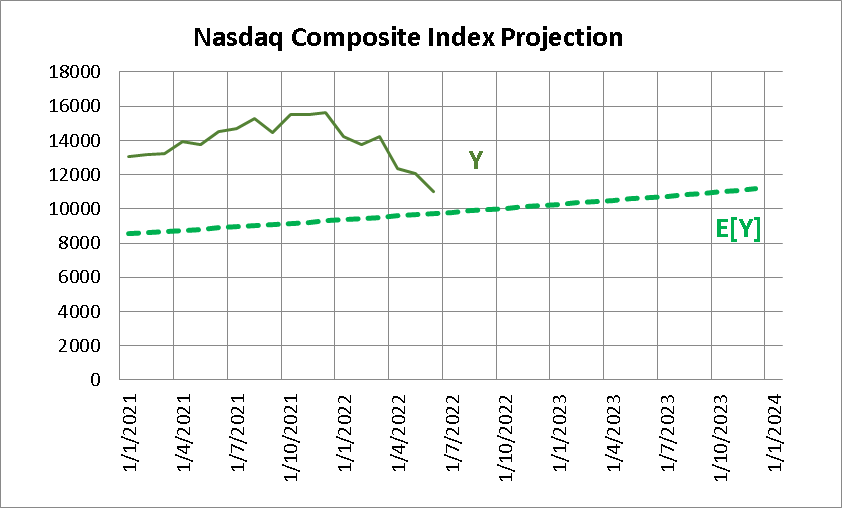
If you use the mathematical model I developed, you need to update it monthly. As depicted in the above chart, the current level of NASDAQ is 13.33% above its expected value at the same time point, and investors have to wait some time before an entry opportunity arises. I predict this moment may come towards the end of 2022.
Make a demarcation between investing and trading. You do not need to set stop losses when it’s an investing action. Otherwise, put in stop losses based on your risk tolerance. In any event should NASDAQ fall below E[Y], its expected level, by a large margin, don’t hesitate to dive in. The chance of a loss is minute. But still, you have to control the size of your wager.
Be the first to comment