

NASDAQ 100, NIKKEI 225, ASX 200 INDEX OUTLOOK:
- Dow Jones, S&P 500 and Nasdaq 100 indexes closed -0.34%, -0.43% and -0.95% respectively
- US CPI hit a four-decade high of 7.9% in February, underscoring rising price levels that may rein in economic growth
- Ukraine talks ended with no progress, weighing on market sentiment. APAC stocks may trade lower
US Inflation, Ukraine Talks, Nikkei 225, Asia-Pacific at Open:
Wall Street equities finished lower on Thursday as investors mulled lingering geopolitical risks and eye-watering US inflation figures. February’s CPI came in at 7.9%, marking the highest level since 1982. The core reading, which strips volatile food and energy items, hit 6.4%. The reading far exceeded the Fed’s long-term target of 2%. Both figures were in line with market expectations. Still, they captured data from before the Ukraine war and economists now expect inflation to reach 8-9% amid the jump in crude oil, metal and food prices in recent weeks. Therefore, the market is probably pricing in a faster pace of Fed rate hikes down the road, pulling the interest-rate sensitive tech sector lower.
Chinese tech giants listed on US exchanges plummeted overnight, with Alibaba (-7.9%), Tencent (-6.9%) and JD.COM (-15.83%) leading the decline. JD.COM reported fourth-quarter results which shows its active user accounts below consensus, underscoring a slower macro environment. The Hang Seng Index future is down 2% before market open.
Gold prices regained strength after talks between Ukraine and Russia failed to make progress towards reaching a ceasefire agreement. Ukrainian foreign minister Dmytro Kuleba described his meeting with the Russian counterpart as “difficult” and “It seems that there are other decision-makers for this matter in Russia”. This points to a bumpy road towards reaching a peace agreement between the two sides.
Heightened geopolitical uncertainty may continue to keep commodity prices afloat, sending inflationary waves around the globe. Surging price levels, especially in food, energy and metals, may dampen consumer spending and squeeze corporates’ profit margins. Many economists have flagged the risk of stagflation – an undesirable situation of slow economic growth and high inflation. This may create a challenging task for central banks as they need to strike a balance between inflation and economic uncertainty.
US CPI vs. Core CPI (YoY)
Source: Bloomberg, DailyFX
Asia-Pacific markets look set to open lower on Friday following a sour lead on Wall Street.Futures in Japan, Australia, Hong Kong, Taiwan, Singapore, Malaysia and India are in the red, whereas those in mainland China, South Korea, Thailand and Malaysia are in the green.
Looking ahead, Chinese new Yuan loans dominates the economic docket alongside the University of Michigan consumer sentiment figure. Find out more from the DailyFX calendar.
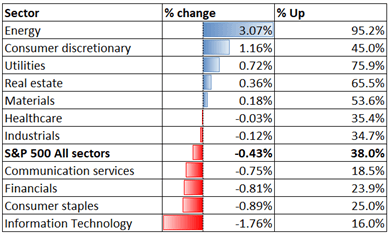
Looking back to Thursday’s close, 5 out of 11 S&P 500 sectors ended higher, with 38% of the index’s constituents closing in the green. Energy (3.07%), consumer discretionary (+1.16%) and utilities (+0.72%) were among the best performers, whereas information technology (-1.76%) and consumer staples (-0.89%) trailed behind.
S&P 500 Sector Performance 10-03-2022
Source: Bloomberg, DailyFX
Nasdaq 100 Technical Analysis
The Nasdaq 100 index is trending lower within a “Descending Channel” as highlighted on the chart below. Prices formed consecutive lower highs and lows over the past few weeks, underscoring a downward trajectory. An immediate support level can be found at 13,110 – the 200% Fibonacci extension. The MACD indicator is flattening beneath the neutral midpoint, suggesting that the overall momentum remains weak.
Nasdaq 100 Index– Daily Chart
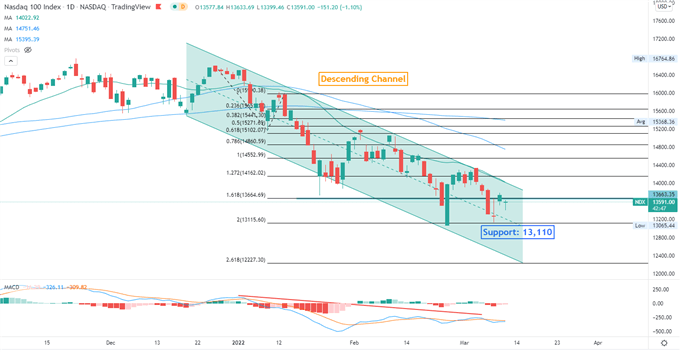
Chart created with TradingView
Nikkei 225 Index Technical Analysis:
The Nikkei 225 index breached below a “Symmetrical Triangle” pattern and thus opened the door for further downside potential. Prices rebounded sharply from an immediate support level of 24,725 – the 161.8% Fibonacci extension. The overall trend remains bearish-biased however, as prices formed consecutive lower highs and lower lows. An immediate resistance level can be found at 25,812 – the 127.2% Fibonacci extension.
Nikkei 225 Index – Daily Chart
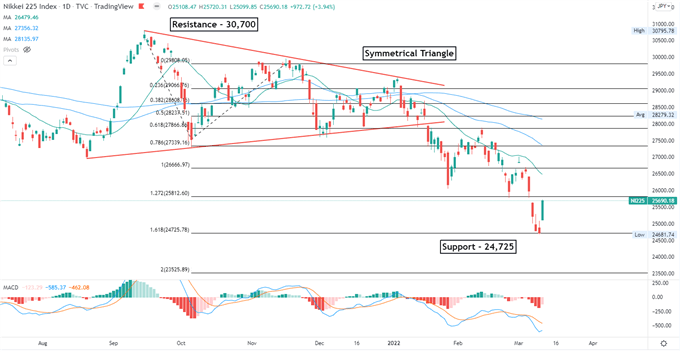
Chart created with TradingView
ASX 200 Index Technical Analysis:
The ASX 200 index is attempting to breach above the trendline resistance as shown on the chart below. A successful attempt may open the door for further upside potential with an eye on 7,190 and then 7,290. A reverse lower may intensify near-term selling pressure and bring an immediate support level of 6,960 into focus. The MACD indicator is trending lower beneath the neutral midpoint, underscoring weak momentum.
ASX 200 Index – Daily Chart
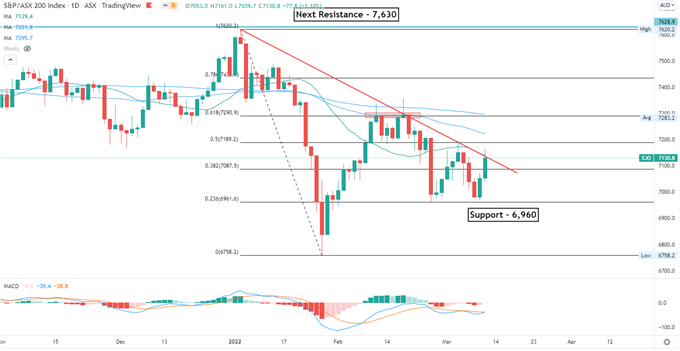
Chart created with TradingView
— Written by Margaret Yang, Strategist for DailyFX.com
To contact Margaret, use the Comments section below or @margaretyjy on Twitter
Be the first to comment