

NASDAQ 100 OUTLOOK
- Nasdaq 100 plunges as soaring inflation lifts U.S. Treasury yields and reduces appetite for risk-assets
- The S&P 500 also slides, but its losses are more moderate
- Despite Wednesday’s pullback, the Nasdaq 100 maintains a bullish outlook from a technical standpoint
Most read: Amazon and Ford backed ‘Rivian’ Gears up for Nasdaq Debut, Tesla Bounces Back
U.S. stocks remained on the back foot on Wednesday and posted large losses at the market close, after supercharged inflation numbers dented sentiment and triggered a spike in yields, prompting traders to be more cautious and selective before taking on additional risk.
According to the Bureau of Labor Statistics, October headline CPI surged 6.2% y/y, well above consensus expectations of 5.8% and the hottest print since 1990. Core CPI also accelerated, reaching a three-decade high of 4.6% y/y, a sign that inflationary pressures are broadening beyond the categories linked to the reopening and are becoming more entrenched in the economy.
Following the inflation report, US Treasury rates spiked higher, with the biggest moves concentrated in the short end of the curve. The 2-year yield, for example, rose from 0.45% to 0.51% as investors began to price in tighter monetary policy over the forecast horizon and the Fed’s OIS showed a full 25 basis point hike by July 2022 from September 2022 a day earlier.
When it was all said and done, the S&P 500 retreated 0.82% to 4,646, while Nasdaq 100 led losses on Wall Street, tumbling 1.62% to end the day at 15,960. In general, when bond yields rise, companies’ future cash flows are worth less in present when discounting them at a higher rate. This tends to weigh on stock valuations, particularly those with rich price-to-earnings ratio such as those in the technology space.
Despite the pullback, both the S&P 500 and Nasdaq 100 remain within a hair’s breadth of their all-time highs, an indication that sellers aren’t yet in control of the market. While the upward inflation trajectory is certainly a headwind, the outlook for stocks continues to be relatively positive over the short-term.
On balance, impressive third quarter corporate earnings, constructive profit guidance, dovish central bank, robust institutional buying activity and strong retail flows should support equities heading into year’s end, but a larger correction of a temporary nature shouldn’t be entirely ruled out if dip buyers fail to step in to arrest the sell-off.
NASDAQ 100 TECHNICAL ANALYSIS
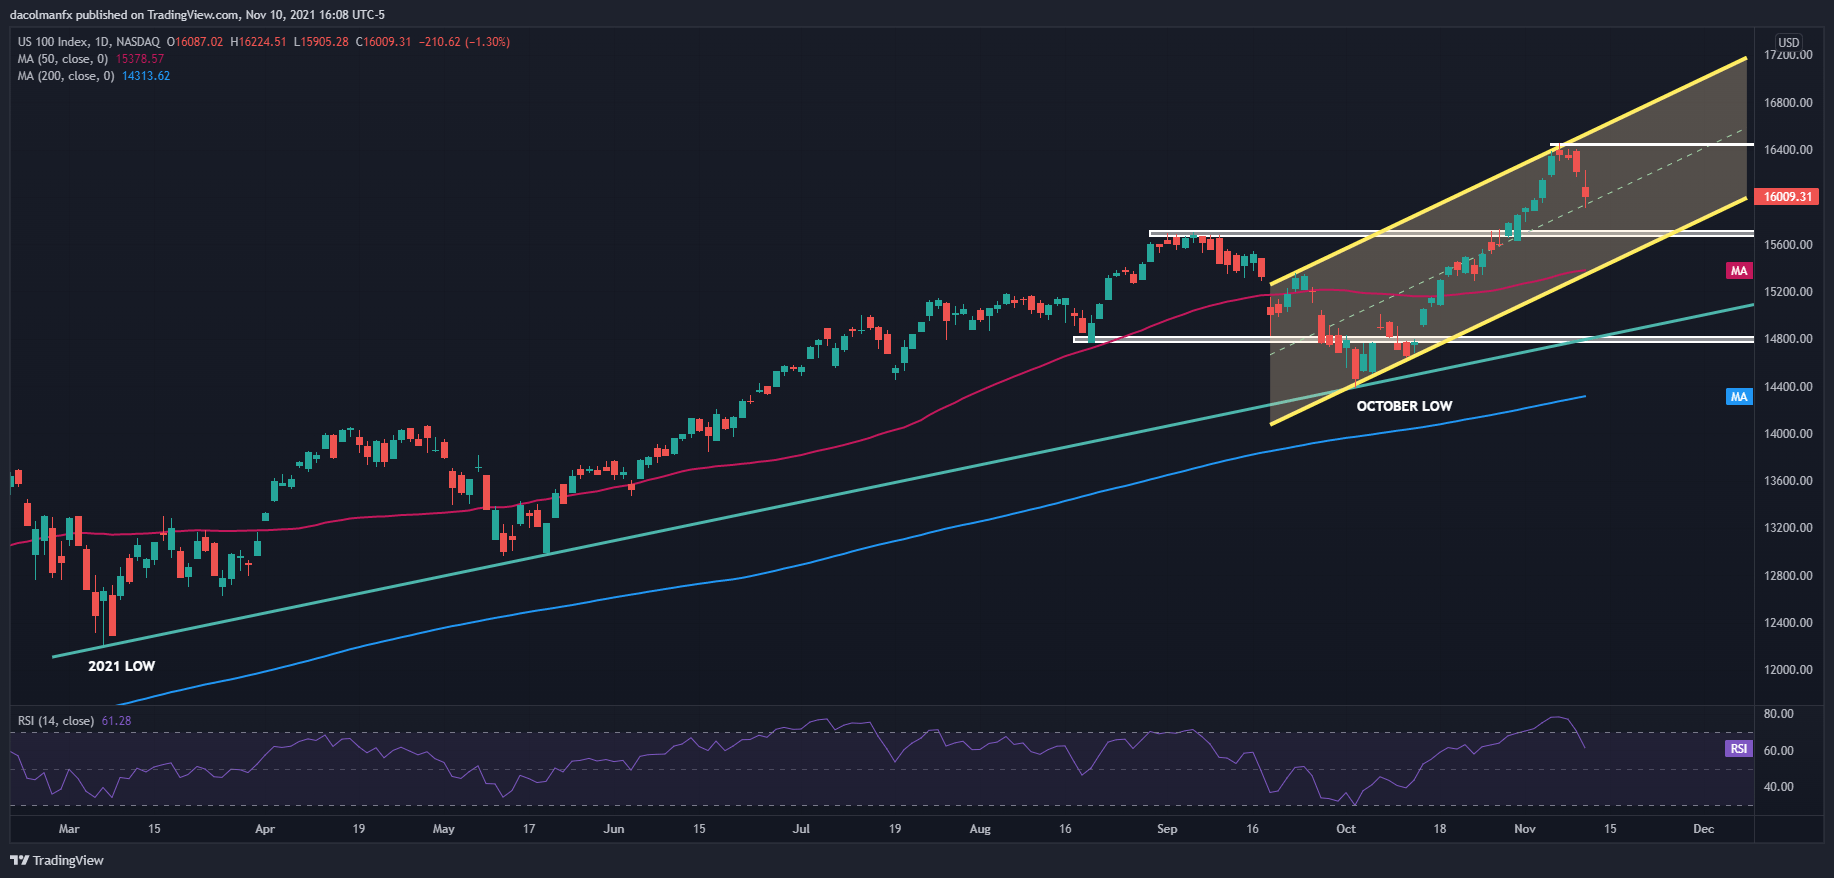
Nasdaq 100 has started to correct lower after failing to clear channel resistance near 16,455 last week. Following this pullback, the tech benchmark now sits above key technical support in the 15,950 region. If bears manage to drive the index below this floor in coming sessions, the sell-off could pick up pace and push price towards the next relevant support at 15,700. On the contrary, if dip-buyers resurface and rekindle bullish momentum from current levels, the first resistance to consider appears at 16,455 (record high), followed by 16,600, the channel’s upper boundary.
NASDAQ 100 TECHNICAL CHART
Nasdaq 100 (NDX) Chart by TradingView
EDUCATION TOOLS FOR TRADERS
- Are you just getting started? Download the beginners’ guide for FX traders
- Would you like to know more about your trading personality? Take the DailyFX quiz and find out
- IG’s client positioning data provides valuable information on market sentiment. Get your free guide on how to use this powerful trading indicator here.
—Written by Diego Colman, Contributor
Be the first to comment