


PM Images
This article was originally published to members of the CEF/ETF Income Laboratory on October 8th, 2022.
I last shared my top ten closed-end fund holdings at the end of June. Since that time, we’ve essentially taken a round trip in the market. We were hitting lows for the year in June. We rallied through the summer and have now returned back down to making fresh lows for the year in September. October started out with a bang but quickly faltered. We were giving up most of the gains that the broader markets had achieved in the two-day rally.
Suffice it to say, any portfolio reviews for most investors have probably not been a fun exercise in 2022. Unless, of course, you are managing a heavy energy portfolio. In which case, you’re probably sitting in a great position. Energy remains the only sector positive for the year. With the support of OPEC production cuts, it seems to have put another potential catalyst in for supporting the sector even further.
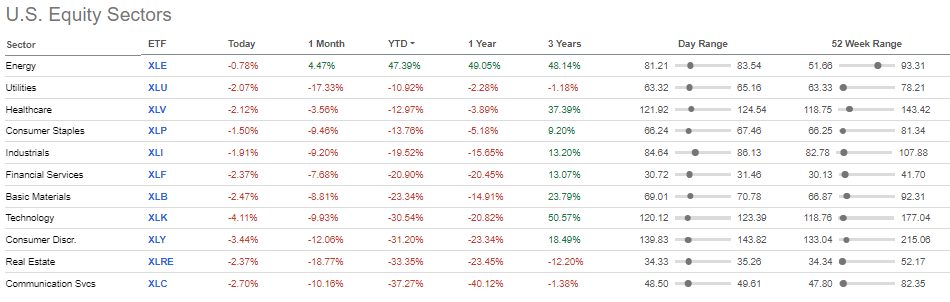
Sector Performance as of 10/08/2022 (Seeking Alpha)
Here’s How My Entire CEF Portfolio Is Holding Up
According to Fidelity, the returns on my closed-end fund portfolio through the first three quarters (ending September 30th, 2022) came in at -24.10%. (All the data will be provided from Fidelity for the indexes.)
This compares with the -23.87% decline of the S&P 500, the Dow Jones U.S. Total Stock Market Index’s decline of -24.92% and the loss of -26.40% of the MSCI ACWI ex USA Index.
Bonds were no place to hide either, though. Bloomberg U.S. Aggregate Bond Index provided a decline of -14.61%, and the Bloomberg Municipal Bond Index dropped -12.13%.
An index blend of 70% stocks and the rest in taxable bonds provided a decline of -21.45%.
With that being said, I’m not worried about my ~24% decline at all. Of course, I don’t want to see losses, but it’s bound to happen. It’s particularly bound to happen if you are in a bear market across the board.
First of all, despite the rocky year, the distribution cuts have been minimal at this point. That has resulted in my income still growing every month as I put capital to work, no matter what the environment is doing.
The second point about this is that closed-end funds have to contend with discount widening. That is to say that the underlying portfolios can hold up better than the actual share price.
This is where the opportunities come in with CEFs in the first place, seizing the opportunity to exploit discounts and premiums. Discounts across the CEF space have widened meaningfully from the start of the year.
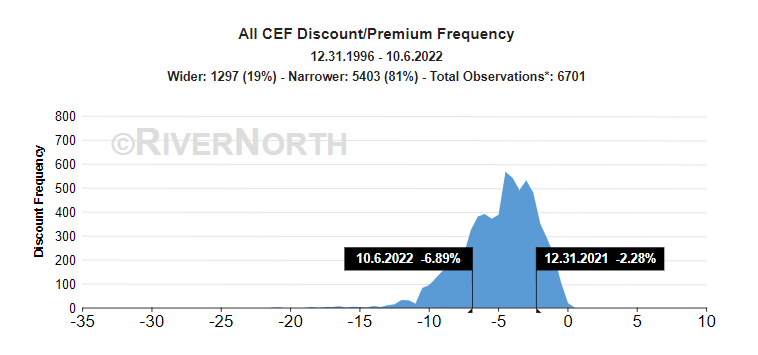
CEF Discount/Premium Frequency (RiverNorth)
The third point is that plenty of the funds I hold are leveraged. Therefore, besides the discount/premium mechanic, they will be more volatile overall. In a down year, leveraged CEFs can feel it much worse as moves are amplified.
My Top 10 (10/08/2022)
Despite a volatile year, my top ten hasn’t shifted dramatically in the last quarter. I hold a total of 42 positions in my main CEF portfolio; the top ten make up 40.14% of the portfolio at this time. That is up from 39.72% previously. However, it is still down from the update before that, where the top ten made up 43.67%.
I do get the question quite a bit of asking how I can track so many positions. First, I do this full-time. Second, the top positions are really the ones I care about, considering they make up a significant portion of my invested capital.
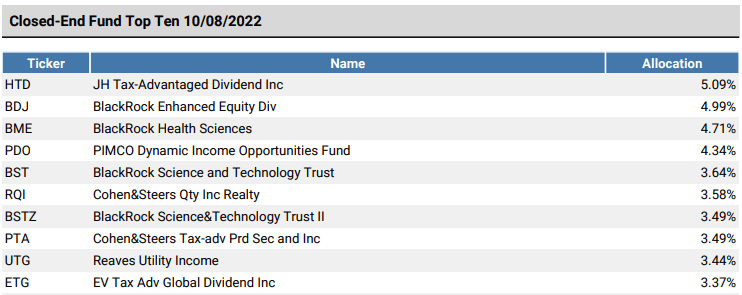
Top Ten 10/08/2022 (Portfolio Visualizer)
John Hancock Tax-Advantaged Dividend Income (HTD) and BlackRock Enhanced Equity Dividend (BDJ) remain my first and second largest holdings. Albeit the HTD allocation has come down some from the 5.58%, it showed earlier. BDJ moved up slightly from the 4.93% weighting.
Perhaps unsurprisingly, BlackRock Science & Technology Trust II (BSTZ) has declined even further as speculative tech continues to get hammered. The weighting was 4.44% towards the end of June. At one point, it was by far my largest holding. In fact, it wasn’t so long ago as it was in the middle of 2021.
That being said, I added to BlackRock Science and Technology Trust (BST) in August, which has increased my position in my portfolio. From the tenth largest at a 2.98% weighting to the current 3.6% and number five spot.
Two funds that have made a new appearance in the top ten are Cohen & Steers Tax-Advantaged Preferred Securities & Income (PTA) and BlackRock Health Sciences (BME). That had edged out Cohen & Steers REIT & Preferred & Income (RNP) and Cohen & Steers Infrastructure (UTF) that made the list before.
It wasn’t really replaced, but I’ve simply not added to my RNP and UTF positions in this period. PTA, on the other hand, I added some in July and September. I also added a big batch of BME in August. As it seems more likely that we are in for a continued wild ride, a big allocation to a non-leveraged healthcare fund seemed appropriate.
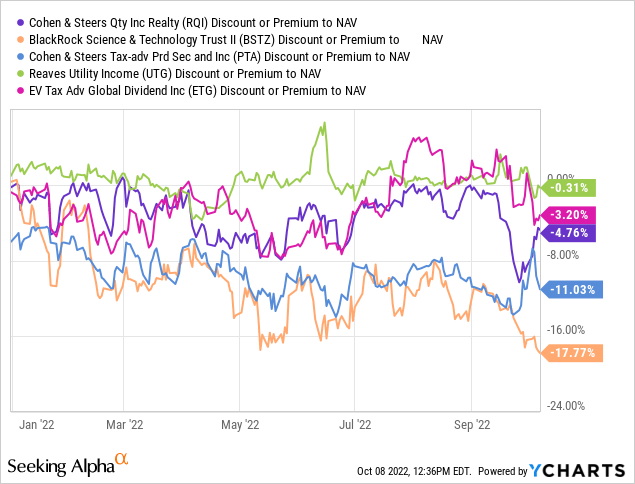
Here’s a look at the discount/premiums YTD for these funds. For the most part, as shown above, discounts have trended wider. BME and Reaves Utility Income (UTG) remain fairly close to parity with their NAV. This tends to be the case with these funds.
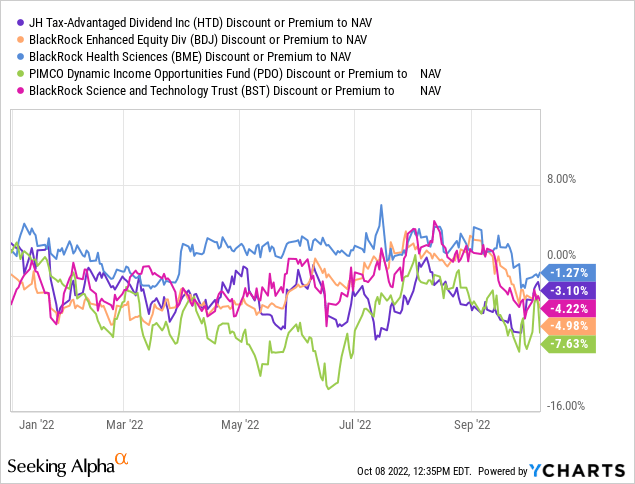
YCharts
YCharts
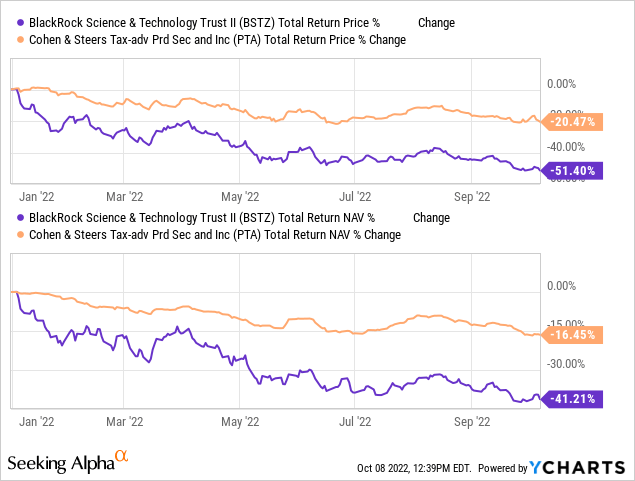
BSTZ’s discount and PTA’s discount remain the most attractive. With BSTZ’s discount expanding drastically wider from the start of the year. A look below is the YTD performance of both of these funds. The total share price returns compared to the total NAV returns. BSTZ’s portfolio has been incredibly weak, but we can clearly see just how much more the share price has been punished.
YCharts
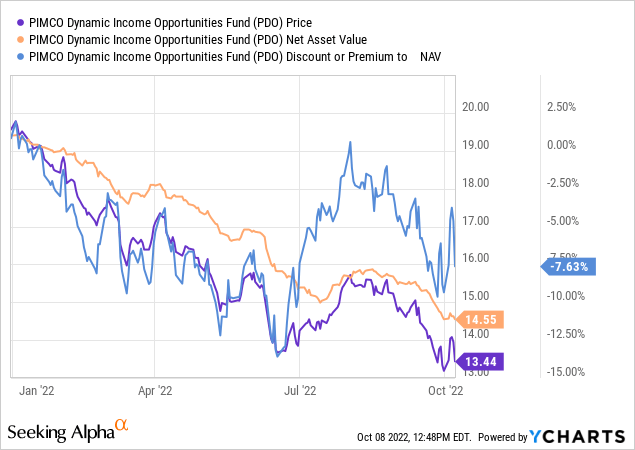
While I believe all of these are worthwhile investments, I see BSTZ and PTA as two that are very attractive at this time. Additionally, PIMCO Dynamic Income Opportunities (PDO) is quite attractive too. The fund raised its distribution after having some strong coverage. The latest report showed that the 3-month rolling coverage ratio was 143.71%. The 6-month coverage ratio was 201.34%. On that basis, it is the highest of the PIMCO funds.
It remains attractively discounted too. This is especially true when compared to several PIMCO funds. They often carry premiums.
Though the fixed-income space is getting hit, and the PIMCO funds haven’t been immune. PDO was making an attempt to join its sister funds in premium territory in July, but that quickly reversed.
YCharts
BSTZ, PTA and PDO are all quite different funds, but they appear to be some of the most tempting offers at the moment for longer-term investors. If you feel that we are in for continued weakness, then the PTA and PDO leverage probably wouldn’t be too appropriate. Likewise, BSTZ’s riskier tech weighting could also easily see further downside should we take another sizeable leg lower.
Conclusion
Discounts have been widening in the CEF space, which generally creates an opportunity to start investing in these funds. At the same time, they generally remain more volatile due precisely to discount/premium mechanics. On top of this, they are leveraged, which amplifies their moves. I hold several non-leveraged funds in my top ten that take an option writing strategy approach instead. That can help dampen the negative impacts of the other leveraged funds being held.
It certainly hasn’t been a strong year of performance for me, but I’m still quite content with how things have been going, considering the circumstances.
Be the first to comment