

Pgiam/iStock via Getty Images
September has been one of the worst month for stocks with all three major indices dropping at least 5% fueled by a hawkish Fed amid red-hot inflation. The Federal Reserve hiked interest rates as expected by another 75bps but subsequent commentary and the released dot-plot caught investors on the wrong foot with the Fed eyeing several more interest hikes in 2022 and 2023.
As a result stocks should a sharp leg lower at the end of September and even all-mighty Apple stock finally found itself in a bear market, albeit just for a very short time. The markets reached new yearly lows and the REIT, BDC and utility sector was hit especially hard as these companies are significantly leveraged and with the markets shooting first and asking questions later high-quality names were hit almost as hard as the deep-in-trouble mREIT sector.
Overall, I am embracing this sell-off but the pace at which the Federal Reserve is hiking rates is concerning and with spill-over effects as evident with the GILT bond action in the UK starting to appear the big question is when the Fed will pivot. I also a bit concerned about part of my exposure in the REIT sector, most notably about Medical Properties Trust (MPW), but I first have to await the upcoming earnings season to make a better assessment of the situation. That said, this earnings season and the outlook for Q4 will be very decisive for short-term actions in the stock market and while I am not concerned about short-term price movements this could of course offer some great long-term buying opportunities as I personally expect a lot of negative surprises just as we have seen with recent reports from FedEx (FDX) and NIKE (NKE).
Portfolio Changes in September
September was very busy as I made a partial sale of STORE Capital (STOR) after its ex-dividend date and following the acquisition news that will take STORE private at $32.25. I was very disappointed by that news as I consider STORE to be a great business that will also weather the upcoming recession. Interestingly, and as testament to its strong operating business, only days after that news broke STORE raised its dividend by 7% teasing its existing investors in terms of what they will be missing out on in the future. That said my investment in STORE was very profitable and I will sell the other half probably in October or November unless there is a better alternative offer. Also, one needs to factor in the fact that with the economy drifting into a recession amid high interest rates the value of STORE’s portfolio will suffer and the stock wouldn’t trade anywhere near $32 (probably around $25 right now). And so, the more turbulent markets become, I will use these proceeds to invest into other REITs and BDCs at attractive prices.
Net investment activity in September amounted to a very solid $2,000 following reduced buying in July. The proceeds from my partial sale of STORE were invested into Spirit Realty Corporation (SRC), Gladstone Commercial (GOOD), Bank of Nova Scotia (BNS) and Ares Capital Corporation (ARCC). All of them were and are yielding well in excess of 5% which is warranted in that rising interest rate environment. Needless to say all these purchases are in the red right now as the markets continue to drift down despite a very strong start into Q4.
I also purchased a couple of additional speculative shares in ZIM Integrated Shipping Services (ZIM) after the stock had been beaten down to extreme levels. The dividend is sky-high right now but that is obviously backward-looking and future dividend payments will be way lower following a significant decline in freight rates amid a deteriorating global economy. A recession is probably coming latest next year but the company is paying a strong dividend even though that will have to be cut in subsequent quarters as freight rates will likely come down. The current quarterly dividend of $4.75 is eye-watering but probably comes at the peak of the cycle. Even the $2.00 quarterly dividend of 2021 is more than enough to keep me patient as the company navigates through troubled economic waters as shipping rates are coming down hard. Stocks fluctuate which creates buying opportunities and I believe this is one, maybe too early but certainly much better than when the stock was twice the price not too long ago.
Apart from that all other purchases were triggered by the almost weekly savings plans.
Due to the nature of how the monthly investment plan process works, I am investing relatively equally into these stocks at two points of time during the month – at the beginning of the month and mid-month – which breaks down as shown below. Figures are in Euro and show that, for instance, at the beginning of the month, I am investing between 50 and 75 EUR each into Microsoft, The Home Depot (NYSE:HD), Visa (NYSE:V), W. P. Carey (WPC), and BP (NYSE:BP). Mid-month, I am adding between 33 and 40 EUR each into STAG Industrial (NYSE:STAG), AT&T (T), NextEra Energy (NYSE:NEE), Toronto-Dominion Bank (NYSE:TD), Main Street Capital (NYSE:MAIN) and JPMorgan (NYSE:JPM).
I have added several investment plans starting mid-September 2020 which include AGNC Investment Corp. (NASDAQ:AGNC), Ares Capital (NASDAQ:ARCC), Medical Properties Trust (NYSE:MPW), The Bank of Nova Scotia (NYSE:BNS) and The Trade Desk (NASDAQ:TTD). Investments here will be focused on high-yield as well as high-growth stocks in the technology, therapeutic and renewables sectors.
All those purchases substantially raised my forward annual dividend income, breaking down as follows:
Added Dividend Income (Designed by Author)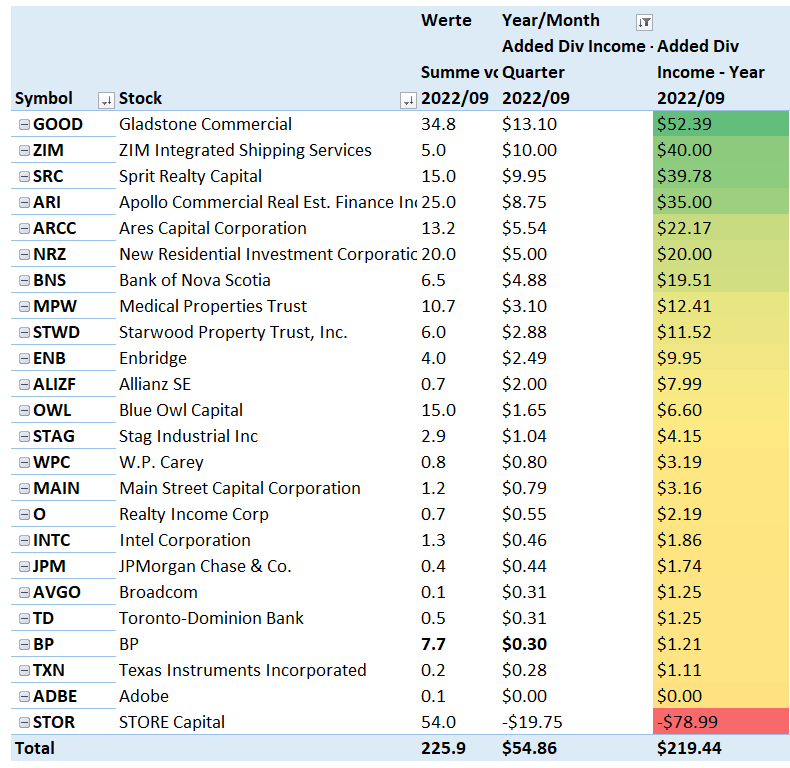
All net purchases in September can be found below:
September 2022 Net Purchases (Designed by Author)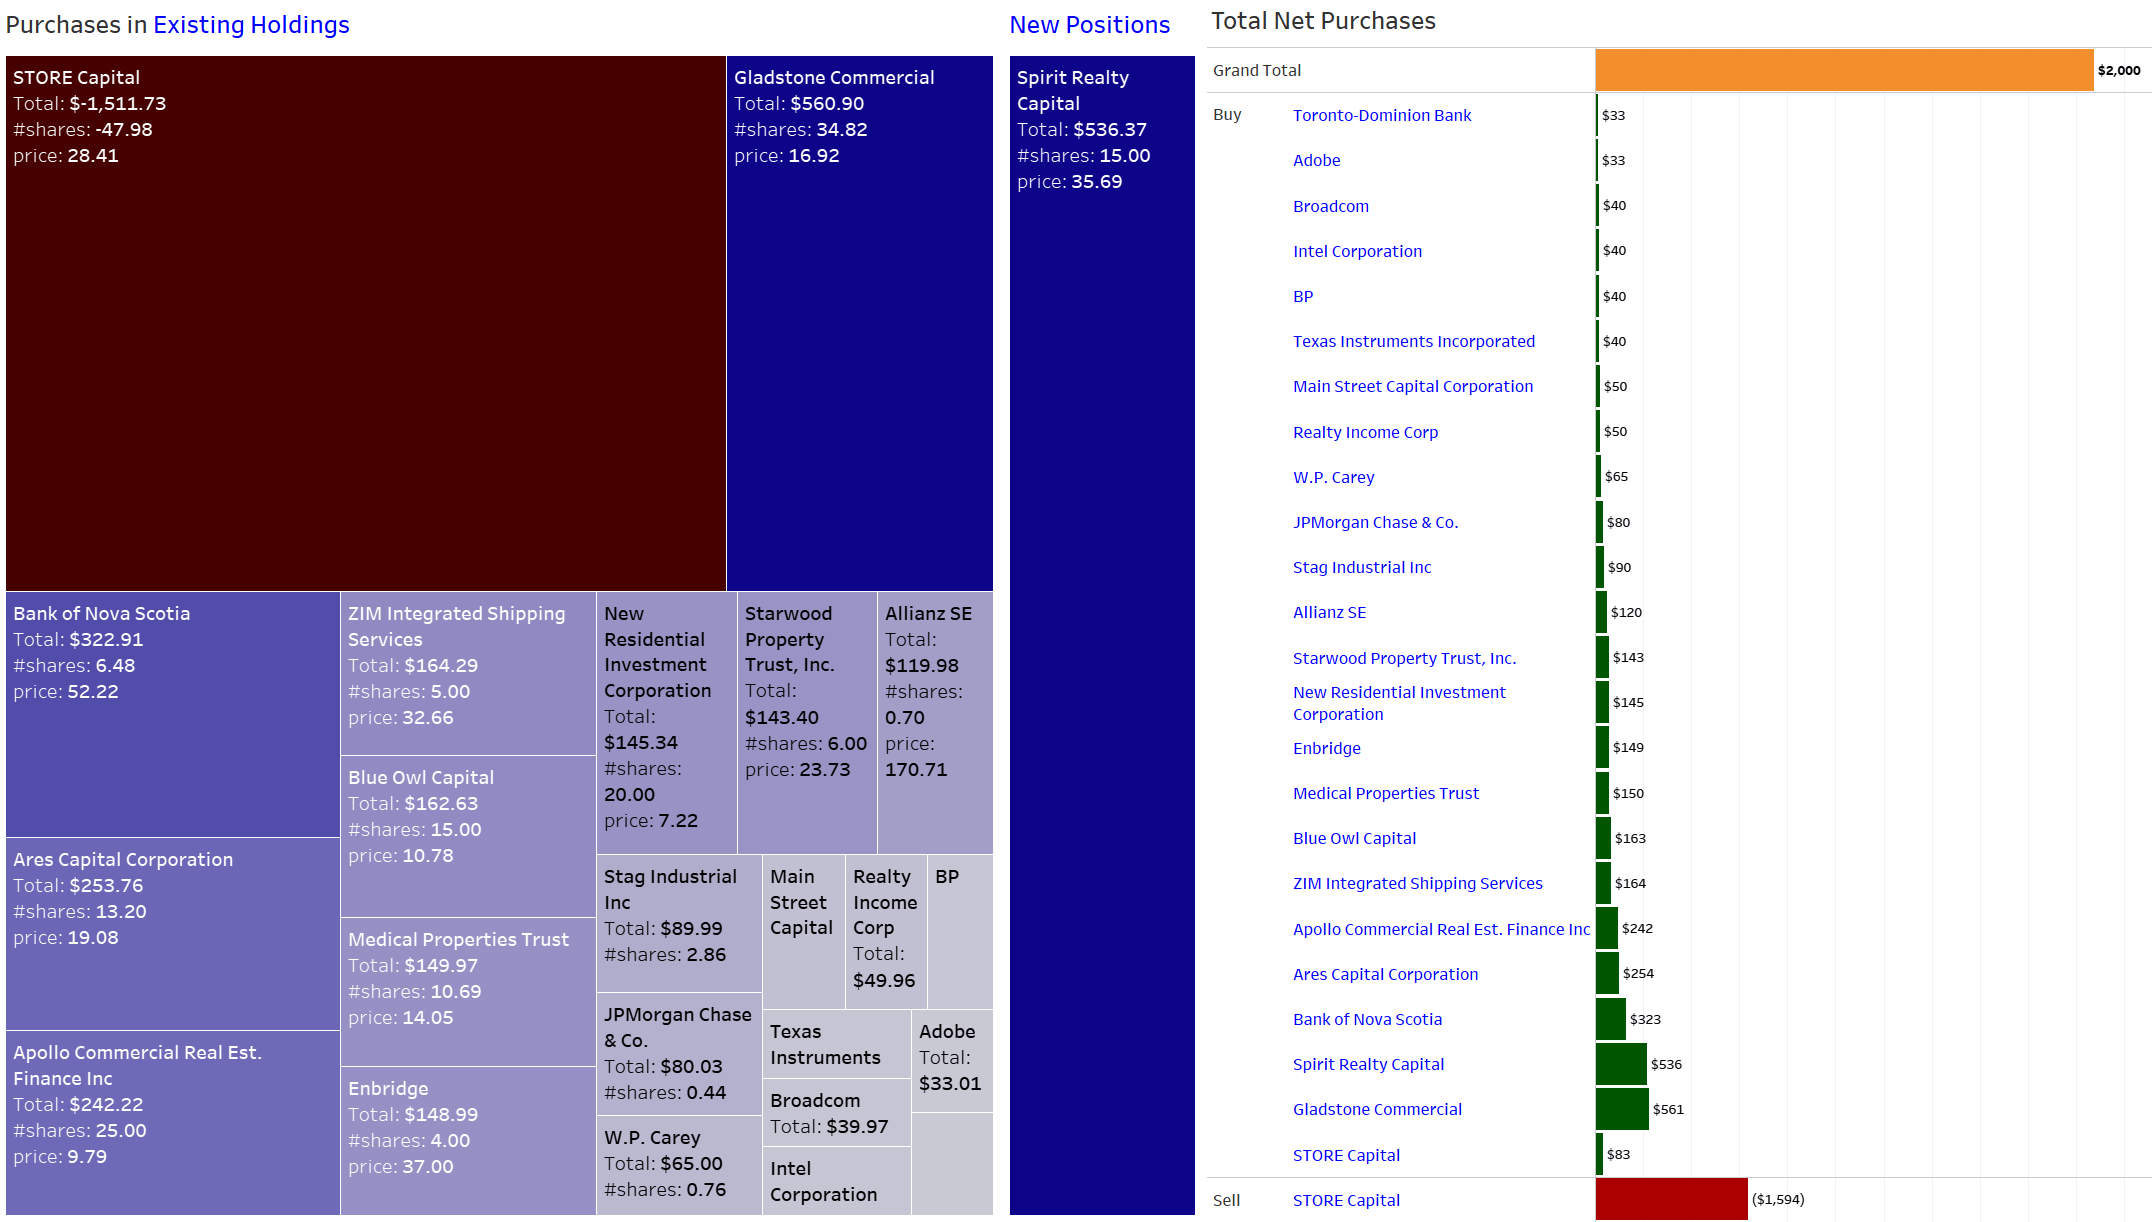
Dividend Income: What Happened on the Dividend Side?
Dividend income hit a new September record of $679 and is up an explosive 31% annually and 27% sequentially. Adjusting these figures for the semi-annual dividend payment of the Commonwealth Bank of Australia (OTCPK:CBAUF) sequential income is up a very solid 16% fueled by dividend gains driven by ongoing investments across a variety of stocks.
On an annual basis, the biggest income driver is the Ares Capital Corporation (ARCC), a stock I am running on a bi-weekly savings plan and where my contributions quickly translated into meaningful dividend income. The goal is to accumulate that position until it generates at least $100 in quarterly dividends which is a psychologically important level for me that no single stock has reached so far on a quarterly basis. 80% of that target has been achieved and with the current market conditions and the stock’s 10% yield that will be only a matter of weeks.
September 2022 Dividend Income (Designed by author)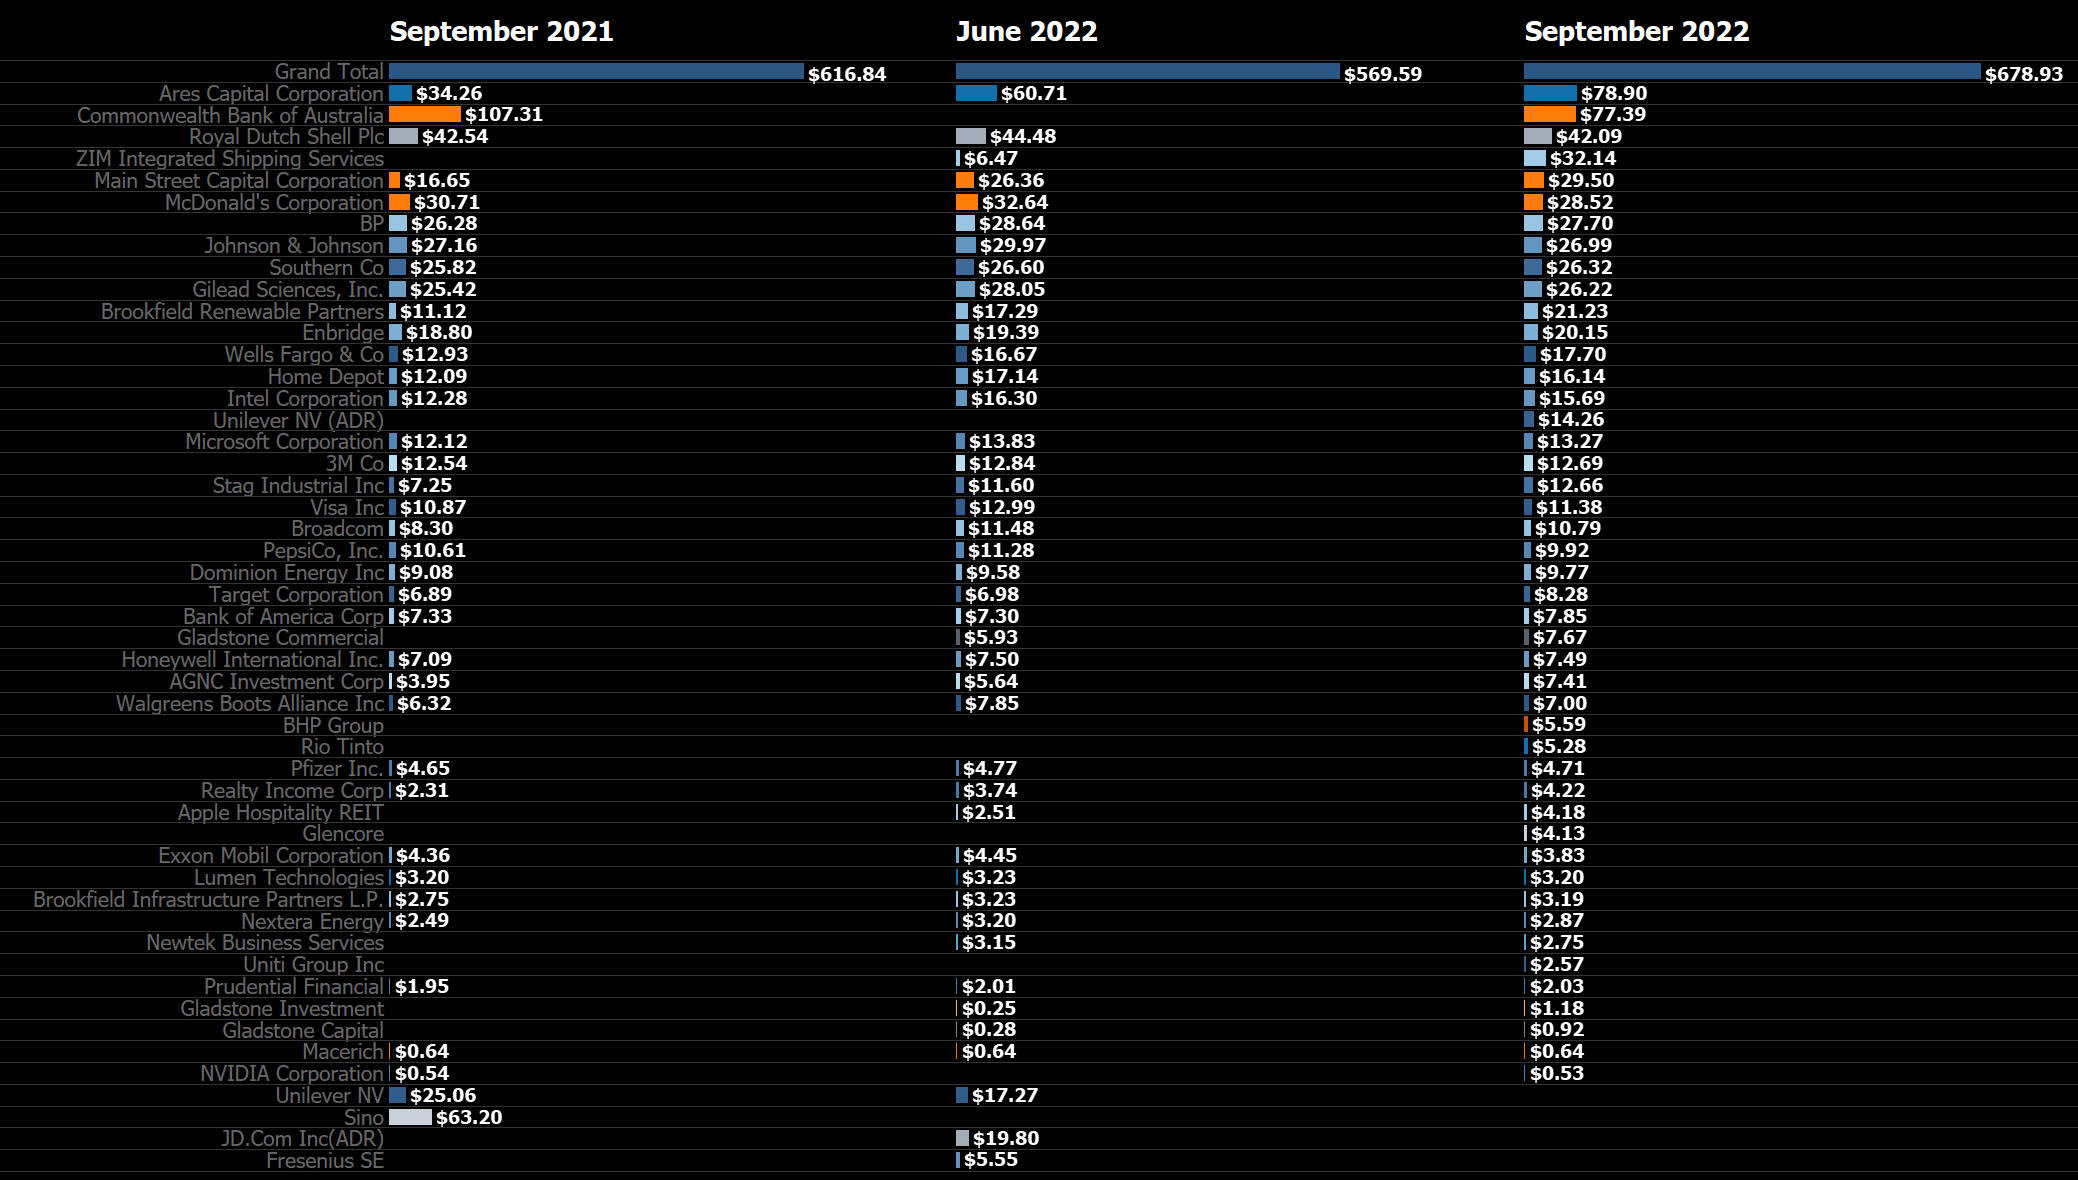
The growing share of ARCC dividends can also be seen when just looking at the top three dividend payers in September and the other quarter-ending months. After two years where the average dividend from the top three 3 stocks didn’t reach past heights, March, June and September 2022 each set new all-time records with an average dividend from those three stocks together worth $132 on average on a 2022 YTD basis and amounting to a total of $150 for September 2022 as seen below:
Top 3 Dividend Payers (Designed by author)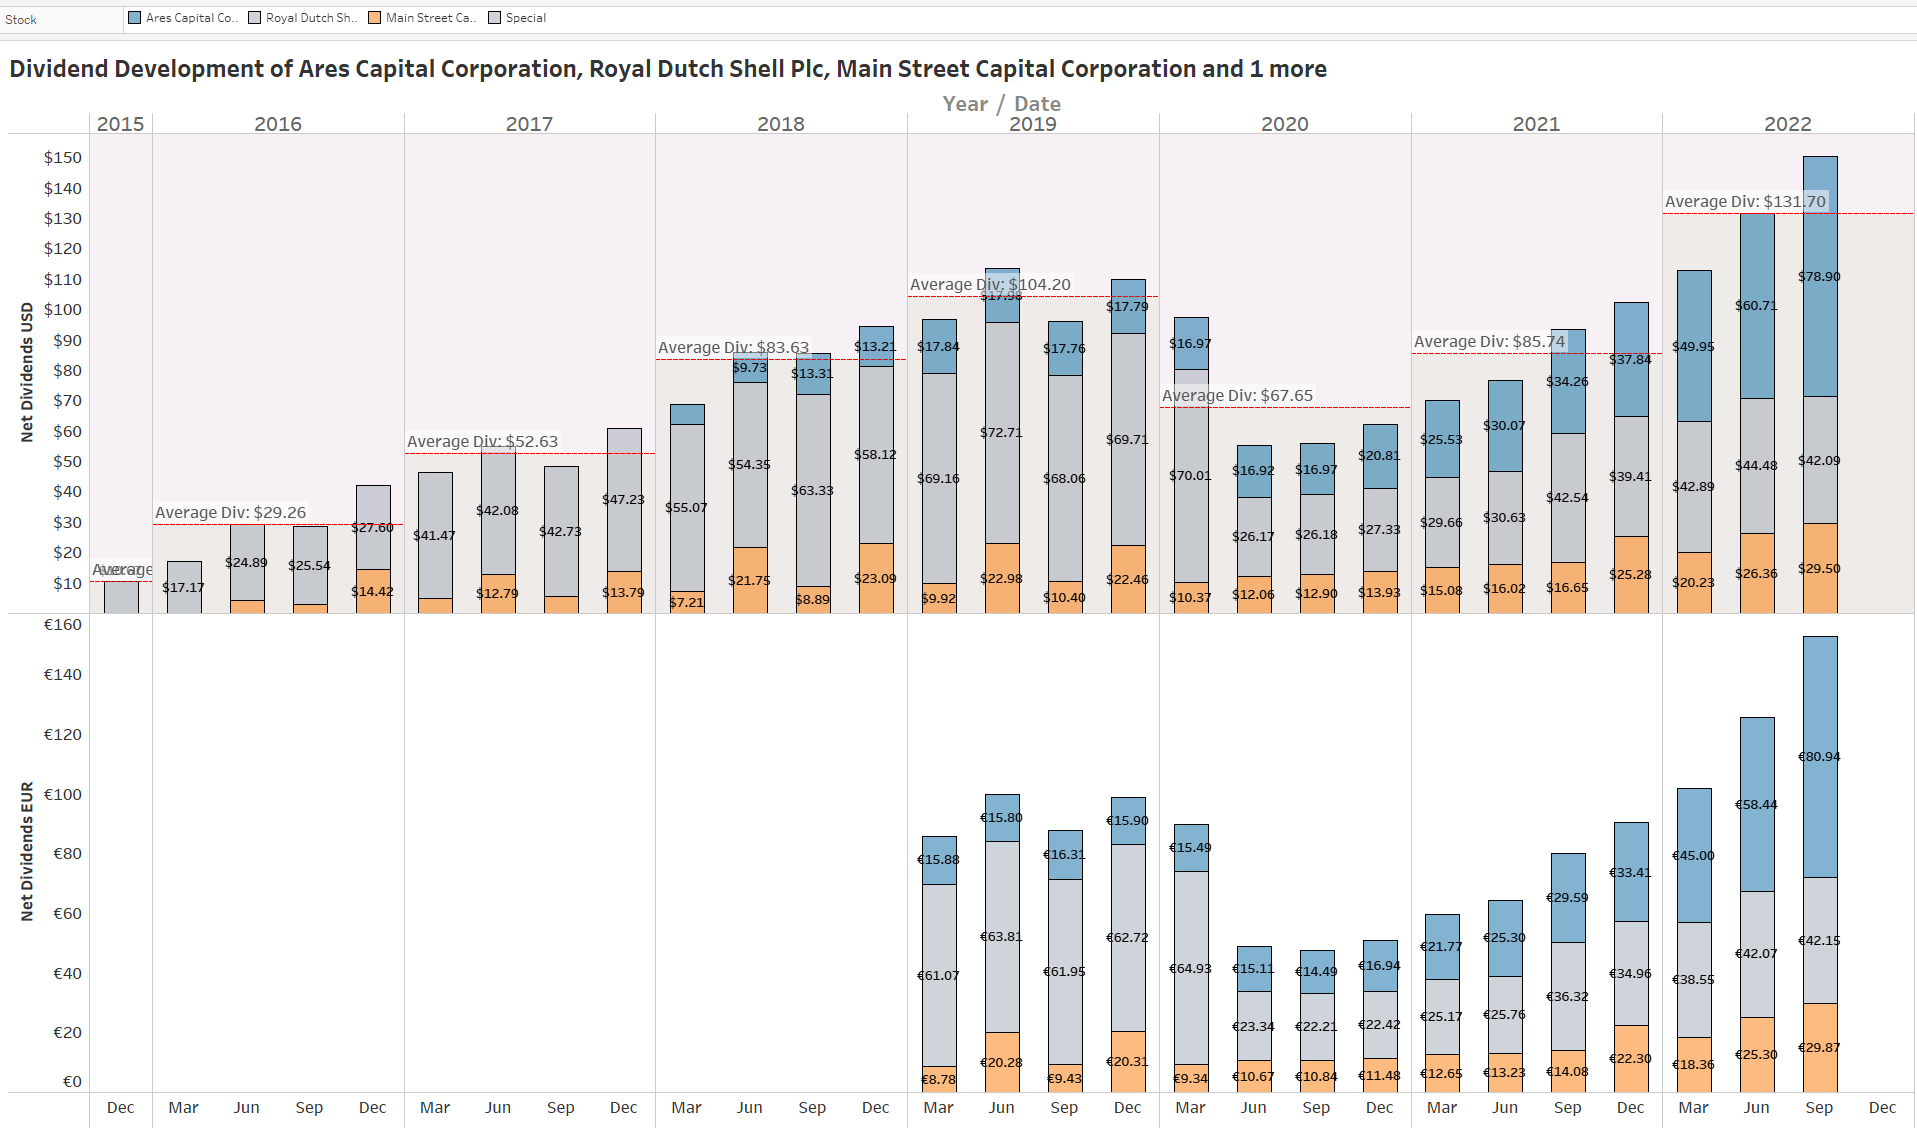
Here is a look at my favorite chart: the net dividend income development by month over time between 2015 and 2022, where you can easily see the development of my dividend income as well as the average annual dividend in a given year:
All-time Dividend Development (Designed by author)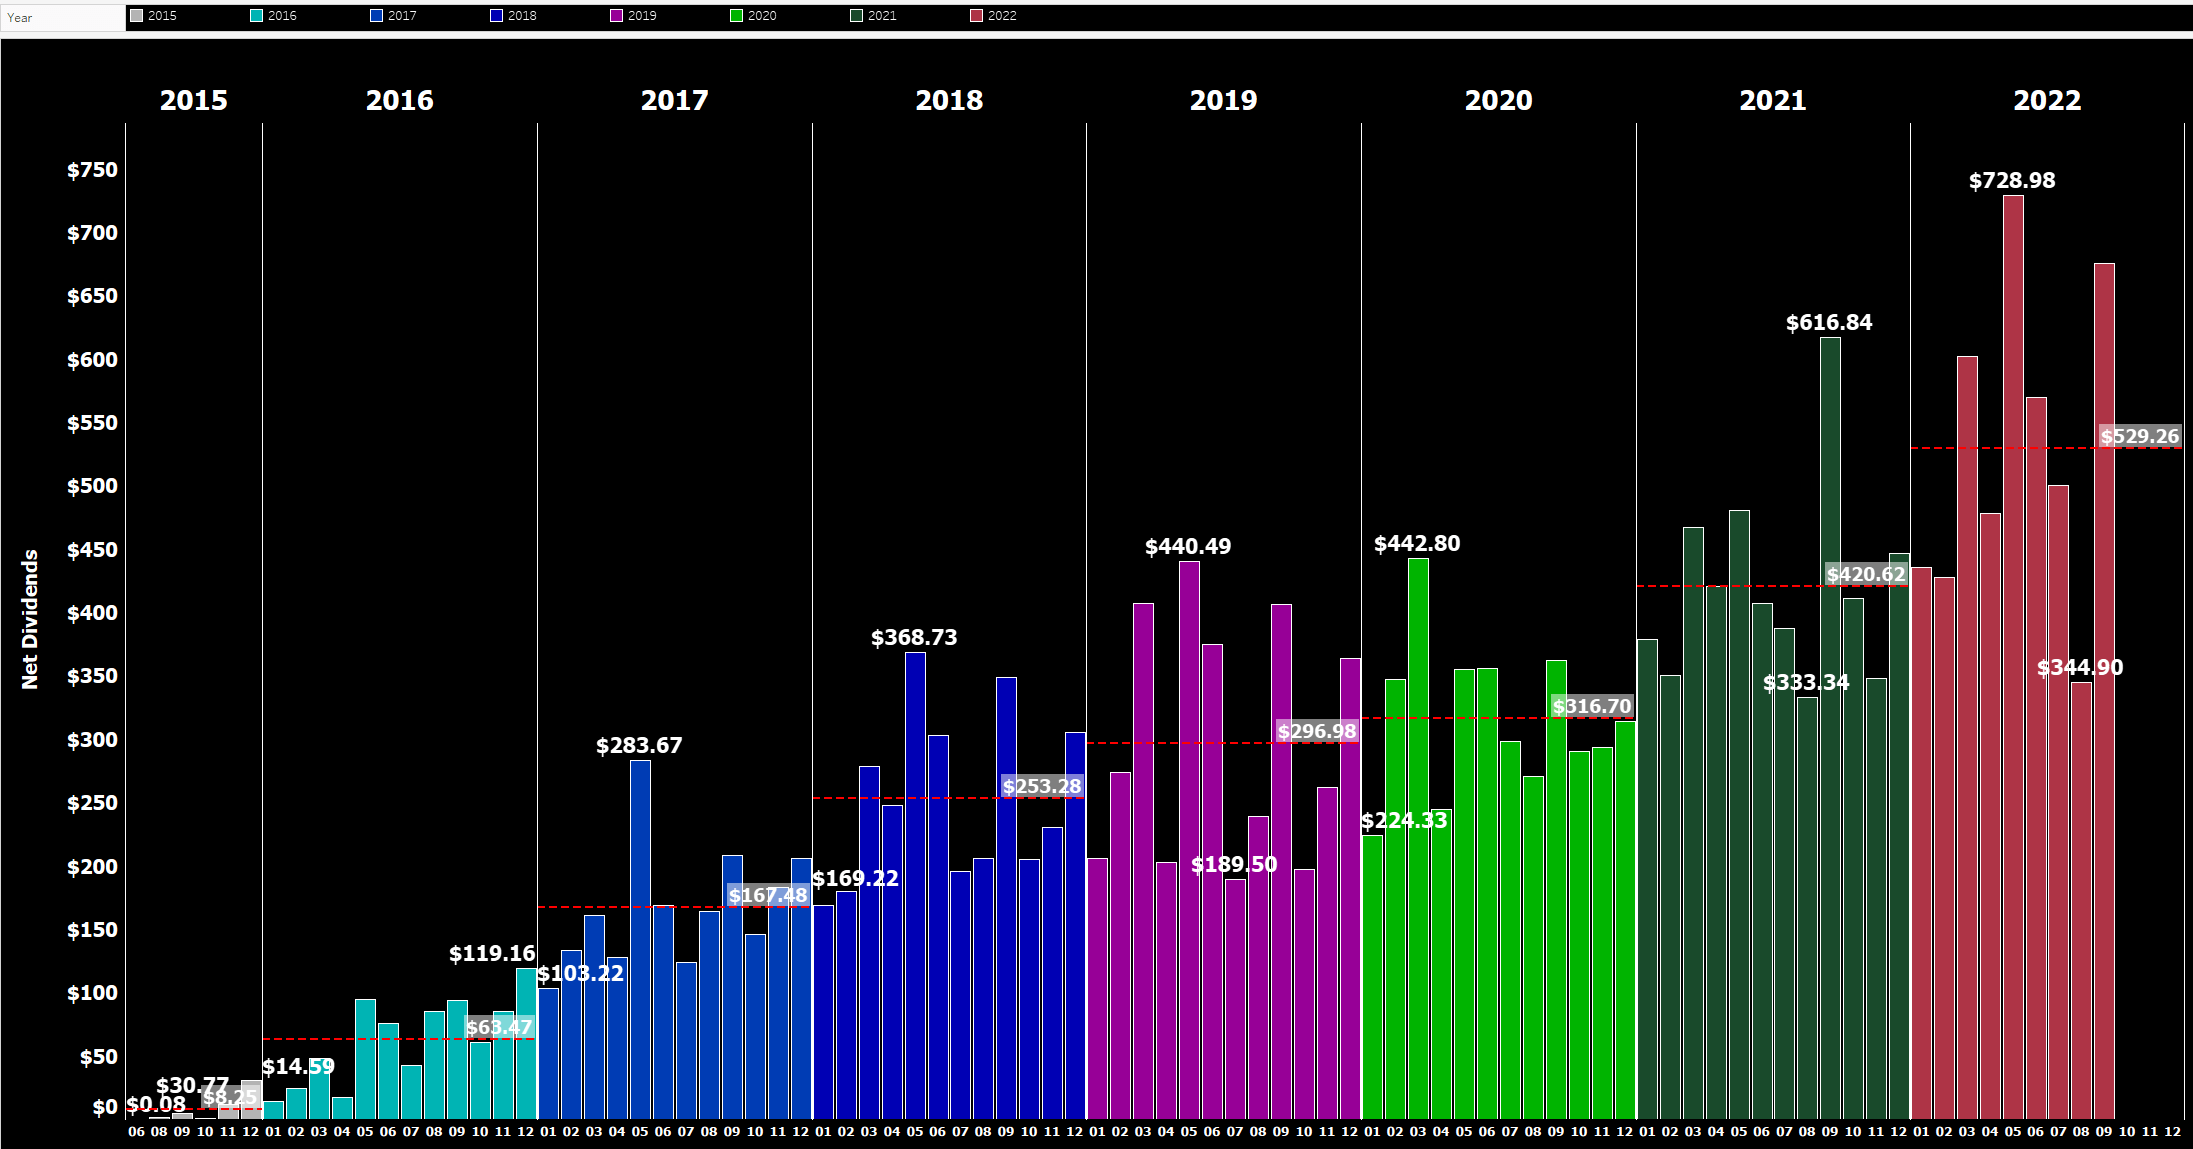
Next, I have scattered all the individual dividend payments I have ever received and colored them by year, rearranging the years side by side rather than horizontally as in previous updates:
Dividend Bubbles (Designed by author)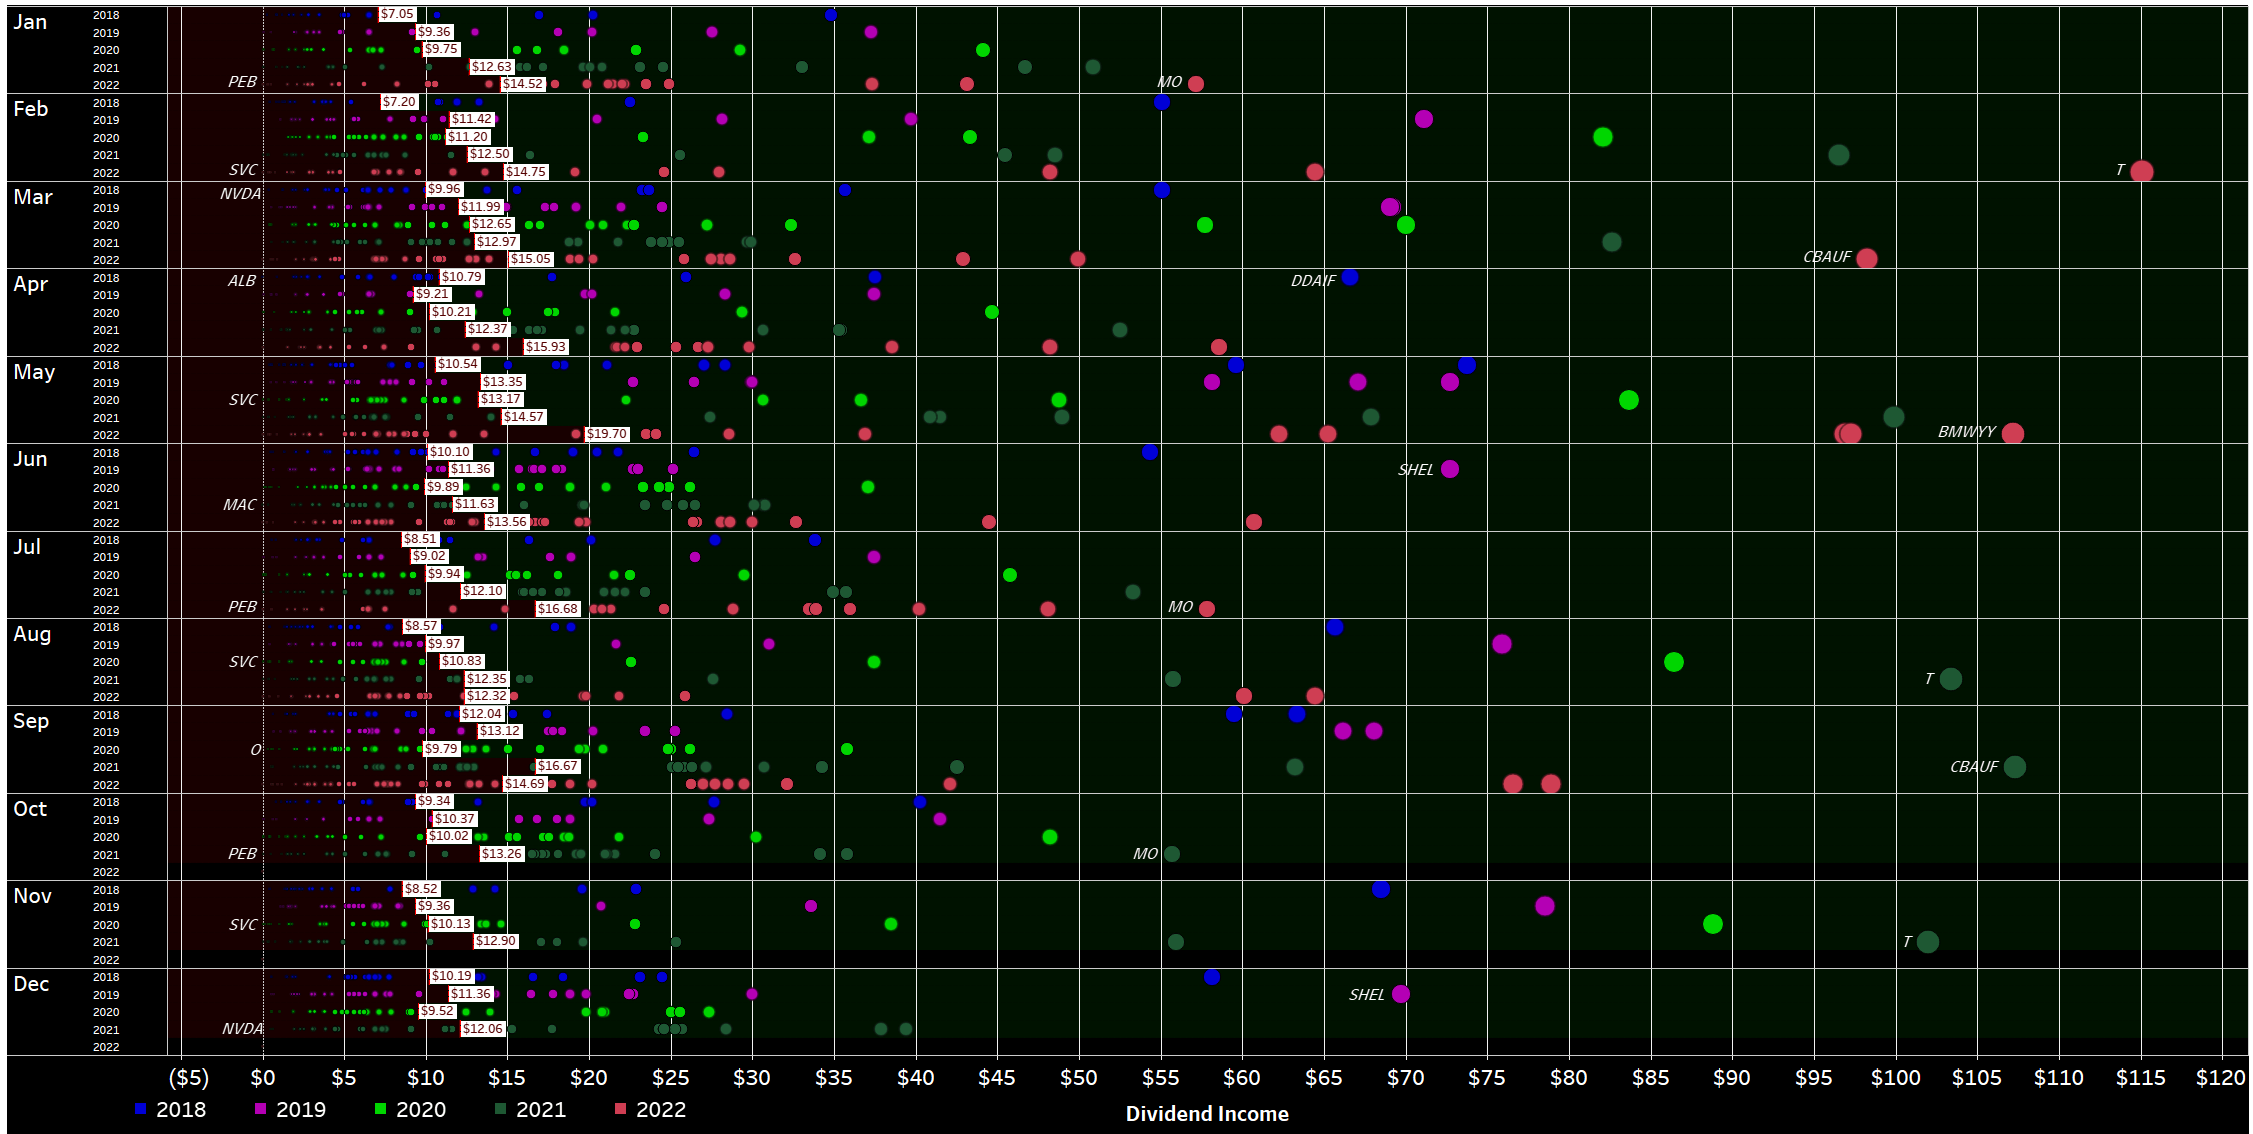
This view looks very cluttered at first, but it is very rich in information. It shows every single dividend payment I have received since I started my journey in 2015 in the shape of a circle colored differently by year and size, based upon their contribution. The view is broken down by month and by year (not by year and by month), and thus allows to better see the development over time. For every year of a certain month, a white rectangle indicates the average monthly dividend. The area where dividends fall below that average is filled dark red, whereas the area above is colored dark green. Personally, I absolutely love this redesigned view of my old “bubbles chart,” as it is much clearer to identify developments and trends in my dividend income.
September 2022 Dividends (Designed by author)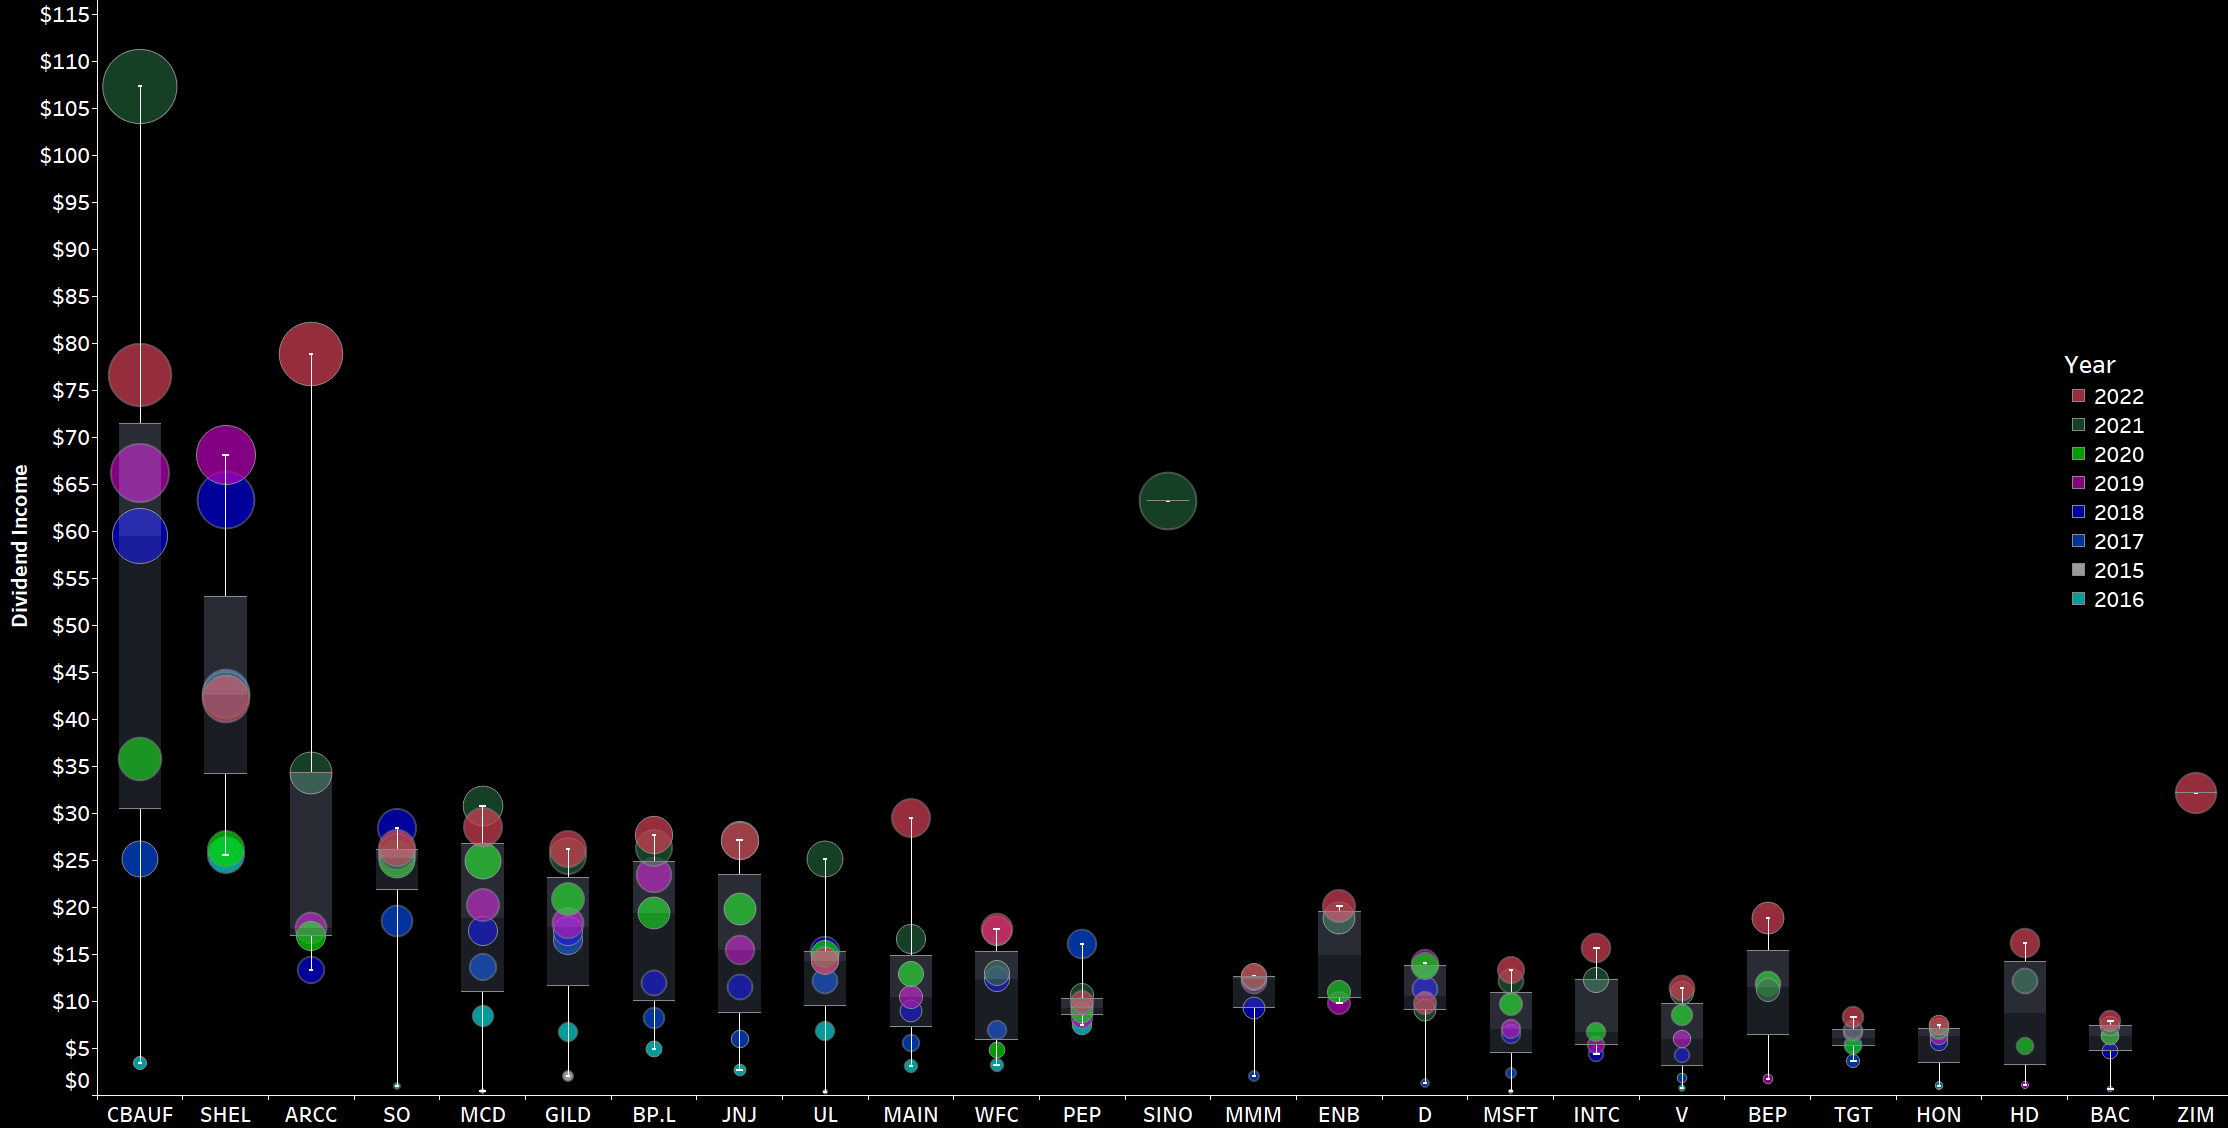
Now, zooming in on September, we can immediately see a number of big green circles in a sea of black. The bigger the circle and the bigger the distance to the previous circle for the same stock, the bigger is the change in dividend income compared to the prior years.
The biggest jump in annual dividend income is attributable to the Ares Capital Corporation which is driven exclusively by ongoing investments over the last 12 months. Regarding Shell (SHEL), we can easily see that despite the big dividend hike last year, dividend income still significantly trails the records set between 2017 and 2019 despite not having sold any shares. What’s more, we can also easily identify the big jump vs. 2020 as Shell is back on track of growing its dividend and, given very favorable macroeconomic conditions throughout the year, I do expect another significant bump in dividend income this year.
Another way to express the monthly dividend income is in terms of Gifted Working Time (GWT).
I am assuming an average hourly rate of $30.8 for 2022 here:
- In 2018, I generated 121 hours in GWT, equaling slightly more than $3,000 in annual net dividends.
- In 2019, I generated 142 hours in GWT, equaling almost $3,600 in annual net dividends.
- In 2020, I generated 152 hours in GWT, equaling roughly $3,800 in annual net dividends.
- In 2021, I generated 180 hours in GWT, equaling roughly $5,050 in annual net dividends.
- In 2022, I am targeting to reach at least $5,500 in annual net dividends, which equals roughly 179 hours in GWT. Despite the projected increase in annual net dividends I expect overall GWT to decrease following higher calculated hourly rates, a figure I project to rise by 10% given soaring inflation. The annual target of $5,500 is on the very cautious side as I need more visibility into how the year is progressing, particularly as I expect ongoing monthly investments to decline given elevated stock levels and rising inflationary and geopolitical pressures.
Across the years, the YTD Dividend Race as I like to call it looks as follows. While 2020 was fairly disappointing, 2021 was phenomenal as it benefited from a rather low baseline from the prior year. For 2022, I am targeting a conservative high single-digit growth rate for now, which is a very cautious estimate to begin with. YTD growth based on the first 8 months is still shattering my expectations coming in at 27% Y/Y, and while I expect some moderation over the course of the year, solid double-digit growth in annual dividend income is almost guaranteed already for this year. At this stage it becomes more and more likely that not only will I easily meet my initial goal of $5,500 in net dividend income but in fact exceed the $6,000 milestone comfortably. That would equate to at least $500 in net dividends per month which is a big number for me and more than enough to for instance pay all the utility bills which are soaring due to the war in Ukraine and its repercussions.
YTD Dividend Growth (Designed by author)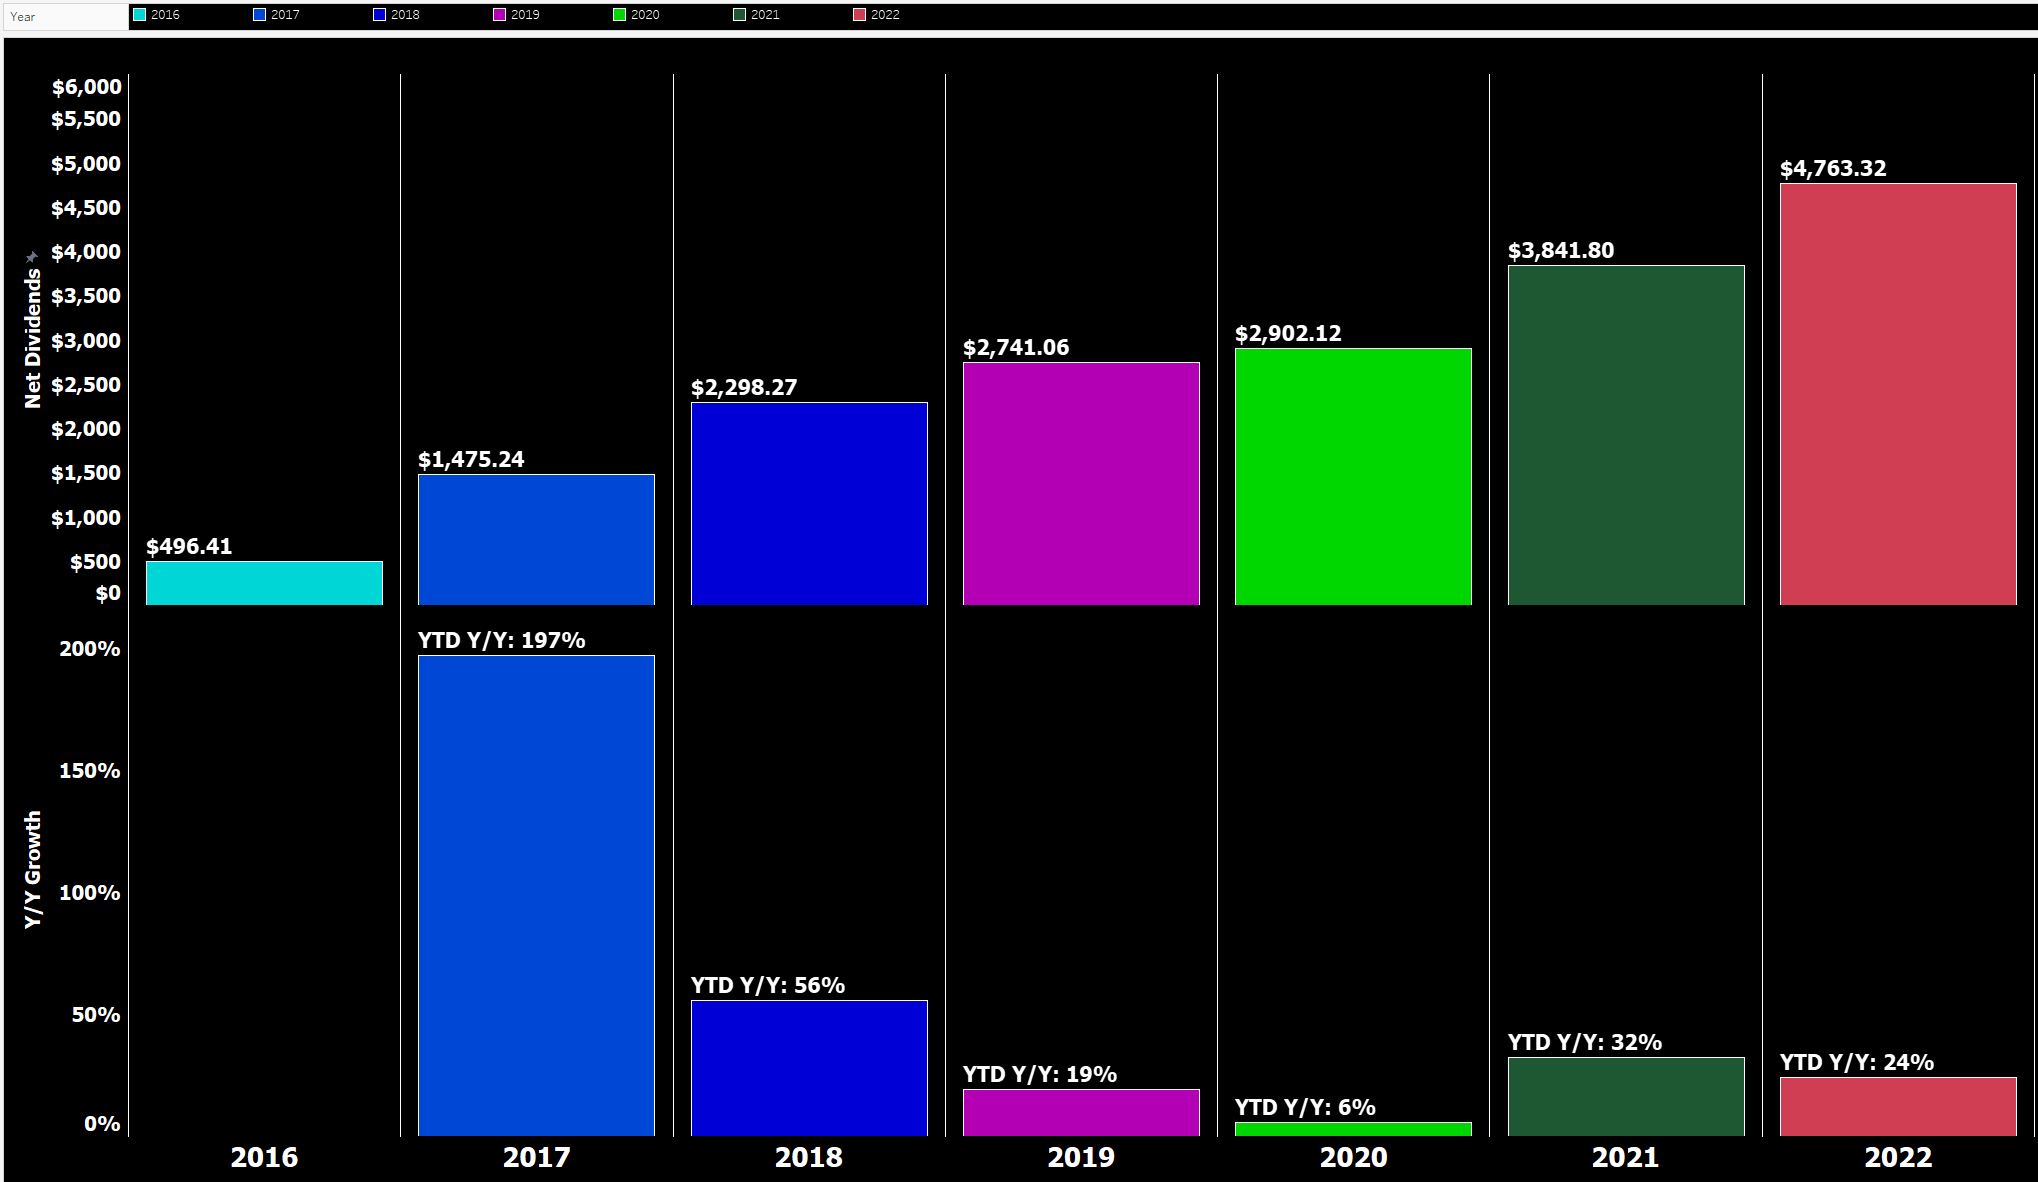
I have modified the YTD Dividend Race chart. Top left shows the YTD Dividend Race in the old format. At the top right, we can see how YTD dividend income developed on a daily basis and whereby we can easily identify that most of my dividend income is generated mid-month and towards the end of the month. At the bottom, that development is broken down by every individual month for the current year which makes big jumps clearly identifiable.
YTD Dividend Race (Designed by author)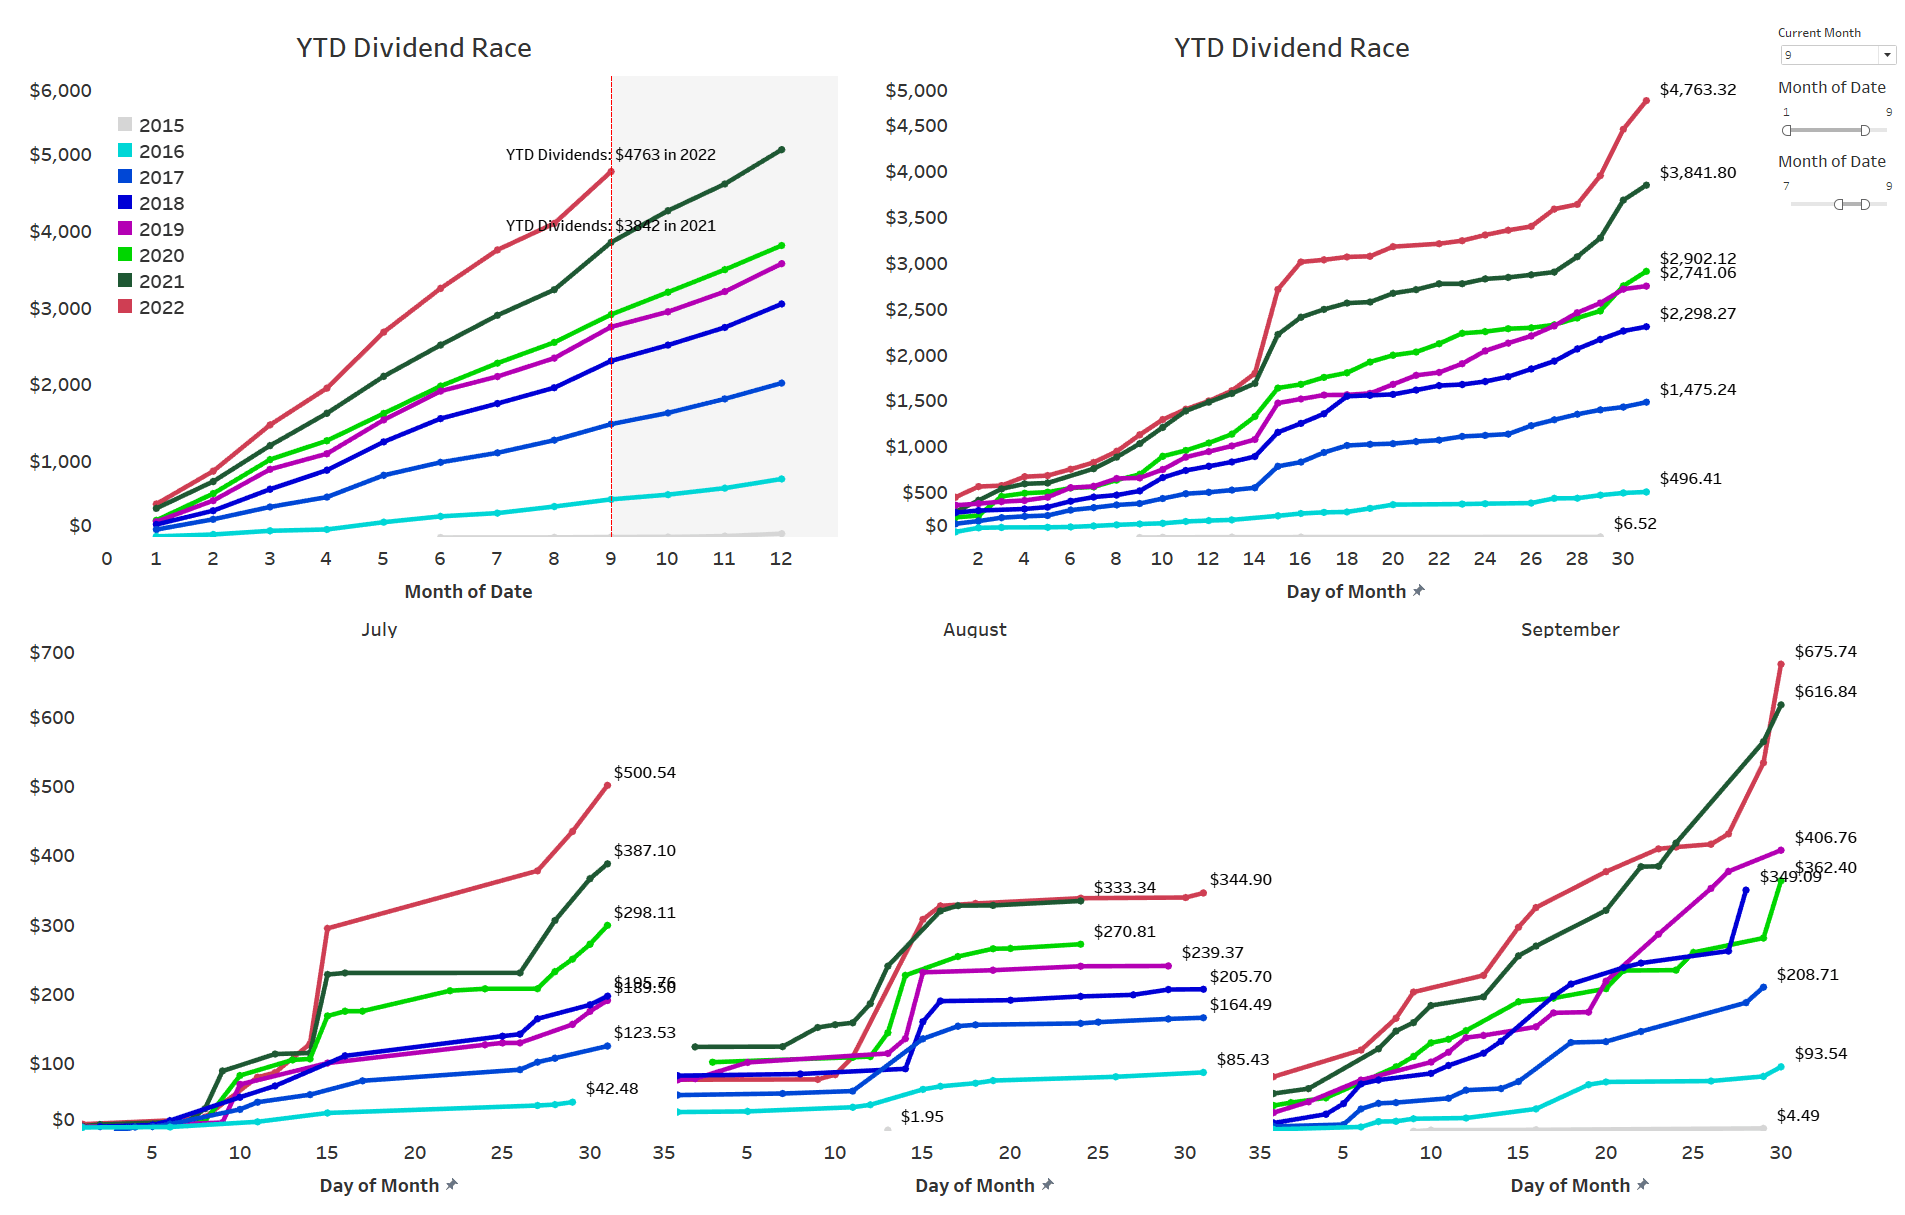
Expressed in GWT, it presents itself as follows:
Gifted Working Time in Hours (Designed by author)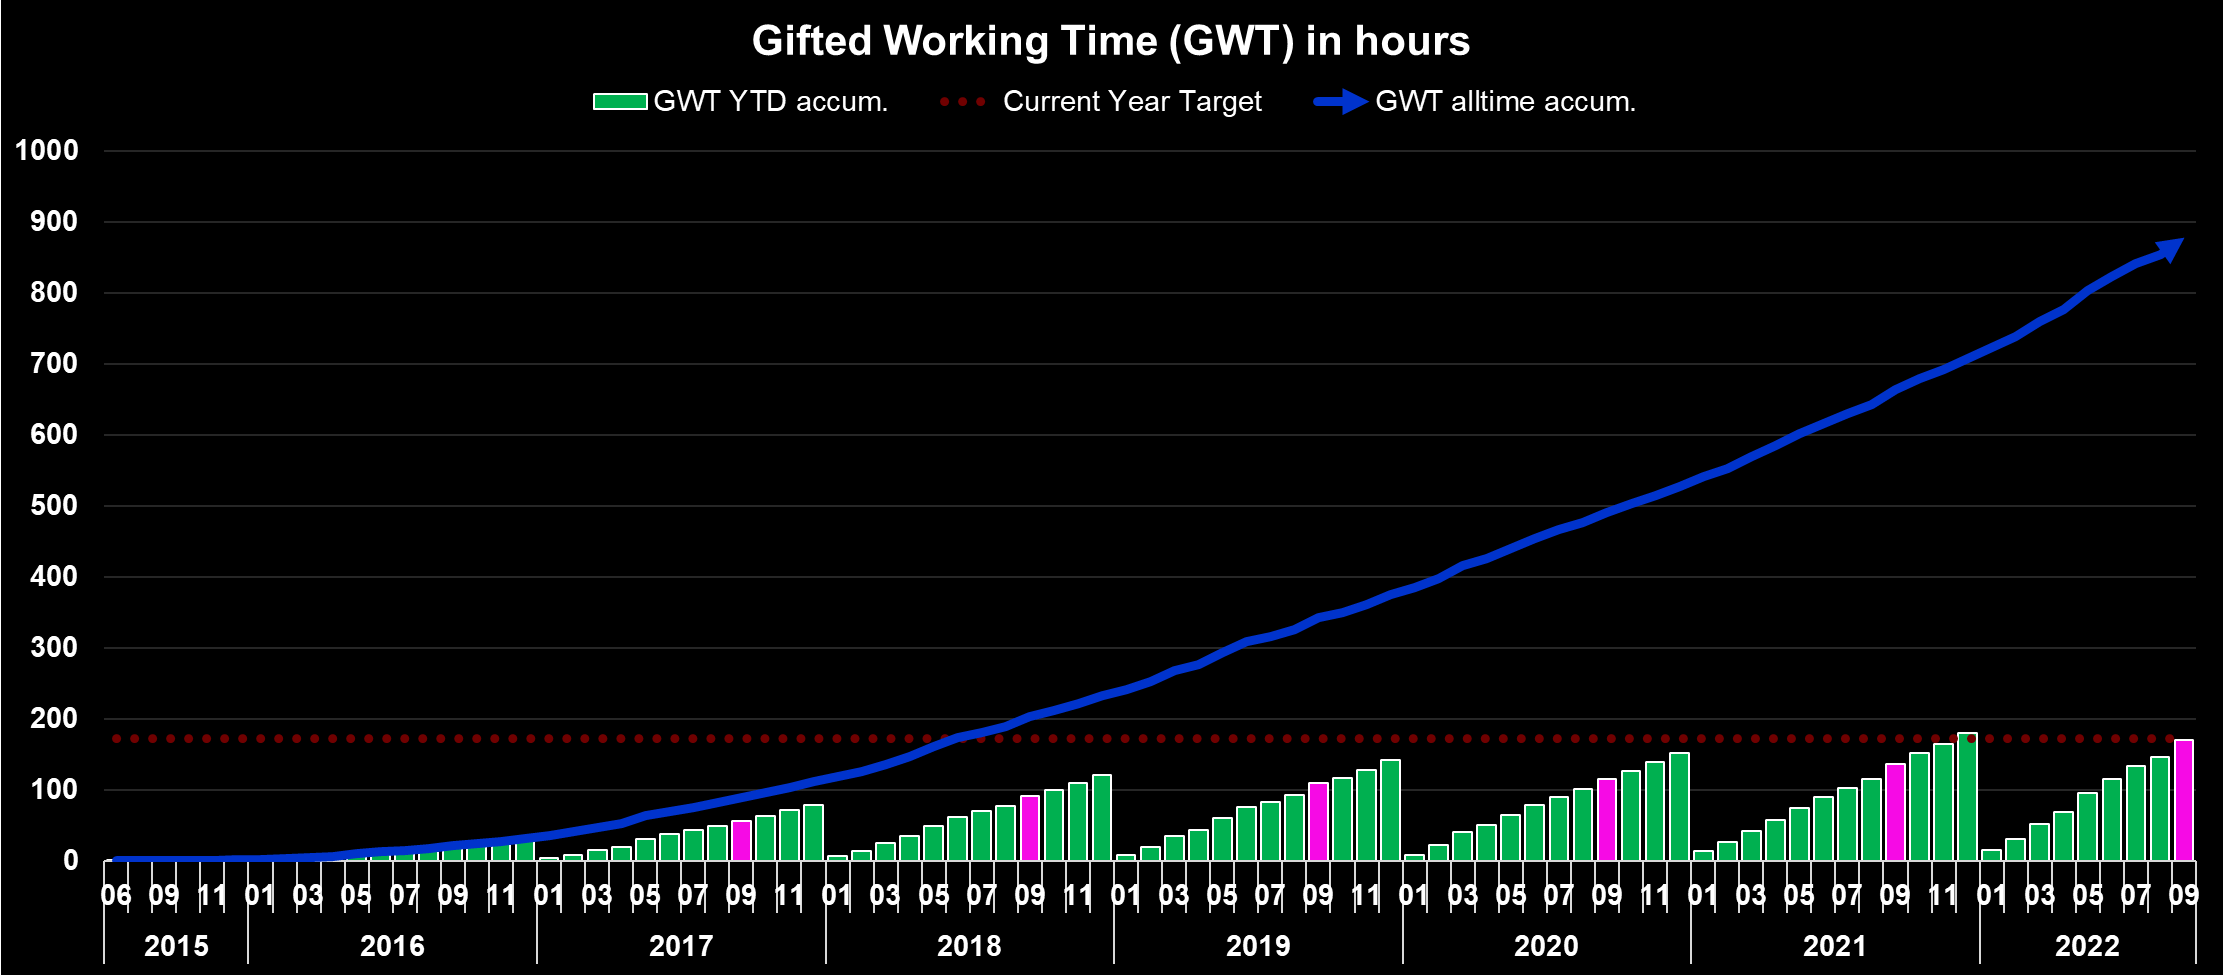
What this shows is as follows:
- All time (blue area) – Around 878 hours, or 109.7 days, of active work have been replaced with passive income since the start of my dividend journey. Assuming a five-day workweek this translates into more almost 22 weeks of vacation funded via dividends.
- YTD (green bars) – Around 170 hours, or 21.3 days, of active work have been replaced with passive income in 2022 already, which equals more than 4 weeks’ worth of active work funded via dividends.
- Highlighted in pink is the accumulated YTD total at the end of the current reporting month (September).
Upcoming October Dividends
As every month, October is packed with dividend payments heavily concentrated around the 15th and at month-end when the dividend checks from Canada’s big banks as well as JPMorgan will be arriving over a period of just 3-4 days.
Given the majority of my savings plans feature companies that pay dividends in January such as W. P. Carey, Altria (MO), Cisco Systems (CSCO), JPMorgan, Toronto-Dominion Bank, Bank of Nova Scotia, Stryker (SYK), Medtronic (MDT) as well as ongoing investments into stocks like New Residential Investment Corp. (RITM) and Annaly Capital (NLY), it surely is going to be a big month that should easily set a new all-time dividend record for the month of October.
My Dividend Calendar (Designed by author)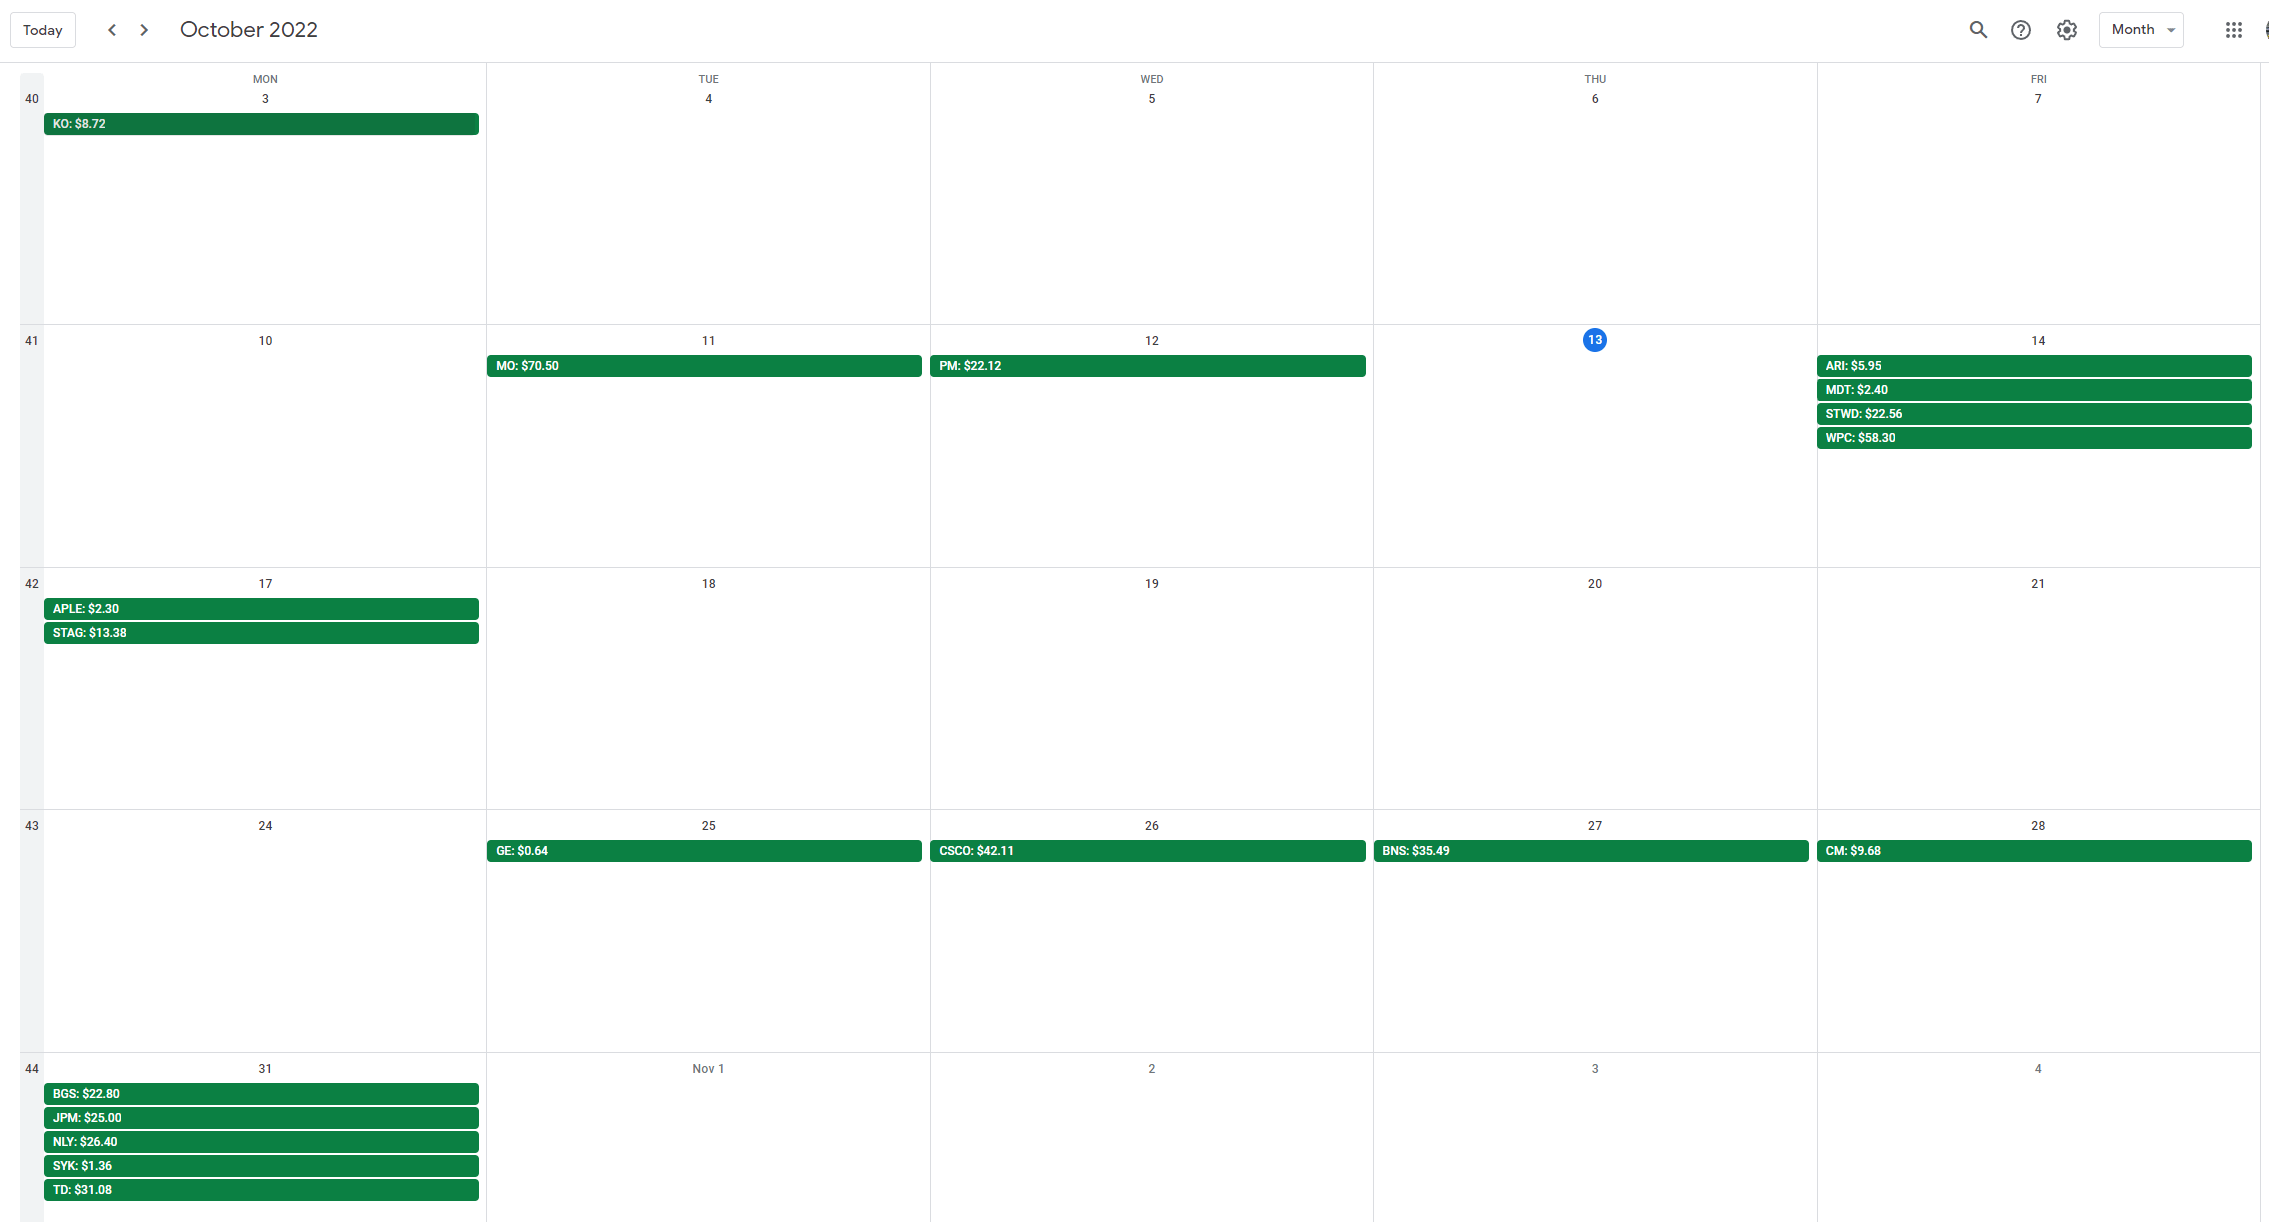
The snapshot above is taken from my newly and free-for-all released Dividend Calendar (make sure to follow instructions in the video) and shows my expected dividend payments in October.
At the end of September, my dividend portfolio is composed as follows:
| Company Name | Ticker | % Market Value | Market Value (€) |
| Apple Inc. | (AAPL) | 12.11% | 23,168 |
| Visa Inc | (V) | 4.22% | 8,072 |
| AbbVie Inc | (ABBV) | 3.81% | 7,297 |
| McDonald’s Corp | (MCD) | 3.70% | 7,078 |
| Microsoft Corporation | (MSFT) | 3.47% | 6,635 |
| Cisco Systems, Inc. | (CSCO) | 2.82% | 5,395 |
| Johnson & Johnson | (JNJ) | 2.65% | 5,079 |
| Commonwealth Bank of Australia | (OTCPK:CBAUF) | 2.63% | 5,031 |
| W.P. Carey | (WPC) | 2.54% | 4,852 |
| AT&T Inc. | (T) | 2.35% | 4,489 |
| Main Street Capital Corporation | (MAIN) | 2.27% | 4,338 |
| Shell | (SHEL) | 2.12% | 4,065 |
| Southern Co | (SO) | 2.09% | 3,990 |
| Stag Industrial Inc | (STAG) | 1.89% | 3,625 |
| Texas Instruments Incorporated | (TXN) | 1.81% | 3,457 |
| Ares Capital Corporation | (ARCC) | 1.79% | 3,424 |
| Altria Group Inc | (MO) | 1.77% | 3,390 |
| Wells Fargo & Co | (WFC) | 1.76% | 3,373 |
| Home Depot | (HD) | 1.68% | 3,223 |
| Toronto-Dominion Bank | (TD) | 1.68% | 3,217 |
| JPMorgan Chase & Co. | (JPM) | 1.68% | 3,212 |
| Gilead Sciences, Inc. | (GILD) | 1.49% | 2,856 |
| Store Capital | (STOR) | 1.49% | 2,850 |
| Medical Properties Trust | (MPW) | 1.48% | 2,823 |
| Bank of Nova Scotia | (BNS) | 1.42% | 2,725 |
| Siemens Healthineers | (OTCPK:SEMHF) | 1.25% | 2,400 |
| NVIDIA Corporation | (NVDA) | 1.19% | 2,284 |
| Allianz SE | (OTCPK:ALIZF) | 1.14% | 2,189 |
| PepsiCo, Inc. | (PEP) | 1.05% | 2,001 |
| Morgan Stanley | (MS) | 1.04% | 1,997 |
| Blackstone Group LP | (BX) | 0.99% | 1,885 |
| Procter & Gamble Co | (PG) | 0.93% | 1,782 |
| Intel Corporation | (INTC) | 0.88% | 1,685 |
| BMW | (OTCPK:BMWYY) | 0.88% | 1,679 |
| Brookfield Renewable Partners | (BEP) | 0.88% | 1,676 |
| Broadcom Inc | (AVGO) | 0.87% | 1,672 |
| Philip Morris International Inc. | (PM) | 0.86% | 1,654 |
| Enbridge | (ENB) | 0.82% | 1,571 |
| New Residential Corporation | (NRZ) | 0.82% | 1,565 |
| Bank of America Corp | (BAC) | 0.79% | 1,511 |
| Honeywell International Inc. | (HON) | 0.78% | 1,502 |
| BP1 | (BP) | 0.75% | 1,435 |
| BP2 | (BP) | 0.71% | 1,358 |
| Target Corporation | (TGT) | 0.69% | 1,323 |
| Dominion Energy Inc | (D) | 0.64% | 1,233 |
| 3M Co | (MMM) | 0.64% | 1,222 |
| The Coca-Cola Co | (KO) | 0.64% | 1,218 |
| Realty Income Corp | (O) | 0.62% | 1,194 |
| Starwood Property Trust, Inc. | (STWD) | 0.60% | 1,150 |
| NextEra Energy Partners LP | (NEP) | 0.60% | 1,144 |
| Daimler | (DDAIF) | 0.60% | 1,140 |
| CVS Health Corp | (CVS) | 0.55% | 1,044 |
| Gladstone Commercial Corporation | (GOOD) | 0.54% | 1,032 |
| B&G Foods, Inc. | (BGS) | 0.52% | 989 |
| Unilever NV ADR | (UL) | 0.52% | 986 |
| Royal Bank of Canada | (RY) | 0.49% | 941 |
| Apple Hospitality REIT | (APLE) | 0.49% | 930 |
| Verizon Communications Inc. | (VZ) | 0.47% | 895 |
| Stryker | (SYK) | 0.42% | 799 |
| Canadian Imperial Bank of Commerce | (CM) | 0.39% | 756 |
| AGNC Investment Corporation | (AGNC) | 0.39% | 739 |
| NextEra Energy | (NEE) | 0.38% | 731 |
| Medtronic | (MDT) | 0.37% | 711 |
| Sino AG | (XTP.F) | 0.36% | 690 |
| Walgreens Boots Alliance Inc | (WBA) | 0.35% | 662 |
| Pfizer Inc. | (PFE) | 0.34% | 643 |
| BASF | (OTCQX:BASFY) | 0.31% | 584 |
| Exxon Mobil Corporation | (XOM) | 0.30% | 567 |
| Antero Midstream Corporation | (AM) | 0.29% | 550 |
| Kinder Morgan Inc | (KMI) | 0.29% | 549 |
| General Electric Company | (GE) | 0.27% | 509 |
| Alibaba Group Holding Ltd | (BABA) | 0.24% | 461 |
| Annaly Capital Management | (NLY) | 0.23% | 442 |
| BRT Realty Trust | (BRT) | 0.21% | 397 |
| Enterprise Products Partners L.P. | (EPD) | 0.21% | 396 |
| Colgate-Palmolive Company | (CL) | 0.21% | 393 |
| Omega Healthcare Investors Inc | (OHI) | 0.20% | 389 |
| Sixt | (OTC:SXTSY) | 0.19% | 366 |
| Energy Transfer Partners | (ET) | 0.19% | 366 |
| MPLX LP | (MPLX) | 0.19% | 360 |
| Mastercard | (MA) | 0.18% | 342 |
| Bayer AG | (OTCPK:BAYZF) | 0.16% | 307 |
| ZIM Integrated Shipping Services | (ZIM) | 0.15% | 283 |
| Brookfield Infrastructure Partners L.P. | (BIP) | 0.13% | 248 |
| Apollo Investment | (MFIC) | 0.13% | 246 |
| Apollo Commercial Real Est. Finance Inc | (ARI) | 0.12% | 238 |
| Prudential Financial | (PRU) | 0.10% | 191 |
| Uniti Group Inc | (UNIT) | 0.10% | 186 |
| Vonovia | (OTCPK:VONOY) | 0.09% | 170 |
| Lumen Technologies | (LUMN) | 0.08% | 148 |
| Fresenius SE | (OTCPK:FSNUF) | 0.07% | 140 |
| Equitrans Midstream Corporation | (ETRN) | 0.07% | 129 |
| Boeing | (BA) | 0.06% | 112 |
| Walt Disney Co | (DIS) | 0.06% | 112 |
| Newtek Business Services | (NEWT) | 0.06% | 105 |
| Bank of Montreal | (BMO) | 0.05% | 93 |
| Hercules Capital | (HTGC) | 0.04% | 74 |
| Fresenius Medical Care | (FMS) | 0.04% | 67 |
| Diversified Healthcare Trust | (DHC) | 0.03% | 62 |
| The GEO Group Inc | (GEO) | 0.03% | 58 |
| Service Properties Trust | (SVC) | 0.02% | 34 |
Be the first to comment