

Adrian Vidal/iStock via Getty Images
Dividend Kings
The Dividend Kings are an elite group of companies that have all paid and increased dividends for at least 50 consecutive years. There are multiple lists of dividend kings on the internet, some that include more than 40 companies. I have chosen to use the list provided by Suredividend.com because they offered a very good explanation for why certain companies should not be included such as Illinois Tool Works (NYSE:ITW).
The dividend king list on Suredividend.com was updated on April 1st and remains unchanged from the prior month.
The 40 companies on the dividend king list span 9 unique sectors, offer an average dividend yield of 2.32% and have an average 5-year dividend growth history of 6.42%. Even though all 40 of these companies share the status of an elite dividend stock, not all will offer great returns going forward. So how can an investor identify the dividend kings that have a higher chance of offering better returns?
In my prior article, I shared a method for selecting the dividend kings that present the best opportunity for better than average future returns. The method leverages a long-term pattern of correlation between share price appreciation and long-term earnings growth. The pattern is more evident when applied to a group of stocks and measured over a longer time period. While this method may not work for all stocks, it can help identify a group of stocks that collectively can outperform a universe of stocks.
First, let me explain in more detail how and why this strategy may work and then I’ll share the real results.
EPS Growth Combined With Valuation
Forecasted EPS growth rates are a useful indicator of future returns, but this factor can be strengthened when combined with the current valuation of a given stock. My preferred method of valuation for dividend stocks is the dividend yield theory. The premise is simple, if the current dividend yield exceeds the trailing dividend yield, a stock is considered to be potentially undervalued and vice versa.
I have decided to test this theory on the dividend king universe of stocks going forward. Each month, I will select roughly the top quarter of dividend kings, 8 companies, that present the best-forecasted EPS growth rate combined with current valuation. I will be using analyst forecasted 5-year EPS growth rates from FinViz.com. Current valuation will be computed using current and trailing dividend yields obtained from Seeking Alpha. I will assume that a given stock can return to fair valuation within a 5-year period that aligns with the forecasted EPS growth rate. Potentially undervalued stocks will be awarded a boost to their forecasted EPS growth rate equivalent to the annualized rate of return necessary to bring the share price back to fair value within the 5-year period. Overvalued stocks will be penalized using the same principle in reverse.
Past Performance
The table below shows the returns for the chosen dividend kings using this methodology for the time period of July 2021 through March 2022.
|
Ticker |
Jul 21 |
Aug 21 |
Sep 21 |
Oct 21 |
Nov 21 |
Dec 21 |
Jan 22 |
Feb 22 |
Mar 22 |
|
ABM |
4.83% |
6.52% |
-9.11% |
-1.82% |
2.25% |
-9.22% |
2.52% |
7.53% |
2.70% |
|
ABT |
-5.37% |
-1.87% |
|||||||
|
BDX |
6.42% |
1.06% |
|||||||
|
CWT |
12.86% |
1.75% |
|||||||
|
FUL |
1.86% |
4.57% |
-4.45% |
9.50% |
3.76% |
10.72% |
-11.40% |
-3.36% |
|
|
HRL |
-1.81% |
-9.97% |
3.81% |
-2.17% |
17.90% |
||||
|
LOW |
-0.25% |
5.81% |
-0.51% |
15.68% |
4.61% |
5.68% |
-7.87% |
-6.86% |
|
|
MMM |
-9.57% |
0.15% |
|||||||
|
MO |
-3.33% |
||||||||
|
NDSN |
-0.19% |
6.74% |
0.63% |
-8.90% |
-2.39% |
0.26% |
|||
|
NWN |
-0.91% |
-4.37% |
13.13% |
||||||
|
PH |
1.60% |
-4.60% |
|||||||
|
PPG |
-9.42% |
-14.23% |
-1.78% |
||||||
|
SJW |
8.89% |
||||||||
|
SWK |
-1.92% |
-8.92% |
2.52% |
-2.33% |
-7.41% |
-6.84% |
-13.64% |
||
|
SYY |
-3.98% |
7.35% |
-0.85% |
-2.04% |
-8.92% |
12.15% |
0.08% |
11.45% |
-5.72% |
|
TR |
1.42% |
-3.85% |
|||||||
|
Return |
3.40% |
2.21% |
-4.73% |
4.19% |
-1.31% |
7.18% |
-5.17% |
-3.28% |
-2.91% |
|
Benchmark |
1.71% |
0.83% |
-5.33% |
4.05% |
-1.68% |
8.79% |
-3.88% |
-2.25% |
1.24% |
|
Alpha |
1.70% |
1.37% |
0.60% |
0.13% |
0.36% |
-1.61% |
-1.29% |
-1.04% |
-4.15% |
Only 1 out of the 8 chosen dividend kings for March finished last month with a return better than the average dividend king universe return. As a result, this strategy failed to generate alpha in March. The main culprits of underperformance were Stanley Black and Decker (SWK) with a loss of 13.64% and Sysco (SYY) with a loss of 5.72%. After this loss the strategy now slides 399 bps behind the average dividend king universe return since inception. March was the 4th consecutive month of underperformance; however, I believe in the long run this strategy will beat the its benchmark.
8 Best Dividend Kings For April
Since this method relies on two factors that are constantly changing, it is likely that we will experience a high turnover rate with this strategy. I have updated the analysts’ expected future earnings growth rates for all the dividend kings and applied the necessary valuation adjustments. Here are the 8 dividend kings with the best expected future growth rates for April.
Created by Author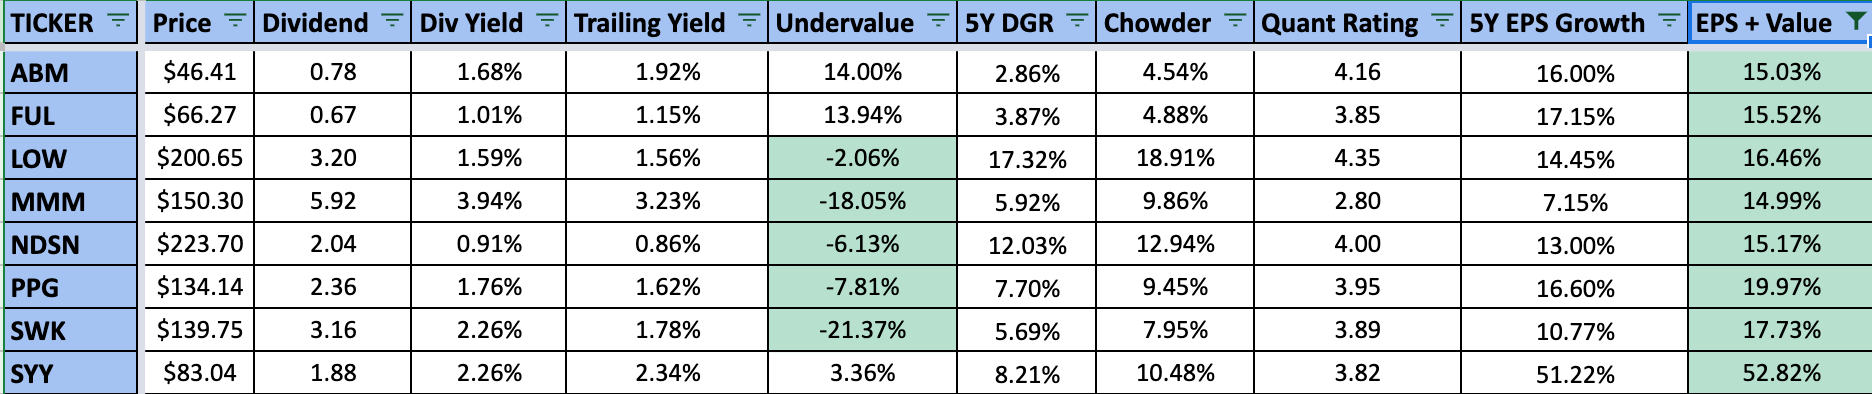
There is one change to the top 8 list this month. Abbott Labs (ABT) is replaced by Lowe’s (LOW). Valuations have recovered to some extent after many dividend kings posted positive returns last month, as a result the forward expected rate of growth for the top 8 kings decreases from 21.48% last month to 20.96% this month.
Please note that this stock selection strategy focuses solely on quantitative data. Further due diligence is necessary to ensure there are no major negative catalysts for each dividend king.
In addition to tracking the returns for the 8 best dividend kings each month, I also track how a buy-and-hold portfolio has performed for this stock selection method.
|
EPS + Value |
Benchmark |
Alpha |
|
|
Jul 21 |
3.40% |
1.71% |
1.70% |
|
Aug 21 |
1.99% |
0.83% |
1.16% |
|
Sep 21 |
-5.05% |
-5.33% |
0.28% |
|
Oct 21 |
4.54% |
4.05% |
0.48% |
|
Nov 21 |
-0.07% |
-1.68% |
1.60% |
|
Dec 21 |
7.75% |
8.79% |
-1.03% |
|
Jan 22 |
-4.89% |
-3.88% |
-1.02% |
|
Feb 22 |
-0.26% |
-2.25% |
1.99% |
|
Mar 22 |
-2.14% |
1.24% |
-3.38% |
|
Total |
4.64% |
2.80% |
1.84% |
The buy-and-hold portfolio for this strategy lost 2.14% in March, which was 77 bps better than the individual watchlist. Unfortunately, the March return was worse than the average dividend king universe return, and as a result, the alpha generated from this strategy since July decreased to 184 bps. A significant boost for the buy-and-hold portfolio were positive returns from Hormel (HRL) +8.19%, SJW Group (SJW) +6.69% and Tootsie Roll (TR) +6.97%. These 3 positions only made up 13.27% of the buy-and-hold portfolio at the end of February, and their positive impact in March was marginal.
Here is the current allocation of the buy-and-hold portfolio as of March 31, 2022.
|
TICKER |
ALLOCATION |
|
ABM |
13.03% |
|
ABT |
2.66% |
|
BDX |
3.05% |
|
CWT |
2.83% |
|
FUL |
10.74% |
|
HRL |
8.37% |
|
LOW |
10.37% |
|
MMM |
2.66% |
|
MO |
1.71% |
|
NDSN |
7.91% |
|
NWN |
4.90% |
|
PH |
2.58% |
|
PPG |
3.60% |
|
SJW |
1.55% |
|
SWK |
7.60% |
|
SYY |
13.35% |
|
TR |
3.09% |
A buy-and-hold approach is a much easier and more tax-friendly investing approach to adopt. Unless a portfolio is held in a tax-free or tax-deferred account, the impact of taxes as a result of moving in and out of positions each month would significantly impact total returns.
Performance For All Dividend Kings In 2022
All 40 dividend kings are down 4.90% year-to-date through month-end March. 20 dividend kings are outpacing the dividend king universe of stocks this year and are driving the return. The remaining 20 dividend kings are all trailing the dividend king universe return.
Best 5 Dividend Kings in 2022:
Worst 5 Dividend Kings in 2022:
Best 5 Dividend Kings in March:
None of the top five performing dividend kings in March were included in my best 8 dividend kings for the month.
Summary
I believe that targeting the 8 best dividend kings with the highest forecasted growth rate based on EPS growth forecasts and reversion to fair value will offer excess returns over the dividend king universe of stocks. It may take time to fully see the results; an ideal evaluation period will be 5 years. For some investors, that is a long period of time and I encourage all of you to do further due diligence on any of the companies I mentioned prior to investing. So far, this simple strategy is working out great, but 9 months of data is a relatively short period of time. I look forward to seeing what this method has to offer in the future.
Be the first to comment